 🏷️ Likely Rental
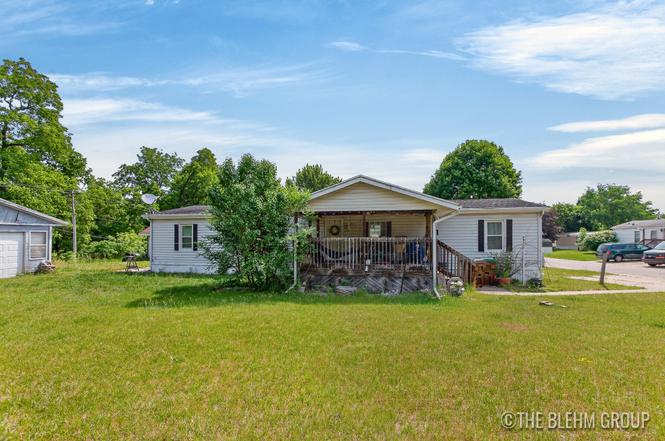
11235 Caron St SE · Lowell, MI
Flood risk No data
- FEMA flood zone
- —
- Chance of flooding over 30 yrs
- —
- Est. flood insurance / yr
- —
Fire risk No data
- Est. fire insurance / yr
- —
Heat risk No data
- Hot days now (above threshold)
- —
- Hot days in 30 yrs
- —
Wind risk No data
- Chance of severe wind over 30 yrs
- —
Air-quality risk No data
- Unhealthy air days now
- —
- Unhealthy air days in 30 yrs
- —
Risk factors via First Street. Map © Google.
Why this score? — see what drove the B+ grade
The composite is a weighted blend of 9 inputs, each scored 0–100. Each bar is that input's sub-score; the figure is the points it added to the 100-point composite (weight × sub-score).
- Cash flow +29.2/30.0
- ARV discount +15.0/15.0
- 1% rule +10.0/10.0
- DSCR +10.0/10.0
- Schools +5.0/10.0
- Livability +4.0/5.0
- Rent growth +2.5/5.0
- Condition / age +2.2/5.0
- Appreciation +0.0/10.0
$90,000
🖨 Deal sheet 📄 Offer letter ✓ Due diligence
Listing remarks MLS
Ideally located between the charm of historic Lowell and the conveniences of Grand Rapids. This 3-bedroom, 2-bath manufactured home, in Key Heights Village, offers a comfortable one-story layout with central air and heat, plus a 1-stall garage. Residents enjoy an impressive selection of community amenities, including a swimming pool, playground, dog park, basketball courts, RV storage, off-street parking, and recreational facilities. Conveniently situated just over 5 minutes from downtown Lowell, less than 15 minutes from M-37, and approximately 25 minutes from downtown Grand Rapids, this location provides easy access to shopping, dining, employment centers, and outdoor recreation. Mobile home in a park. Subject to park approval. No more than 2 dogs allowed. Subject to breed restrictions + pet rent.
Key facts
- Dog park
- Community amenities
- Swimming pool
Tags
Property features AI
Finance
- HOA & community: Monthly association with amenities that allow pets, include a playground and pool; Association fee approximately 632 monthly (includes water, trash, sewer)
Exterior
- Utilities: Water included in association fee; Trash service included in association fee; Sewer included in association fee
- Home design: Ranch-style single-family home; Built in 1987
- Construction: Vinyl siding; Shingle roof; Slab basement
- Exterior features: Corner lot; Shed(s); Paved road access
Interior
- Kitchen: Dishwasher; Disposal; Range; Refrigerator
- Bathrooms: 2 full bathrooms
- Heating & cooling: Forced air heating; Has cooling
- Interior features: Pantry; 7 total rooms
- Laundry & utility: Washer; Dryer
Neighborhood map
What this means for you Summary
Snapshot
- This is a 3-bed/2.0-bath manufactured listed at $90k. Condition is rated fair.
Deal economics
- At list price, monthly cash flow is $314 ($4k/yr) — positive.
- The deal already cash-flows at list — no discount required.
- Meets the 1% rule at list price ($2k rent vs $90k).
- Cap rate 10.5% vs local median 2.9% in Lowell — top-decile yield for the area; either an underpriced asset or a hidden risk that comps aren't pricing in. Stress-test before assuming the spread holds.
Location & tenants
- Location reads 80/100 on livability (#76 in MI, #1,669 nationally) — a professional / high-income tenant draw. Strengths: cost of living A+, housing A+, health & safety A+; Watch: amenities F, commute F.
- Lowell Area Schools (rural): math 51% / reading 64% proficiency, ranked #51 of 540 in MI (top 9%) — acceptable for families but not a draw, mixed tenant base, ~2y average lease.
- Market conditions: 116 active listings in the ZIP; 1 comparable units currently listed for rent nearby; 2,253 units permitted in Kent County in 2024 (969 in 5+ unit buildings).
Forward outlook
- Local home prices are declining (-3.0%/yr); year-one equity from $622 of loan paydown is wiped out by about $3k of value loss. Plan a longer hold.
- Kent County population projected at +22% by 2050 — long-run rental-demand tailwind backs the buy-and-hold thesis.
- At projected returns (-3.0% appreciation + 3.0% rent growth), your $25k cash investment doubles in ~8 years — after that, you're playing with house money.
Negotiation context
- Only 7 days on market — expect competitive offers; lowballing is unlikely to land.
- 3 sale attempts with the ask held roughly flat each time — persistent listings suggest the price (not the market) is what's stuck; bring a comps-based counter.
Risks & watch-outs
- Watch-outs: HOA is 32% of rent.
Questions for the listing agent
- Have any recent inspections been done? Can we get a copy of the seller's disclosures and any deferred-maintenance estimates?
- What does the HOA fee cover, when was the last increase, and are there any pending special assessments or reserve-fund shortfalls?
- Is there a deadline driving the sale (1031 exchange, divorce, estate, relocation)? That informs how much negotiation room exists.
- Schools are B-rated — typically a magnet for longer-tenancy family renters. What's the average tenant stay here, and is there a school-zone premium baked into asking?
- What's the average days-on-market for RENTAL listings here right now (not sales)? A rising rental-DOM trend means longer vacancies and softer asking-rent achievability than the comps imply.
- What's the recent tenant-quality profile in this submarket — average credit score on applications, eviction rate, late-payment / NSF rate, and stable-employment percentage? A property-management company in the area should have these aggregated.
- How much new for-sale + rental construction is in the pipeline within 1–3 miles? Heavy new supply typically softens prices + rents 12–24 months out; constrained supply supports both.
Investment metrics
- 1% rule
- 2.21% ✓
- Cap rate
- 10.48%
- Cash-on-cash
- 14.96%
- DSCR
- 1.67
- GRM
- 3.8
CMA / ARV
- ARV (on-the-fly)
- $139,200
- Comps found
- 1
Show comp detail 1 sale within ~0.75 mi
| Address | Dist | Beds/Ba | Sqft | Sold | Price | $/sf | Match |
|---|---|---|---|---|---|---|---|
| 1824 Rhoda St SE | 0.16mi | 4/2.0 (+1) | 1,646 (+3%) | 3mo | $144,000 | $87 | 81 |
Match score weights: distance 35% · size 25% · config 20% · recency 20%. Top-matched comps best support the ARV.
Projected returns pro-forma
-3.0% appreciation · 3.0% rent growth · sell at horizon
- IRR
- 5.9%
- Equity multiple
- 1.23×
- Total profit
- $5,845
- Equity at exit
- $13,419
- IRR
- 15.6%
- Equity multiple
- 2.29×
- Total profit
- $32,556
- Equity at exit
- $7,782
Cash invested: $25,200 (down + closing). Projections, not guarantees.
Landlord ↔ Tenant lean methodology
- Overall (STATE)
- 62 Landlord-Friendly
- State Michigan
- 62 Landlord-Friendly · EVEN
- County
- — inherits STATE
- City
- — inherits STATE
ZIP-level market 49331
- Home prices YoY
- -31.2%
- Active inventory
- 116
- Price-to-rent
- 3.8×
Monthly cashflow live
- Estimated rent
- $1,985 medium interval (Pro) →
- Mortgage (P&I)
- −$472
- Tax est. 1.5%
- −$112 /mo · $1,350/yr
- Insurance
- −$38
- HOA
- −$632
- Vacancy / Maint / Mgmt
- −$417
- Net cashflow
- $314
Break-even live
UW: 25.0% down · 7.5% · 30yr · 1.5% tax · 5.0% vac · 8.0% maint · 8.0% mgmt
Financing live
Cash to close
- Down payment
- $22,500
- Closing costs
- $2,700
- Reserves months
- —
- Total cash needed
- —
Loan-product check · same deal, 3 products live
Conventional
25% down · 7.5% · 30yr
- Down + closing
- —
- Monthly P&I
- —
- Monthly cashflow
- —
- DSCR
- —
- Eligible?
- —
Personal DTI + credit; lowest rate.
DSCR
20% down · 8.5% · 30yr
- Down + closing
- —
- Monthly P&I
- —
- Monthly cashflow
- —
- DSCR
- —
- Eligible?
- —
No personal income docs; deal must DSCR.
Hard money
10% down · 12.0% · 12mo
- Down + closing
- —
- Monthly P&I
- —
- Monthly cashflow
- —
- DSCR
- —
- Eligible?
- —
Short-term bridge; refi at stabilization.
Rent comps 1 comps
| Address | Beds | Baths | Sqft | Rent | $/sqft | DOM | Units | Dist |
|---|---|---|---|---|---|---|---|---|
| 11731 Boulder Dr SE Lowell, MI | 1.0–2.0 | 1.0–2.0 | 1081 | $1,985 | $1.84 | 2d | 2 | 0.68mi |
HOA detail
- Monthly dues
- $632 · $7,584/yr
- Likely covers
- pool
Listing history 7 events
-
2026-06-18days on market $90,000 Active 7 DOM
-
2026-06-17days on market $90,000 Active 6 DOM
-
2026-06-16days on market $90,000 Active 5 DOM
-
2026-06-15days on market $90,000 Active 4 DOM
-
2026-06-14days on market $90,000 Active 2 DOM
-
2026-06-13remarks 699-char remark
-
2026-06-13$90,000 Active 1 DOM
ⓘ Source: listings_history table (triggers on properties + properties_extension) + one-shot
backfill from property_details.listing_events for pre-trigger history.
Nearby sold comps map
Loading sold comps map…
Walkable amenities ~0.75 mi
Loading nearby amenities…
Taxation est. · year 1
- Rental income
- $23,820
- − Mortgage interest
- −$5,041
- − Property taxes
- −$1,350
- − Insurance
- −$450
- − Repairs & maintenance
- −$1,906
- − Management
- −$1,906
- − HOA
- −$7,584
- − Depreciation
- −$2,618
- Taxable income
- $2,965
- Est. tax owed @ 24.0%
- −$712
- After-tax cash flow
- $3,059/yr
For passive investors: Depreciation is non-cash, so a rental often shows a tax loss while cash-flowing — sheltering income. Rental losses are passive: they offset passive income freely, and up to $25,000/yr can offset ordinary (W-2) income if you actively participate and your MAGI is under $100k (phasing out to $0 by $150k); unused losses carry forward. On sale, claimed depreciation is recaptured at up to 25%, and gains may owe capital-gains tax (a 1031 exchange can defer both). Figures are a year-1 estimate at your 24.0% rate — not tax advice; consult a CPA.
Condition & rehab AI · 13 photos
The home requires significant repairs and renovations to improve its condition and value. A new roof, exterior siding, flooring, and bathroom renovation would significantly increase its resale and rental value.
Repairs flagged
- Major roof — Significant wear and tear
- Major exterior siding — Weathered and damaged
- Major flooring — Worn and stained
- Major interior walls/paint — Worn and damaged
- Major bathrooms — Worn fixtures and outdated design
Value-add opportunities
- Resale new roof — New roof would significantly improve the home's appearance and value
- Resale exterior siding — New siding would improve the home's curb appeal and value
- Resale new flooring — New flooring would improve the home's appearance and value
- Resale new interior paint — New paint would improve the home's appearance and value
- Resale bathroom renovation — Renovated bathrooms would improve the home's appearance and value
Renovation cost estimate screening
| Repair item | Severity | Est. cost |
|---|---|---|
| roof · Significant wear and tear | Major | $15,000–50,000 |
| exterior siding · Weathered and damaged | Major | $15,000–50,000 |
| flooring · Worn and stained | Major | $15,000–50,000 |
| interior walls/paint · Worn and damaged | Major | $15,000–50,000 |
| bathrooms · Worn fixtures and outdated design | Major | $15,000–50,000 |
| Total estimated repair cost · 5 items | $75,000–250,000 |
Value-add ROI direction
- Resale new roof — New roof would significantly improve the home's appearance and value ↑
- Resale exterior siding — New siding would improve the home's curb appeal and value ↑
- Resale new flooring — New flooring would improve the home's appearance and value ↑
- Resale new interior paint — New paint would improve the home's appearance and value ↑
- Resale bathroom renovation — Renovated bathrooms would improve the home's appearance and value ↑
ⓘ Cost ranges are severity-bucket heuristics (US national rule-of-thumb). Get contractor quotes + a written scope before underwriting a rehab budget.
Schools (NCES district)
- District
- Lowell Area Schools
- NCES district ID
- 2622050
- Math proficiency
- 51% ▼ -6.00%
- Reading proficiency
- 64% ▼ -3.00%
- Median HH income
- $64,828
- Composite
- 50.37/100
- National rank
- #1873
- State rank
- #51 of 540 in MI
Livability — Lowell
- Score
- 80/100
- State rank
- #76
- US rank
- #1669
Category grades
Schools grade is shown separately in the Schools card above.
Census & demographics
- Population (ZIP)
- 17,419
Population outlook (Kent County) Hauer SSP2
- Today (2025)
- 712,484 people
- By 2030
- 748,618 · +5.1%
- By 2040
- 814,777 · +14.4%
- By 2050
- 868,556 · +21.9%
- By 2075
- 966,487 · +35.7%
- By 2100
- 967,975 · +35.9%
Race, ethnicity, and origin ACS 2023
- Neighborhood character
- Predominantly White (88%)
- Race & ethnicity
- White 88% Two or more races 7% Hispanic / Latino 4% Black 1%
- Common ancestry
- Iranian 16% Romanian 8% Italian 3%
- Foreign-born
- 1%
- Languages at home
- 98% English-only · French/Haitian/Cajun 1% Spanish 1% Other Asian/Pacific 1%
Political lean MEDSL · Kent
- 2024 margin
- Lean D (+5.4) · D 51.8% · R 46.5% · Other 1.7%
- 2008→2024 swing
- +4.8pp toward D · 2008: 0.5pp · 2024: 5.4pp
- All cycles
- 2024: D+5.4 2020: D+6.1 2016: R+3.1 2012: R+7.9 2008: D+0.5
Not yet ingested
- Civics
- —
Market trends
- HPI YoY
- ▼ -120.98%
- Current HPI
- 266.8058
- Rent YoY
- —
- Metro
- —
- State GDP YoY
- ▲ 1.37%
- F500 in state
- 28
Industry mix (Fortune 500 HQ in MI)
| Industry | F500 HQs | Revenue |
|---|---|---|
| Automotive Parts | 3 | $48B |
|
||
| Automotive | 2 | $372B |
|
||
| Chemicals | 1 | $45B |
|
||
| Automotive Retail | 1 | $29B |
|
||
| Healthcare / Medical Devices | 1 | $23B |
|
||
| Automotive Technology | 1 | $20B |
|
||
Price history
+0.0% since first listed3 events — show timeline
- 2026-06-11 Listed $90,000 MiRealSource-MiMLS
- 2026-06-11 Listed $90,000 REALCOMP
- 2026-06-11 Listed $90,000 SW Michigan MLS
Cash-flow waterfall
monthlySold comps — $/sqft
last 12 mo · ≤1 miLoading sold comps…