4114 Aganier · San Antonio, TX
Flood risk 1/10 · Minimal
- FEMA flood zone
- X (unshaded)
- Chance of flooding over 30 yrs
- 0.0%
- Est. flood insurance / yr
- $507 – $1,088
Fire risk 1/10 · Minimal
- Est. fire insurance / yr
- $1,222 – $2,270
Heat risk 8/10 · Major
- Hot days now (above 108°F)
- 7 days/yr
- Hot days in 30 yrs
- 22 days/yr
Wind risk 8/10 · Major
- Chance of severe wind over 30 yrs
- 80.0%
Air-quality risk 2/10 · Minimal
- Unhealthy air days now
- 1 days/yr
- Unhealthy air days in 30 yrs
- 1 days/yr
Risk factors via First Street. Map © Google.
Why this score? — see what drove the C+ grade
The composite is a weighted blend of 9 inputs, each scored 0–100. Each bar is that input's sub-score; the figure is the points it added to the 100-point composite (weight × sub-score).
- Cash flow +22.2/30.0
- ARV discount +15.0/15.0
- DSCR +7.1/10.0
- 1% rule +7.0/10.0
- Livability +4.0/5.0
- Rent growth +2.7/5.0
- Condition / age +2.5/5.0
- Schools +1.4/10.0
- Appreciation +0.0/10.0
$83,000
🖨 Deal sheet 📄 Offer letter ✓ Due diligence
Listing remarks MLS
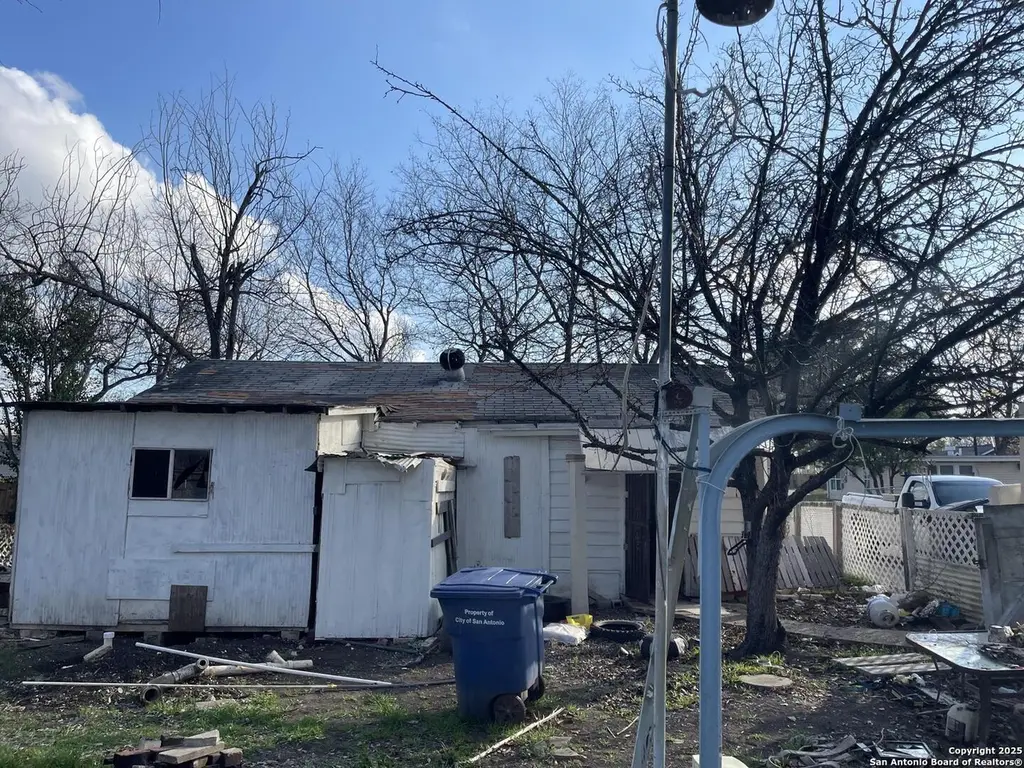
Prime Lot in the Alamo Quarry Market Area!Discover a fantastic investment opportunity in one of San Antonio's most up-and-coming neighborhoods. This property is a generous lot with mature trees and easy access to major highways, dining, and shopping.The existing one-bedroom home is in need of significant repairs and is currently under demolition compliance - presenting the perfect chance for a new build tailored to your vision.Buyer to verify all building requirements and compliance details with the city.
Key facts
- Prime lot
- Shopping
- Dining
Tags
Neighborhood map
What this means for you Summary
Snapshot
- This is a 1-bed/1.0-bath single-family listed at $83k.
Deal economics
- At list price, monthly cash flow is $135 ($2k/yr) — positive.
- The deal already cash-flows at list — no discount required.
- Meets the 1% rule at list price ($997 rent vs $83k).
- Recommended offer: $73k (12.0% below list) — sets the bar for market timing.
- Cap rate 8.2% vs local median 3.8% in San Antonio — top-decile yield for the area; either an underpriced asset or a hidden risk that comps aren't pricing in. Stress-test before assuming the spread holds.
Location & tenants
- Location reads 80/100 on livability (#31 in TX, #1,616 nationally) — a professional / high-income tenant draw. Strengths: amenities A+, commute A+, cost of living A+; Watch: schools C-, crime F.
- San Antonio ISD (urban): math 12% / reading 22% proficiency, ranked #805 of 826 in TX (top 98%) — low school quality limits family demand, transient renter base, plan for 1-2y turnover; 80% free/reduced lunch — lower-income household profile, screen leases tightly.
- Market conditions: Rents flat; 175 active listings in the ZIP; 24 comparable units currently listed for rent nearby; rentals at typical pace (median 24d on market — plan ~3-4 weeks tenant-placement turnaround); 42% of comp listings sitting > 30 days — soft ceiling on asking rent; 8,308 units permitted in Bexar County in 2024 (2,506 in 5+ unit buildings).
Forward outlook
- Local home prices are declining (-3.0%/yr); year-one equity from $574 of loan paydown is wiped out by about $2k of value loss. Plan a longer hold.
- Bexar County population projected at +50% by 2050 — long-run rental-demand tailwind backs the buy-and-hold thesis.
Negotiation context
- It's been on market 407 days — a 12% lower offer ($73k) is reasonable based on typical stale-listing flexibility.
Risks & watch-outs
- Watch-outs: property tax is 2.6% of price; built in 1948 — expect roof / HVAC / electrical / plumbing capex.
- Climate carrying-cost: severe wind risk, 80% chance of damaging wind over 30y; extreme-heat days projected 7→22/yr by 2055 (HVAC capex compounding) — expect insurance premiums to compound above CPI over the hold.
Questions for the listing agent
- It's been on market 407 days. Have you received any prior offers? Is the seller open to a 12% concession, seller financing, or rate buy-down credit?
- Built in 1948 — when were the roof, HVAC, electrical panel, plumbing, and water heater last replaced?
- Property tax is high relative to price — has the assessment been appealed recently, and will the sale trigger a re-assessment?
- Why hasn't it sold? Are there any deal-killer items the seller is aware of (foundation, flood, title, zoning, code violations)?
- Is there a deadline driving the sale (1031 exchange, divorce, estate, relocation)? That informs how much negotiation room exists.
- Crime grade is F in this area — have there been break-ins, vandalism, or insurance claims at this property in the last 3 years? What carrier currently insures it and at what premium?
- What's the average days-on-market for RENTAL listings here right now (not sales)? A rising rental-DOM trend means longer vacancies and softer asking-rent achievability than the comps imply.
- What's the recent tenant-quality profile in this submarket — average credit score on applications, eviction rate, late-payment / NSF rate, and stable-employment percentage? A property-management company in the area should have these aggregated.
- How much new for-sale + rental construction is in the pipeline within 1–3 miles? Heavy new supply typically softens prices + rents 12–24 months out; constrained supply supports both.
Investment metrics
- 1% rule
- 1.20% ✓
- Cap rate
- 8.25%
- Cash-on-cash
- 6.98%
- DSCR
- 1.31
- GRM
- 6.9
CMA / ARV
- ARV (median comp)
- $153,116
- List price
- $83,000
- Delta
- -45.79%
- Verdict
- UNDERPRICED
- Comps
- 20 within 1.0 mi
Show comp detail 3 sales within ~0.75 mi
| Address | Dist | Beds/Ba | Sqft | Sold | Price | $/sf | Match |
|---|---|---|---|---|---|---|---|
| 706 El Monte Blvd | 0.06mi | 2/1.0 (+1) | 720 (+3%) | 13mo | $140,000 | $194 | 76 |
| 539 W Hermosa Dr | 0.47mi | 2/1.0 (+1) | 720 (+3%) | 7mo | $154,375 | $214 | 62 |
| 914 W Mariposa Dr | 0.44mi | 2/1.0 (+1) | 753 (+8%) | 22mo | $140,000 | $186 | 42 |
Match score weights: distance 35% · size 25% · config 20% · recency 20%. Top-matched comps best support the ARV.
Projected returns pro-forma
-3.0% appreciation · 0.89% rent growth · sell at horizon
- IRR
- -8.2%
- Equity multiple
- 0.71×
- Total profit
- $-6,853
- Equity at exit
- $12,376
- IRR
- -2.0%
- Equity multiple
- 0.88×
- Total profit
- $-2,782
- Equity at exit
- $7,176
Cash invested: $23,240 (down + closing). Projections, not guarantees.
Landlord ↔ Tenant lean methodology
- Overall (STATE)
- 87 Strongly Landlord-Friendly
- State Texas
- 87 Strongly Landlord-Friendly · R+5
- County
- — inherits STATE
- City
- — inherits STATE
ZIP-level market 78212
- Home prices YoY
- -25.2%
- Rents YoY
- 0.9%
- Active inventory
- 175
- Price-to-rent
- 6.9×
Monthly cashflow live
- Estimated rent
- $997 high interval (Pro) →
- Mortgage (P&I)
- −$435
- Tax from tax record
- −$183 /mo · $2,194/yr
- Insurance
- −$35
- HOA
- −$0
- Vacancy / Maint / Mgmt
- −$209
- Net cashflow
- $135
Break-even live
UW: 25.0% down · 7.5% · 30yr · 1.5% tax · 5.0% vac · 8.0% maint · 8.0% mgmt
Financing live
Cash to close
- Down payment
- $20,750
- Closing costs
- $2,490
- Reserves months
- —
- Total cash needed
- —
Loan-product check · same deal, 3 products live
Conventional
25% down · 7.5% · 30yr
- Down + closing
- —
- Monthly P&I
- —
- Monthly cashflow
- —
- DSCR
- —
- Eligible?
- —
Personal DTI + credit; lowest rate.
DSCR
20% down · 8.5% · 30yr
- Down + closing
- —
- Monthly P&I
- —
- Monthly cashflow
- —
- DSCR
- —
- Eligible?
- —
No personal income docs; deal must DSCR.
Hard money
10% down · 12.0% · 12mo
- Down + closing
- —
- Monthly P&I
- —
- Monthly cashflow
- —
- DSCR
- —
- Eligible?
- —
Short-term bridge; refi at stabilization.
Rent comps 24 comps
| Address | Beds | Baths | Sqft | Rent | $/sqft | DOM | Units | Dist |
|---|---|---|---|---|---|---|---|---|
| 119 Venice San Antonio, TX | 2.0 | 1.0 | 732 | $1,350 | $1.84 | 2d | 1 | 0.21mi |
| 3518 Grant Ave Unit 223 San Antonio, TX | 1.0 | 1.0 | 545 | $630 | $1.16 | 12d | 1 | 0.35mi |
| 3518 Grant Ave Unit 321 San Antonio, TX | 1.0 | 1.0 | 545 | $630 | $1.16 | 43d | 1 | 0.35mi |
| 1221 W Thorain Blvd San Antonio, TX | 1.0 | 1.0 | 400 | $975 | $2.44 | 24d | 1 | 0.58mi |
| 6822 Basilwood Dr San Antonio, TX | 1.0 | 1.0 | 606 | $750 | $1.24 | 24d | 1 | 0.60mi |
| 1039 Edison Dr Unit 2 (backhouse) San Antonio, TX | 1.0 | 1.0 | 600 | $850 | $1.42 | 16d | 1 | 0.80mi |
| 1004 Allena Dr Apt 20 San Antonio, TX | 1.0 | 1.0 | 730 | $700 | $0.96 | 43d | 1 | 0.86mi |
| 215 Jackson Keller Rd Unit 216 San Antonio, TX | 1.0 | 1.0 | 635 | $990 | $1.56 | 43d | 1 | 0.89mi |
| 401 Dora St Unit 2 San Antonio, TX | 1.0 | 1.0 | 494 | $950 | $1.92 | 24d | 1 | 0.94mi |
| 1630 San Angelo San Antonio, TX | 2.0 | 1.0 | 656 | $1,250 | $1.91 | 43d | 1 | 0.97mi |
| 6641 San Pedro Ave San Antonio, TX | 1.0 | 1.0 | 500 | $799 | $1.60 | 21d | 1 | 1.04mi |
| 815 W Olmos Dr Unit 815 San Antonio, TX | 2.0 | 1.0 | 750 | $850 | $1.13 | 43d | 1 | 1.05mi |
| 810 W Olmos Dr San Antonio, TX | 2.0 | 1.0 | 750 | $1,049 | $1.40 | 24d | 1 | 1.08mi |
| 808 W Olmos Dr San Antonio, TX | 2.0 | 1.0 | 750 | $1,024 | $1.37 | 4d | 1 | 1.08mi |
| 1417 W Olmos Dr San Antonio, TX | 2.0 | 1.0 | 640 | $1,075 | $1.68 | 4d | 1 | 1.11mi |
| 222 Audrey Alene Dr Unit 2 San Antonio, TX | 1.0 | 2.0 | 415 | $1,100 | $2.65 | 43d | 1 | 1.18mi |
| 766 Edgebrook Ln Unit 768 San Antonio, TX | 1.0 | 1.0 | 700 | $725 | $1.04 | 43d | 1 | 1.28mi |
| 768 Edgebrook Ln San Antonio, TX | 1.0 | 1.0 | 700 | $725 | $1.04 | 43d | 1 | 1.28mi |
| 1738 Lee Hall St Unit B San Antonio, TX | 1.0 | 1.0 | 525 | $750 | $1.43 | 43d | 1 | 1.30mi |
| 1930 W Hermosa Dr San Antonio, TX | 1.0 | 1.0 | 700 | $800 | $1.14 | 24d | 1 | 1.39mi |
| 130 W Norwood Ct Unit 3 San Antonio, TX | 2.0 | 1.0 | 729 | $1,295 | $1.78 | 43d | 1 | 1.42mi |
| 130 Melrose Pl San Antonio, TX | 3.0 | 1.0–2.5 | 1230 | $1,220 | $0.99 | 3d | 22 | 1.42mi |
| 137 E Norwood Ct Unit 8 San Antonio, TX | 1.0 | 1.0 | 450 | $825 | $1.83 | 21d | 1 | 1.47mi |
| 137 E Norwood Ct Unit 8 San Antonio, TX | 1.0 | 1.0 | 450 | $825 | $1.83 | 24d | 1 | 1.47mi |
Listing history 16 events
-
2026-06-18days on market $83,000 Active 407 DOM
-
2026-06-17days on market $83,000 Active 406 DOM
-
2026-06-16days on market $83,000 Active 405 DOM
-
2026-06-15days on market $83,000 Active 404 DOM
-
2026-06-13days on market $83,000 Active 402 DOM
-
2026-06-09days on market $83,000 Active 398 DOM
-
2026-06-08days on market $83,000 Active 397 DOM
-
2026-06-07days on market $83,000 Active 396 DOM
-
2026-06-04days on market $83,000 Active 393 DOM
-
2026-06-03days on market $83,000 Active 392 DOM
-
2026-06-02days on market $83,000 Active 391 DOM
-
2026-06-01days on market $83,000 Active 390 DOM
-
2026-05-31days on market $83,000 Active 389 DOM
-
2026-04-15price $83,000 510-char remark
Show marketing remark (510 chars)
Prime Lot in the Alamo Quarry Market Area!Discover a fantastic investment opportunity in one of San Antonio's most up-and-coming neighborhoods. This property is a generous lot with mature trees and easy access to major highways, dining, and shopping.The existing one-bedroom home is in need of significant repairs and is currently under demolition compliance - presenting the perfect chance for a new build tailored to your vision.Buyer to verify all building requirements and compliance details with the city.
-
2025-05-28price $99,500 510-char remark
Show marketing remark (510 chars)
Prime Lot in the Alamo Quarry Market Area!Discover a fantastic investment opportunity in one of San Antonio's most up-and-coming neighborhoods. This property is a generous lot with mature trees and easy access to major highways, dining, and shopping.The existing one-bedroom home is in need of significant repairs and is currently under demolition compliance - presenting the perfect chance for a new build tailored to your vision.Buyer to verify all building requirements and compliance details with the city.
-
2025-05-07$109,000 New 510-char remark
Show marketing remark (510 chars)
Prime Lot in the Alamo Quarry Market Area!Discover a fantastic investment opportunity in one of San Antonio's most up-and-coming neighborhoods. This property is a generous lot with mature trees and easy access to major highways, dining, and shopping.The existing one-bedroom home is in need of significant repairs and is currently under demolition compliance - presenting the perfect chance for a new build tailored to your vision.Buyer to verify all building requirements and compliance details with the city.
ⓘ Source: listings_history table (triggers on properties + properties_extension) + one-shot
backfill from property_details.listing_events for pre-trigger history.
Tax reassessment forecast TX · Resets to sale price
- Current annual tax
- $2,194 · $183/mo
- Projected year-2 tax
- $2,194 · $183/mo
- Expected delta
- $0/yr ($0/mo · 0.0%)
ⓘ Screening estimate from a state-policy table — verify with the county assessor before closing.
Climate risk First Street
- Flood 1/10 Low FEMA zone X (unshaded) · 0% chance over 30 yrs
- Wildfire 1/10 Low
- Heat 8/10 Severe 7 d/yr ≥108°F today · 22 d/yr by 30 yrs out
- Wind 8/10 Severe 80% chance of damaging wind over 30 yrs
- Air quality 2/10 Low 1 unhealthy d/yr today · 1 by 30 yrs out
Nearby sold comps map
Loading sold comps map…
Walkable amenities ~0.75 mi
Loading nearby amenities…
Taxation est. · year 1
- Rental income
- $11,967
- − Mortgage interest
- −$4,649
- − Property taxes
- −$2,194
- − Insurance
- −$415
- − Repairs & maintenance
- −$957
- − Management
- −$957
- − Depreciation
- −$2,415
- Taxable income
- $379
- Est. tax owed @ 24.0%
- −$91
- After-tax cash flow
- $1,531/yr
For passive investors: Depreciation is non-cash, so a rental often shows a tax loss while cash-flowing — sheltering income. Rental losses are passive: they offset passive income freely, and up to $25,000/yr can offset ordinary (W-2) income if you actively participate and your MAGI is under $100k (phasing out to $0 by $150k); unused losses carry forward. On sale, claimed depreciation is recaptured at up to 25%, and gains may owe capital-gains tax (a 1031 exchange can defer both). Figures are a year-1 estimate at your 24.0% rate — not tax advice; consult a CPA.
Schools (NCES district)
- District
- San Antonio ISD
- NCES district ID
- 4838730
- Math proficiency
- 12% ▼ -21.00%
- Reading proficiency
- 22% ▼ -7.00%
- Median HH income
- $30,952
- Composite
- 13.57/100
- National rank
- #9512
- State rank
- #805 of 826 in TX
Livability — San Antonio
- Score
- 80/100
- State rank
- #31
- US rank
- #1616
Category grades
Schools grade is shown separately in the Schools card above.
Census & demographics
- Census place
- San Antonio, TX
- County
- Bexar County · 1,990,555 people
- City population
- 1,806,925
- Metro
- San Antonio-New Braunfels, TX
- Population (ZIP)
- 27,437
- Household income
- $62,801
- Rent vs Own
- Severe rent burden
- 1505.0
Population outlook (Bexar County) Hauer SSP2
- Today (2025)
- 2,336,851 people
- By 2030
- 2,560,728 · +9.6%
- By 2040
- 3,020,569 · +29.3%
- By 2050
- 3,493,522 · +49.5%
- By 2075
- 4,668,459 · +99.8%
- By 2100
- 5,533,242 · +136.8%
Race, ethnicity, and origin ACS 2023
- Neighborhood character
- Diverse neighborhood (Simpson 0.55)
- Race & ethnicity
- Hispanic / Latino 58% White 34% Two or more races 34% Black 3% Asian 2%
- Hispanic origin (detail)
- Mexican 50%
- Common ancestry
- Slovak 2% Lithuanian 2% Romanian 1%
- Foreign-born
- 13% · Canada, China
- Languages at home
- 62% English-only · Spanish 36% Chinese 1%
Political lean MEDSL · Bexar
- 2024 margin
- Lean D (+9.8) · D 54.3% · R 44.6% · Other 1.1%
- 2008→2024 swing
- +4.2pp toward D · 2008: 5.6pp · 2024: 9.8pp
- All cycles
- 2024: D+9.8 2020: D+18.2 2016: D+13.5 2012: D+4.6 2008: D+5.6
Not yet ingested
- Civics
- —
Market trends
- HPI YoY
- ▼ -94.24%
- Current HPI
- 280.1006
- Rent YoY
- ▲ 0.89%
- Metro
- San Antonio-New Braunfels, TX
- State GDP YoY
- ▲ 3.95%
- F500 in state
- 110
Industry mix (Fortune 500 HQ in TX)
| Industry | F500 HQs | Revenue |
|---|---|---|
| Energy | 16 | $1,198B |
|
||
| Technology | 5 | $198B |
|
||
| Engineering / Construction | 4 | $72B |
|
||
| Energy Services | 3 | $60B |
|
||
| Utilities | 3 | $41B |
|
||
| Healthcare | 2 | $330B |
|
||
Price history
-23.9% since first listed3 events — show timeline
- 2026-04-15 Price Changed $83,000 LERA
- 2025-05-28 Price Changed $99,500 LERA
- 2025-05-07 Listed $109,000 LERA
Property tax history
+4.8%/yrLatest (2025): $2,194 · +0.0% YoY. Source: county tax records.
Cash-flow waterfall
monthlySold comps — $/sqft
last 12 mo · ≤1 miLoading sold comps…