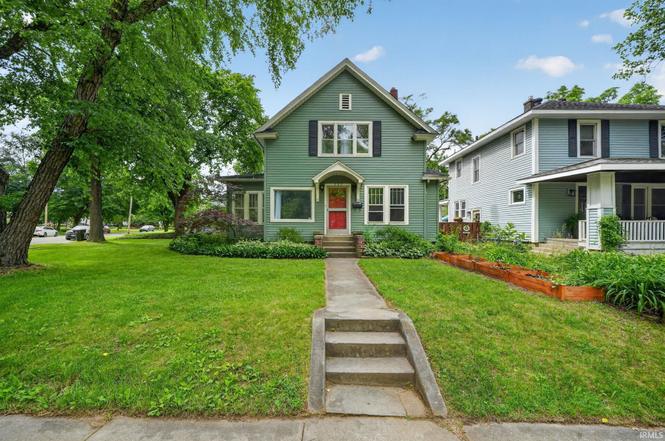
302 Ostemo Pl · South Bend, IN
Flood risk 9/10 · Severe
- FEMA flood zone
- X (unshaded)
- Chance of flooding over 30 yrs
- 0.99%
- Est. flood insurance / yr
- $473 – $860
Fire risk 1/10 · Minimal
- Est. fire insurance / yr
- $717 – $1,331
Heat risk 2/10 · Minimal
- Hot days now (above 99°F)
- 7 days/yr
- Hot days in 30 yrs
- 16 days/yr
Wind risk 2/10 · Minimal
- Chance of severe wind over 30 yrs
- —
Air-quality risk 3/10 · Minor
- Unhealthy air days now
- 3 days/yr
- Unhealthy air days in 30 yrs
- 3 days/yr
Risk factors via First Street. Map © Google.
Why this score? — see what drove the F grade
The composite is a weighted blend of 9 inputs, each scored 0–100. Each bar is that input's sub-score; the figure is the points it added to the 100-point composite (weight × sub-score).
- Cash flow +5.3/30.0
- Rent growth +3.3/5.0
- Livability +3.2/5.0
- ARV discount +2.8/15.0
- Condition / age +2.5/5.0
- Schools +1.4/10.0
- 1% rule +0.2/10.0
- DSCR +0.0/10.0
- Appreciation +0.0/10.0
$299,000
🖨 Deal sheet 📄 Offer letter ✓ Due diligence
Listing remarks
Located in the highly desirable Northshore Triangle neighborhood, this home is just minutes from Notre Dame, Memorial Hospital, and downtown South Bend. This classic home features the timeless charm and character for which the area is celebrated. The interior boasts unique architectural details, including curved entryways, custom plantation blinds, and beautiful hardwood flooring. While the property is being sold as-is and requires some updating, it offers a perfect canvas to make it your own. A notable feature of this home is the converted garage, which now serves as a versatile living space with its own half bathroom and separate entrance—ideal for a home office, guest suite, or stu
Key facts
- Converted garage
- Lower-level bar
- Side portico
Tags
Property features AI
Exterior
- Parking: Off-street parking
- Utilities: Public water; Public sewer
- Home design: Single-family residence (site-built); 2 stories
- Construction: Wood siding; Block foundation; Shingle roof; Built as site-built home
- Exterior features: Enclosed porch; Patio; Corner lot
Interior
- Kitchen: Dishwasher; Electric range; Refrigerator
- Bedrooms: Total of 9 rooms (bedroom count not specified)
- Flooring: Hardwood flooring
- Bathrooms: 2 full bathrooms; 1 half bathroom; 1 main-level bathroom
- Heating & cooling: Forced air heating; Central air conditioning
- Interior features: Wet bar; Partial, partially finished basement
- Laundry & utility: Washer; Laundry area on the lower level
Neighborhood map
What this means for you Summary
Snapshot
- This is a 3-bed/2.5-bath single-family listed at $299k.
Deal economics
- At list price, monthly cash flow is $-715 ($-9k/yr) — negative.
- To cash-flow at today's rent, offer at most $173k (42.3% below list).
- To meet the 1% rule (rent ≥ 1% of price), the offer needs to be $157k (47.6% below list).
- Recommended offer: $157k (47.6% below list) — sets the bar for 1% rule.
Location & tenants
- Location reads 64/100 on livability (#365 in IN) — a middle-class / working-renter tenant base. Strengths: cost of living A+, housing A+, health & safety A+; Watch: amenities D, employment D, crime F.
- South Bend Community School Corporation (urban): math 12% / reading 21% proficiency, ranked #284 of 301 in IN (top 94%) — low school quality limits family demand, transient renter base, plan for 1-2y turnover; 66% free/reduced lunch — lower-income household profile, screen leases tightly.
- Zoned schools: Muessel Elementary School (math 2% / reading 2%, grade F, #989 of 994 statewide, top 100%, 241 students, 88% FRL); Jefferson Traditional School (math 12% / reading 22%, grade F, #284 of 330 statewide, top 87%, 516 students, 64% FRL); Adams High School (math 28% / reading 57%, grade F, #195 of 369 statewide, top 53%, 1,976 students, 56% FRL) — zoned schools at 69% FRL track the district average.
- Market conditions: Rents rising (+3.3%/yr); 140 active listings in the ZIP; 30 comparable units currently listed for rent nearby; rentals leasing fast (median 14d on market — plan ~1-2 weeks tenant-placement turnaround); 754 units permitted in St. Joseph County in 2024 (460 in 5+ unit buildings).
Forward outlook
- Local home prices are declining (-3.0%/yr); year-one equity from $2k of loan paydown is wiped out by about $9k of value loss. Plan a longer hold.
Negotiation context
- Only 1 days on market — expect competitive offers; lowballing is unlikely to land.
Risks & watch-outs
- Watch-outs: flood insurance adds $56/mo; built in 1923 — expect roof / HVAC / electrical / plumbing capex.
- Climate carrying-cost: severe flood risk — expect insurance premiums to compound above CPI over the hold.
Questions for the listing agent
- What do current leases actually rent for vs. the listed asking? Can we see a recent rent roll and the last 12 months of T-12 income?
- Built in 1923 — when were the roof, HVAC, electrical panel, plumbing, and water heater last replaced?
- What's the actual annual flood-insurance premium (NFIP or private), and is the property in a SFHA with mandatory coverage?
- Is there a deadline driving the sale (1031 exchange, divorce, estate, relocation)? That informs how much negotiation room exists.
- Schools are F-rated, which usually means shorter tenancies and higher turnover. Who's the typical renter profile here, and what's been the actual vacancy rate?
- Crime grade is F in this area — have there been break-ins, vandalism, or insurance claims at this property in the last 3 years? What carrier currently insures it and at what premium?
- The area grade is low — what's the realistic commute time and amenity access for the typical tenant pool here? Any planned neighborhood developments (good or bad) we should know about?
- What's the average days-on-market for RENTAL listings here right now (not sales)? A rising rental-DOM trend means longer vacancies and softer asking-rent achievability than the comps imply.
- What's the recent tenant-quality profile in this submarket — average credit score on applications, eviction rate, late-payment / NSF rate, and stable-employment percentage? A property-management company in the area should have these aggregated.
- How much new for-sale + rental construction is in the pipeline within 1–3 miles? Heavy new supply typically softens prices + rents 12–24 months out; constrained supply supports both.
Investment metrics
- 1% rule
- 0.52% ✗
- Cap rate
- 3.65%
- Cash-on-cash
- -9.46%
- DSCR
- 0.58
- GRM
- 15.9
CMA / ARV
- ARV (on-the-fly)
- $270,912
- Comps found
- 12
Show comp detail 12 sales within ~0.75 mi
| Address | Dist | Beds/Ba | Sqft | Sold | Price | $/sf | Match |
|---|---|---|---|---|---|---|---|
| 501 W Angela Blvd | 0.18mi | 3/1.5 | 1,692 (+4%) | 2mo | $151,000 | $89 | 80 |
| 525 W Angela Blvd | 0.22mi | 3/1.0 | 1,578 (-3%) | 2mo | $250,000 | $158 | 77 |
| 506 W Angela Blvd | 0.17mi | 3/1.5 | 1,728 (+6%) | 3mo | $264,195 | $153 | 76 |
| 210 Wakewa Ave | 0.20mi | 3/1.0 | 1,530 (-6%) | 2mo | $300,000 | $196 | 73 |
| 228 Tonti St | 0.14mi | 4/2.0 (+1) | 1,500 (-8%) | 3mo | $280,000 | $187 | 71 |
| 1060 Woodward Ave | 0.46mi | 4/2.0 (+1) | 1,640 (+0%) | 0mo | $272,000 | $166 | 70 |
| 1219 Leeper Ave | 0.22mi | 3/1.5 | 1,847 (+13%) | 0mo | $385,000 | $208 | 64 |
| 706 California St | 0.44mi | 3/2.5 | 1,392 (-15%) | 1mo | $230,000 | $165 | 54 |
| 1017 N Hill St | 0.65mi | 3/2.0 | 1,464 (-10%) | 2mo | $660,000 | $451 | 49 |
| 601 Howard St | 0.69mi | 4/2.5 (+1) | 1,848 (+13%) | 0mo | $630,000 | $341 | 41 |
| 1202 Cleveland Ave | 0.73mi | 2/1.0 (-1) | 1,800 (+10%) | 1mo | $136,000 | $76 | 37 |
| 1238 Diamond Ave | 0.71mi | 3/1.0 | 1,402 (-14%) | 2mo | $101,000 | $72 | 35 |
Match score weights: distance 35% · size 25% · config 20% · recency 20%. Top-matched comps best support the ARV.
Projected returns pro-forma
-3.0% appreciation · 3.3% rent growth · sell at horizon
- IRR
- -34.5%
- Equity multiple
- -0.12×
- Total profit
- $-93,575
- Equity at exit
- $44,582
- IRR
- -42.9%
- Equity multiple
- -0.65×
- Total profit
- $-138,371
- Equity at exit
- $25,852
Cash invested: $83,720 (down + closing). Projections, not guarantees.
Landlord ↔ Tenant lean methodology
- Overall (STATE)
- 90 Strongly Landlord-Friendly
- State Indiana
- 90 Strongly Landlord-Friendly · R+11
- County
- — inherits STATE
- City
- — inherits STATE
ZIP-level market 46617
- Rents YoY
- 3.3%
- Active inventory
- 140
- Price-to-rent
- 15.9×
Monthly cashflow live
- Estimated rent
- $1,566 high interval (Pro) →
- Mortgage (P&I)
- −$1,568
- Tax from tax record
- −$204 /mo · $2,451/yr
- Insurance
- −$125
- Flood insurance flood zone
- −$56 /mo · $666/yr
- HOA
- −$0
- Vacancy / Maint / Mgmt
- −$329
- Net cashflow
- $-715
Break-even live
UW: 25.0% down · 7.5% · 30yr · 1.5% tax · 5.0% vac · 8.0% maint · 8.0% mgmt
Financing live
Cash to close
- Down payment
- $74,750
- Closing costs
- $8,970
- Reserves months
- —
- Total cash needed
- —
Loan-product check · same deal, 3 products live
Conventional
25% down · 7.5% · 30yr
- Down + closing
- —
- Monthly P&I
- —
- Monthly cashflow
- —
- DSCR
- —
- Eligible?
- —
Personal DTI + credit; lowest rate.
DSCR
20% down · 8.5% · 30yr
- Down + closing
- —
- Monthly P&I
- —
- Monthly cashflow
- —
- DSCR
- —
- Eligible?
- —
No personal income docs; deal must DSCR.
Hard money
10% down · 12.0% · 12mo
- Down + closing
- —
- Monthly P&I
- —
- Monthly cashflow
- —
- DSCR
- —
- Eligible?
- —
Short-term bridge; refi at stabilization.
Rent comps 30 comps
| Address | Beds | Baths | Sqft | Rent | $/sqft | DOM | Units | Dist |
|---|---|---|---|---|---|---|---|---|
| 122 E Pokagon St South Bend, IN | 2.0 | 1.0 | 1200 | $1,500 | $1.25 | 13d | 1 | 0.27mi |
| 1032 Allen St South Bend, IN | 3.0 | 2.0 | 1580 | $1,200 | $0.76 | 43d | 1 | 0.68mi |
| 1243 Portage Ave South Bend, IN | 3.0 | 1.0 | 1570 | $1,500 | $0.96 | 43d | 1 | 0.68mi |
| 910 Allen St South Bend, IN | 3.0 | 1.0 | 1100 | $1,350 | $1.23 | 21d | 1 | 0.73mi |
| 504 W Navarre St South Bend, IN | 3.0 | 1.5 | 1520 | $1,350 | $0.89 | 13d | 1 | 0.74mi |
| 1214 Queen St South Bend, IN | 3.0 | 1.0 | 1056 | $1,300 | $1.23 | 13d | 1 | 0.76mi |
| 1118 Van Buren St South Bend, IN | 3.0 | 1.0 | 1394 | $1,375 | $0.99 | 21d | 1 | 0.83mi |
| 1145 N Eddy St South Bend, IN | 3.0 | 1.0–3.0 | 959 | $4,377 | $4.56 | 43d | 1 | 0.95mi |
| 752 Diamond Ave South Bend, IN | 3.0 | 1.5 | 1248 | $1,400 | $1.12 | 43d | 1 | 0.95mi |
| 307 E Lasalle Ave South Bend, IN | 1.0–2.0 | 1.0–2.0 | 925 | $1,670 | $1.80 | 13d | 22 | 1.00mi |
| 300 E Lasalle Ave South Bend, IN | 3.0 | 1.0–3.0 | 1013 | $3,009 | $2.97 | 13d | 31 | 1.03mi |
| 736 Lawndale Ave Unit 1 South Bend, IN | 3.0 | 1.0 | 1072 | $1,200 | $1.12 | 13d | 1 | 1.03mi |
| 1018 S Bend Ave South Bend, IN | 2.0 | 1.0–2.0 | 836 | $2,950 | $3.53 | 13d | 27 | 1.09mi |
| 1505 N Adams St South Bend, IN | 3.0 | 1.0 | 1200 | $1,350 | $1.12 | 13d | 1 | 1.13mi |
| 211 W Washington St South Bend, IN | 3.0 | 1.0–2.5 | 1162 | $7,491 | $6.44 | 21d | 19 | 1.13mi |
| 1210 Johnson St South Bend, IN | 3.0 | 2.0 | 1568 | $1,250 | $0.80 | 21d | 1 | 1.28mi |
| 1206 Johnson St South Bend, IN | 3.0 | 1.5 | 1320 | $1,400 | $1.06 | 43d | 1 | 1.28mi |
| 1642 Johnson St South Bend, IN | 3.0 | 1.0 | 1375 | $1,400 | $1.02 | 13d | 1 | 1.31mi |
| 129 Clancey St South Bend, IN | 3.0 | 3.5 | 2000 | $2,950 | $1.48 | 13d | 1 | 1.32mi |
| 221 S Taylor St South Bend, IN | 3.0 | 2.0 | 1178 | $2,599 | $2.21 | 13d | 1 | 1.32mi |
| 1630 Obrien St South Bend, IN | 3.0 | 1.0 | 1120 | $1,400 | $1.25 | 13d | 1 | 1.36mi |
| 116 N Notre Dame Ave South Bend, IN | 3.0 | 1.5 | 1524 | $1,295 | $0.85 | 13d | 1 | 1.37mi |
| 2010 Lincoln Way W Unit 2 South Bend, IN | 3.0 | 1.0 | 1150 | $1,325 | $1.15 | 21d | 1 | 1.38mi |
| 1008 O Brien St Unit O South Bend, IN | 3.0 | 1.0 | 1634 | $800 | $0.49 | 21d | 1 | 1.38mi |
| 2217 Inglewood Pl South Bend, IN | 3.0 | 1.0 | 1800 | $2,200 | $1.22 | 43d | 1 | 1.40mi |
| 913 E Washington St South Bend, IN | 4.0 | 1.5 | 1312 | $1,295 | $0.99 | 21d | 1 | 1.40mi |
| 1054 Huey St South Bend, IN | 4.0 | 2.0 | 1288 | $1,550 | $1.20 | 13d | 1 | 1.42mi |
| 1918 Johnson St South Bend, IN | 3.0 | 1.0 | 1200 | $1,200 | $1.00 | 13d | 1 | 1.43mi |
| 2205 Lincoln Way W South Bend, IN | 4.0 | 2.0 | 1440 | $1,565 | $1.09 | 13d | 1 | 1.47mi |
| 1046 N Elmer St South Bend, IN | 2.0 | 1.0 | 1050 | $1,025 | $0.98 | 21d | 1 | 1.49mi |
Listing history 2 events
-
2026-06-18remarks 693-char remark
-
2026-06-18$299,000 Active 1 DOM
ⓘ Source: listings_history table (triggers on properties + properties_extension) + one-shot
backfill from property_details.listing_events for pre-trigger history.
Tax reassessment forecast IN · Partial reset (capped growth)
- Current annual tax
- $2,451 · $204/mo
- Projected year-2 tax
- $2,496 · $208/mo
- Expected delta
- +$45/yr (+$4/mo · 1.8%)
ⓘ Screening estimate from a state-policy table — verify with the county assessor before closing.
Climate risk First Street
- Flood 9/10 Extreme FEMA zone X (unshaded) · 99% chance over 30 yrs
- Wildfire 1/10 Low
- Heat 2/10 Low 7 d/yr ≥99°F today · 16 d/yr by 30 yrs out
- Wind 2/10 Low
- Air quality 3/10 Moderate 3 unhealthy d/yr today · 3 by 30 yrs out
Nearby sold comps map
Loading sold comps map…
Walkable amenities ~0.75 mi
Loading nearby amenities…
Taxation est. · year 1
- Rental income
- $18,792
- − Mortgage interest
- −$16,749
- − Property taxes
- −$2,451
- − Insurance
- −$2,162
- − Repairs & maintenance
- −$1,503
- − Management
- −$1,503
- − Depreciation
- −$8,698
- Taxable loss
- −$14,274
- Est. tax savings @ 24.0%
- +$3,426
- After-tax cash flow
- $-5,157/yr
For passive investors: Depreciation is non-cash, so a rental often shows a tax loss while cash-flowing — sheltering income. Rental losses are passive: they offset passive income freely, and up to $25,000/yr can offset ordinary (W-2) income if you actively participate and your MAGI is under $100k (phasing out to $0 by $150k); unused losses carry forward. On sale, claimed depreciation is recaptured at up to 25%, and gains may owe capital-gains tax (a 1031 exchange can defer both). Figures are a year-1 estimate at your 24.0% rate — not tax advice; consult a CPA.
Schools (NCES district)
- District
- South Bend Community School Corporation
- NCES district ID
- 1810290
- Math proficiency
- 12% ▼ -10.00%
- Reading proficiency
- 21% ▼ -6.00%
- Median HH income
- $41,935
- Composite
- 14.21/100
- National rank
- #9452
- State rank
- #284 of 301 in IN
Livability — South Bend
- Score
- 64/100
- State rank
- #365
- US rank
- #13730
Category grades
Schools grade is shown separately in the Schools card above.
Census & demographics
- Census place
- South Bend, IN
- County
- Saint Joseph County · 189,048 people
- City population
- 99,767
- Metro
- South Bend-Mishawaka, IN-MI
- Population (ZIP)
- 10,032
- Household income
- $74,186
- Rent vs Own
- Severe rent burden
- 422.0
Population outlook (St. Joseph County) Hauer SSP2
- Today (2025)
- 273,186 people
- By 2030
- 273,594 · +0.1%
- By 2040
- 271,641 · -0.6%
- By 2050
- 269,187 · -1.5%
- By 2075
- 263,136 · -3.7%
- By 2100
- 245,659 · -10.1%
Race, ethnicity, and origin ACS 2023
- Neighborhood character
- Predominantly White (68%)
- Race & ethnicity
- White 68% Black 14% Hispanic / Latino 8% Two or more races 8% Asian 3%
- Hispanic origin (detail)
- Mexican 4%
- Common ancestry
- Romanian 8% Italian 3% Lithuanian 2%
- Foreign-born
- 10% · Canada, China, Dominican Republic
- Languages at home
- 88% English-only · Spanish 6% Chinese 1% Other Indo-European 1%
Political lean MEDSL · St. Joseph
- 2024 margin
- Toss-up / Even · D 50.0% · R 48.5% · Other 1.5%
- 2008→2024 swing
- -15.6pp toward R · 2008: 17.1pp · 2024: 1.5pp
- All cycles
- 2024: D+1.5 2020: D+5.8 2016: D+0.2 2012: D+3.5 2008: D+17.1
Not yet ingested
- Civics
- —
Market trends
- HPI YoY
- ▼ -163.04%
- Current HPI
- 260.7904
- Rent YoY
- ▲ 3.30%
- Metro
- South Bend-Mishawaka, IN-MI
- State GDP YoY
- ▲ 2.90%
- F500 in state
- 18
Industry mix (Fortune 500 HQ in IN)
| Industry | F500 HQs | Revenue |
|---|---|---|
| Industrial Machinery | 2 | $37B |
|
||
| Healthcare | 1 | $177B |
|
||
| Pharmaceuticals | 1 | $45B |
|
||
| Metals / Steel | 1 | $18B |
|
||
| Agriculture | 1 | $17B |
|
||
| Packaging | 1 | $12B |
|
||
Price history
1 event — show timeline
- 2026-06-17 Listed $299,000 IRMLS
Property tax history
-6.9%/yrLatest (2025): $2,451 · -32.0% YoY. Source: county tax records.
Cash-flow waterfall
monthlySold comps — $/sqft
last 12 mo · ≤1 miLoading sold comps…