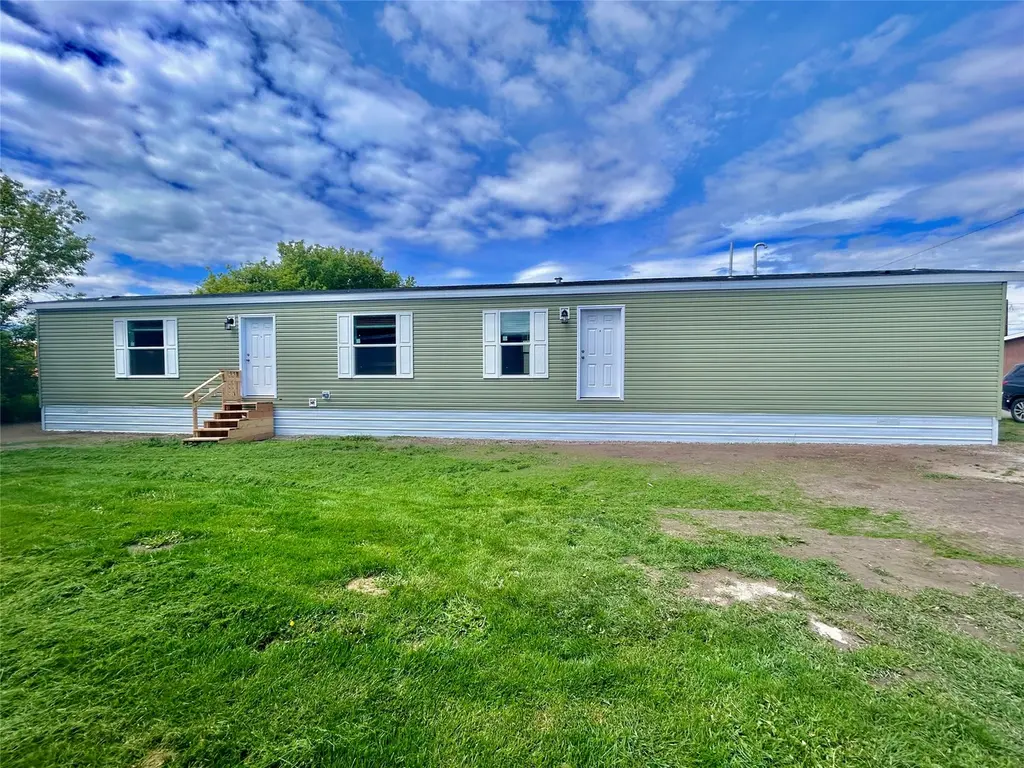
1340 Willow Glen Dr #20 · Kalispell, MT
Flood risk 1/10 · Minimal
- FEMA flood zone
- X (unshaded)
- Chance of flooding over 30 yrs
- 0.0%
- Est. flood insurance / yr
- $507 – $1,088
Fire risk 5/10 · Moderate
- Est. fire insurance / yr
- $918 – $1,706
Heat risk 3/10 · Minor
- Hot days now (above 90°F)
- 7 days/yr
- Hot days in 30 yrs
- 16 days/yr
Wind risk 1/10 · Minimal
- Chance of severe wind over 30 yrs
- —
Air-quality risk 8/10 · Major
- Unhealthy air days now
- 14 days/yr
- Unhealthy air days in 30 yrs
- 17 days/yr
Risk factors via First Street. Map © Google.
Why this score? — see what drove the B- grade
The composite is a weighted blend of 9 inputs, each scored 0–100. Each bar is that input's sub-score; the figure is the points it added to the 100-point composite (weight × sub-score).
- Cash flow +28.1/30.0
- DSCR +10.0/10.0
- 1% rule +7.7/10.0
- ARV discount +5.7/15.0
- Condition / age +4.0/5.0
- Livability +3.6/5.0
- Schools +3.5/10.0
- Rent growth +3.1/5.0
- Appreciation +0.0/10.0
$174,900
🖨 Deal sheet 📄 Offer letter ✓ Due diligence
Key facts
- Whirlpool appliances
- Walk-in closet
- Open concept design
Tags
Property features AI
Finance
- Financial info: Land is leased
Exterior
- Parking: Additional parking available
- Utilities: Natural gas available and connected; Electricity connected; Cable available; Public sewer
- Home design: Manufactured home (double wide); Residential property; R-1 zoning
- Construction: Vinyl siding; Block foundation; Asphalt roof
- Exterior features: Patio/porch; No fencing; Has a view; City street frontage; Publicly maintained asphalt road
Interior
- Kitchen: Dishwasher; Microwave; Range; Refrigerator
- Bathrooms: 2 full bathrooms
- Heating & cooling: Natural gas heating; Forced air
- Interior features: Open floorplan; High-speed internet
- Laundry & utility: Washer hookup
Neighborhood map
What this means for you Summary
Snapshot
- This is a 3-bed/2.0-bath manufactured listed at $175k. Condition is rated good.
Deal economics
- At list price, monthly cash flow is $549 ($7k/yr) — positive.
- The deal already cash-flows at list — no discount required.
- Meets the 1% rule at list price ($2k rent vs $175k).
- Recommended offer: $172k (1.5% below list) — sets the bar for market timing.
- Cap rate 10.1% vs local median 2.1% in Kalispell — top-decile yield for the area; either an underpriced asset or a hidden risk that comps aren't pricing in. Stress-test before assuming the spread holds.
Location & tenants
- Location reads 72/100 on livability (#61 in MT) — a middle-class / working-renter tenant base. Strengths: health & safety A+, cost of living A, housing A-; Watch: crime C-, commute F, employment D-.
- Flathead H S (town): math 29% / reading 52% proficiency, ranked #55 of 116 in MT (top 47%) — families likely to look elsewhere, expect single-tenant / working-renter base with shorter leases.
- Market conditions: Rents rising (+2.4%/yr); 683 active listings in the ZIP; 281 units permitted in Flathead County in 2024 (80 in 5+ unit buildings).
- This rent runs 37% of the median local income ($73k/yr) — at the standard rent-burdened threshold; future hikes will face affordability resistance.
Forward outlook
- Local home prices are declining (-3.0%/yr); year-one equity from $1k of loan paydown is wiped out by about $5k of value loss. Plan a longer hold.
- Flathead County population projected at +20% by 2050 — long-run rental-demand tailwind backs the buy-and-hold thesis.
- At projected returns (-3.0% appreciation + 2.4% rent growth), your $49k cash investment doubles in ~10 years — after that, you're playing with house money.
Negotiation context
- It's been on market 27 days — a 2% lower offer ($172k) is reasonable based on typical stale-listing flexibility.
Risks & watch-outs
- Climate carrying-cost: moderate wildfire risk — expect insurance premiums to compound above CPI over the hold.
Questions for the listing agent
- Is there a deadline driving the sale (1031 exchange, divorce, estate, relocation)? That informs how much negotiation room exists.
- Schools are B-rated — typically a magnet for longer-tenancy family renters. What's the average tenant stay here, and is there a school-zone premium baked into asking?
- What's the average days-on-market for RENTAL listings here right now (not sales)? A rising rental-DOM trend means longer vacancies and softer asking-rent achievability than the comps imply.
- What's the recent tenant-quality profile in this submarket — average credit score on applications, eviction rate, late-payment / NSF rate, and stable-employment percentage? A property-management company in the area should have these aggregated.
- How much new for-sale + rental construction is in the pipeline within 1–3 miles? Heavy new supply typically softens prices + rents 12–24 months out; constrained supply supports both.
Investment metrics
- 1% rule
- 1.27% ✓
- Cap rate
- 10.06%
- Cash-on-cash
- 13.44%
- DSCR
- 1.60
- GRM
- 6.6
CMA / ARV
- ARV (on-the-fly)
- $168,192
- Comps found
- 6
Show comp detail 6 sales within ~0.75 mi
| Address | Dist | Beds/Ba | Sqft | Sold | Price | $/sf | Match |
|---|---|---|---|---|---|---|---|
| 1340 Willow Glen Dr #31 | 0.00mi | 3/2.0 | 1,152 (0%) | 1mo | $158,000 | $137 | 99 |
| 1340 Willow Glen Dr #19 | 0.00mi | 3/2.0 | 1,152 (0%) | 5mo | $179,000 | $155 | 96 |
| 1340 Willow Glen Dr #26 | 0.00mi | 3/2.0 | 1,152 (0%) | 5mo | $168,000 | $146 | 96 |
| 50 Twin Acres Dr #11 | 0.16mi | 3/2.0 | 1,152 (0%) | 7mo | $159,000 | $138 | 87 |
| 1340 Willow Glen Dr #9 | 0.00mi | 3/2.0 | 1,216 (+6%) | 12mo | $110,000 | $90 | 80 |
| 50 Twin Acres Dr #7 | 0.18mi | 3/2.0 | 1,092 (-5%) | 6mo | $159,000 | $146 | 78 |
Match score weights: distance 35% · size 25% · config 20% · recency 20%. Top-matched comps best support the ARV.
Projected returns pro-forma
-3.0% appreciation · 2.41% rent growth · sell at horizon
- IRR
- 2.8%
- Equity multiple
- 1.11×
- Total profit
- $5,315
- Equity at exit
- $26,078
- IRR
- 11.8%
- Equity multiple
- 1.91×
- Total profit
- $44,427
- Equity at exit
- $15,122
Cash invested: $48,972 (down + closing). Projections, not guarantees.
Landlord ↔ Tenant lean methodology
- Overall (STATE)
- 82 Strongly Landlord-Friendly
- State Montana
- 82 Strongly Landlord-Friendly · R+11
- County
- — inherits STATE
- City
- — inherits STATE
ZIP-level market 59901
- Rents YoY
- 2.4%
- Active inventory
- 683
- Price-to-rent
- 6.6×
Monthly cashflow live
- Estimated rent
- $2,224 medium interval (Pro) →
- Mortgage (P&I)
- −$917
- Tax est. 1.5%
- −$219 /mo · $2,624/yr
- Insurance
- −$73
- HOA
- −$0
- Vacancy / Maint / Mgmt
- −$467
- Net cashflow
- $549
Break-even live
UW: 25.0% down · 7.5% · 30yr · 1.5% tax · 5.0% vac · 8.0% maint · 8.0% mgmt
Financing live
Cash to close
- Down payment
- $43,725
- Closing costs
- $5,247
- Reserves months
- —
- Total cash needed
- —
Loan-product check · same deal, 3 products live
Conventional
25% down · 7.5% · 30yr
- Down + closing
- —
- Monthly P&I
- —
- Monthly cashflow
- —
- DSCR
- —
- Eligible?
- —
Personal DTI + credit; lowest rate.
DSCR
20% down · 8.5% · 30yr
- Down + closing
- —
- Monthly P&I
- —
- Monthly cashflow
- —
- DSCR
- —
- Eligible?
- —
No personal income docs; deal must DSCR.
Hard money
10% down · 12.0% · 12mo
- Down + closing
- —
- Monthly P&I
- —
- Monthly cashflow
- —
- DSCR
- —
- Eligible?
- —
Short-term bridge; refi at stabilization.
Listing history 18 events
-
2026-06-19days on market $174,900 Active 27 DOM
-
2026-06-18days on market $174,900 Active 26 DOM
-
2026-06-17days on market $174,900 Active 25 DOM
-
2026-06-16days on market $174,900 Active 24 DOM
-
2026-06-15days on market $174,900 Active 23 DOM
-
2026-06-14days on market $174,900 Active 21 DOM
-
2026-06-13days on market $174,900 Active 20 DOM
-
2026-06-10days on market $174,900 Active 18 DOM
-
2026-06-09days on market $174,900 Active 17 DOM
-
2026-06-08days on market $174,900 Active 16 DOM
-
2026-06-07days on market $174,900 Active 15 DOM
-
2026-06-05days on market $174,900 Active 12 DOM
-
2026-06-03days on market $174,900 Active 11 DOM
-
2026-06-02days on market $174,900 Active 10 DOM
-
2026-06-01days on market $174,900 Active 9 DOM
-
2026-05-31days on market $174,900 Active 8 DOM
-
2026-05-30days on market $174,900 Active 7 DOM
-
2026-05-23$174,900 Active
ⓘ Source: listings_history table (triggers on properties + properties_extension) + one-shot
backfill from property_details.listing_events for pre-trigger history.
Climate risk First Street
- Flood 1/10 Low FEMA zone X (unshaded) · 0% chance over 30 yrs
- Wildfire 5/10 Major
- Heat 3/10 Moderate 7 d/yr ≥90°F today · 16 d/yr by 30 yrs out
- Wind 1/10 Low
- Air quality 8/10 Severe 14 unhealthy d/yr today · 17 by 30 yrs out
Nearby sold comps map
Loading sold comps map…
Walkable amenities ~0.75 mi
Loading nearby amenities…
Taxation est. · year 1
- Rental income
- $26,692
- − Mortgage interest
- −$9,797
- − Property taxes
- −$2,624
- − Insurance
- −$874
- − Repairs & maintenance
- −$2,135
- − Management
- −$2,135
- − Depreciation
- −$5,088
- Taxable income
- $4,038
- Est. tax owed @ 24.0%
- −$969
- After-tax cash flow
- $5,613/yr
For passive investors: Depreciation is non-cash, so a rental often shows a tax loss while cash-flowing — sheltering income. Rental losses are passive: they offset passive income freely, and up to $25,000/yr can offset ordinary (W-2) income if you actively participate and your MAGI is under $100k (phasing out to $0 by $150k); unused losses carry forward. On sale, claimed depreciation is recaptured at up to 25%, and gains may owe capital-gains tax (a 1031 exchange can defer both). Figures are a year-1 estimate at your 24.0% rate — not tax advice; consult a CPA.
Condition & rehab AI · 25 photos
This manufactured home is in good condition with modern updates, ready for a new owner. Consider painting the exterior and adding landscaping for a boost in value.
Value-add opportunities
- Both Painting the exterior — Enhances curb appeal and value
- Both Landscaping improvements — Enhances curb appeal and value
- Both Add a small front porch — Improves curb appeal and adds functionality
Renovation cost estimate screening
Value-add ROI direction
- Both Painting the exterior — Enhances curb appeal and value ↑
- Both Landscaping improvements — Enhances curb appeal and value ↑
- Both Add a small front porch — Improves curb appeal and adds functionality ↑
ⓘ Cost ranges are severity-bucket heuristics (US national rule-of-thumb). Get contractor quotes + a written scope before underwriting a rehab budget.
Schools (NCES district)
- District
- Flathead H S
- NCES district ID
- 3015420
- Math proficiency
- 29% ▼ -6.00%
- Reading proficiency
- 52% ▼ -3.00%
- Median HH income
- $49,712
- Composite
- 34.79/100
- National rank
- #5115
- State rank
- #55 of 116 in MT
Livability — Kalispell
- Score
- 72/100
- State rank
- #61
- US rank
- #6399
Category grades
Schools grade is shown separately in the Schools card above.
Census & demographics
- County
- Flathead County · 94,027 people
- City population
- 63,161
- Metro
- Kalispell, MT
- Population (ZIP)
- 63,161
- Household income
- $72,523
- Rent vs Own
- Severe rent burden
- 1577.0
Population outlook (Flathead County) Hauer SSP2
- Today (2025)
- 108,002 people
- By 2030
- 113,362 · +5.0%
- By 2040
- 122,245 · +13.2%
- By 2050
- 129,517 · +19.9%
- By 2075
- 146,737 · +35.9%
- By 2100
- 155,045 · +43.6%
Race, ethnicity, and origin ACS 2023
- Neighborhood character
- Predominantly White (89%)
- Race & ethnicity
- White 89% Two or more races 6% Hispanic / Latino 4% Native American 1% Asian 1%
- Common ancestry
- Portuguese 9% Slovak 3% Lithuanian 3%
- Foreign-born
- 3% · Canada, China
- Languages at home
- 96% English-only · Spanish 1% German/W. Germanic 0%
Political lean MEDSL · Flathead
- 2024 margin
- Solid R (+33.8) · D 31.8% · R 65.5% · Other 2.7%
- 2008→2024 swing
- -12.2pp toward R · 2008: -21.6pp · 2024: -33.8pp
- All cycles
- 2024: R+33.8 2020: R+29.9 2016: R+36.5 2012: R+33.4 2008: R+21.6
Not yet ingested
- Civics
- —
Market trends
- HPI YoY
- ▼ -698.78%
- Current HPI
- 225.6792
- Rent YoY
- ▲ 2.41%
- Metro
- Kalispell, MT
- State GDP YoY
- ▲ 3.41%
- F500 in state
- 2
Industry mix (Fortune 500 HQ in MT)
| Industry | F500 HQs | Revenue |
|---|---|---|
| Technology / Analytics | 1 | $2B |
|
||
Price history
1 event — show timeline
- 2026-05-23 Listed $174,900 MRMLS
Cash-flow waterfall
monthlySold comps — $/sqft
last 12 mo · ≤1 miLoading sold comps…