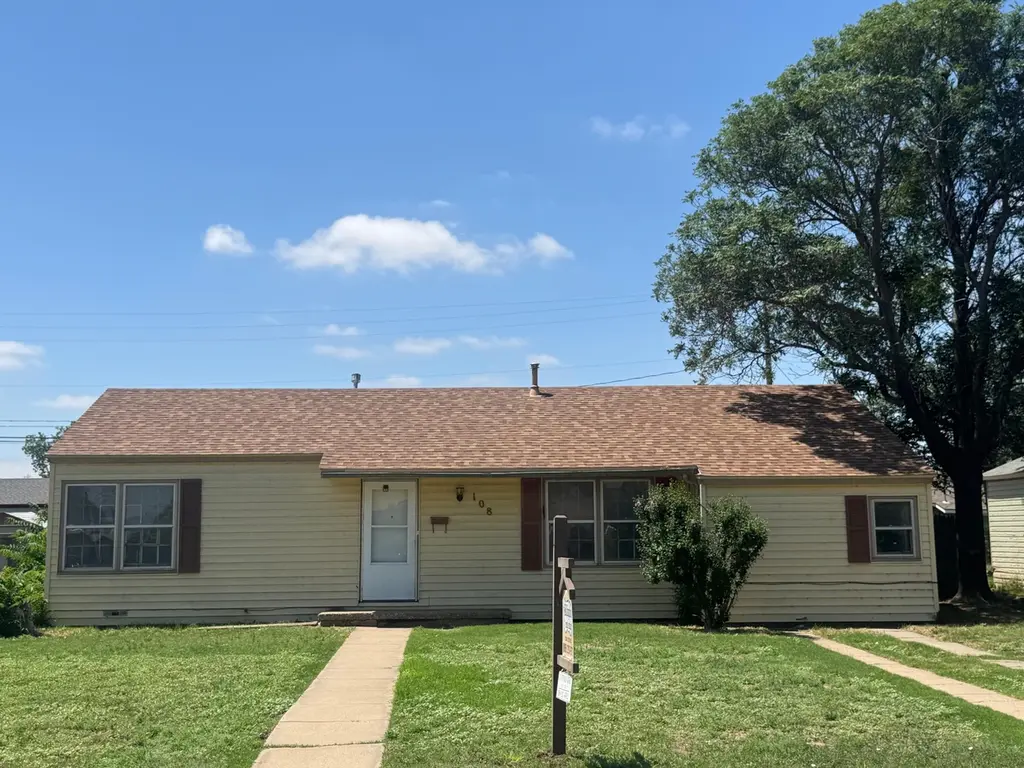
108 SE 9th St · Plainview, TX
Flood risk 1/10 · Minimal
- FEMA flood zone
- X (unshaded)
- Chance of flooding over 30 yrs
- 0.0%
- Est. flood insurance / yr
- $507 – $1,088
Fire risk 3/10 · Minor
- Est. fire insurance / yr
- $1,222 – $2,270
Heat risk 5/10 · Moderate
- Hot days now (above 99°F)
- 7 days/yr
- Hot days in 30 yrs
- 22 days/yr
Wind risk 2/10 · Minimal
- Chance of severe wind over 30 yrs
- —
Air-quality risk 2/10 · Minimal
- Unhealthy air days now
- 1 days/yr
- Unhealthy air days in 30 yrs
- 1 days/yr
Risk factors via First Street. Map © Google.
Why this score? — see what drove the B- grade
The composite is a weighted blend of 9 inputs, each scored 0–100. Each bar is that input's sub-score; the figure is the points it added to the 100-point composite (weight × sub-score).
- Cash flow +30.0/30.0
- 1% rule +10.0/10.0
- DSCR +10.0/10.0
- ARV discount +7.5/15.0
- Livability +3.5/5.0
- Schools +3.3/10.0
- Rent growth +2.5/5.0
- Condition / age +2.5/5.0
- Appreciation +0.0/10.0
$65,000
🖨 Deal sheet 📄 Offer letter ✓ Due diligence
Listing remarks
Great investment property! Three bedroom one bath, with a den and fireplace. This property is being as is.
Key facts
- 7,665 sq ft lot
Property features AI
Finance
- Financial info: Not specified
- HOA & community: Listed with Plainview Association of REALTORS®
Exterior
- Parking: Not specified
- Security: Not specified
- Utilities: Public water; Public sewer
- Home design: Single-family residence; One story
- Construction: Vinyl siding
- Exterior features: Lot approximately 73 x 105
Interior
- Kitchen: Gas water heater
- Bedrooms: Not specified
- Flooring: Not specified
- Bathrooms: 1 full bathroom
- Heating & cooling: Electric cooling; Ceiling fan(s)
- Interior features: Ceiling fan(s); Den (fireplace area)
- Laundry & utility: Not specified
Neighborhood map
What this means for you Summary
Snapshot
- This is a 3-bed/1.0-bath single-family listed at $65k.
Deal economics
- At list price, monthly cash flow is $443 ($5k/yr) — positive.
- The deal already cash-flows at list — no discount required.
- Meets the 1% rule at list price ($1k rent vs $65k).
Location & tenants
- Location reads 69/100 on livability (#393 in TX) — a middle-class / working-renter tenant base. Strengths: cost of living A+, housing A+; Watch: schools C-, crime C-, health & safety C-.
- Plainview ISD (town): math 41% / reading 37% proficiency, ranked #445 of 826 in TX (top 54%) — families likely to look elsewhere, expect single-tenant / working-renter base with shorter leases; 69% free/reduced lunch — lower-income household profile, screen leases tightly.
- Market conditions: 150 active listings in the ZIP; 13 units permitted in Hale County in 2024 (0 in 5+ unit buildings).
- This rent runs 31% of the median local income ($47k/yr) — at the standard rent-burdened threshold; future hikes will face affordability resistance.
Forward outlook
- Local home prices are declining (-3.0%/yr); year-one equity from $449 of loan paydown is wiped out by about $2k of value loss. Plan a longer hold.
- Hale County population projected at -27% by 2050 — secular population decline; favor cash flow + early exit over multi-decade hold.
- At projected returns (-3.0% appreciation + 3.0% rent growth), your $18k cash investment doubles in ~5 years — after that, you're playing with house money.
Negotiation context
- Only 1 days on market — expect competitive offers; lowballing is unlikely to land.
Risks & watch-outs
- Watch-outs: property tax is 3.0% of price.
- Climate carrying-cost: extreme-heat days projected 7→22/yr by 2055 (HVAC capex compounding) — expect insurance premiums to compound above CPI over the hold.
Questions for the listing agent
- Property tax is high relative to price — has the assessment been appealed recently, and will the sale trigger a re-assessment?
- Is there a deadline driving the sale (1031 exchange, divorce, estate, relocation)? That informs how much negotiation room exists.
- What's the average days-on-market for RENTAL listings here right now (not sales)? A rising rental-DOM trend means longer vacancies and softer asking-rent achievability than the comps imply.
- What's the recent tenant-quality profile in this submarket — average credit score on applications, eviction rate, late-payment / NSF rate, and stable-employment percentage? A property-management company in the area should have these aggregated.
- How much new for-sale + rental construction is in the pipeline within 1–3 miles? Heavy new supply typically softens prices + rents 12–24 months out; constrained supply supports both.
Investment metrics
- 1% rule
- 1.90% ✓
- Cap rate
- 14.46%
- Cash-on-cash
- 29.18%
- DSCR
- 2.30
- GRM
- 4.4
CMA / ARV
No comps found within radius.
Projected returns pro-forma
-3.0% appreciation · 3.0% rent growth · sell at horizon
- IRR
- 23.7%
- Equity multiple
- 1.97×
- Total profit
- $17,723
- Equity at exit
- $9,692
- IRR
- 31.6%
- Equity multiple
- 3.86×
- Total profit
- $52,007
- Equity at exit
- $5,620
Cash invested: $18,200 (down + closing). Projections, not guarantees.
Landlord ↔ Tenant lean methodology
- Overall (STATE)
- 87 Strongly Landlord-Friendly
- State Texas
- 87 Strongly Landlord-Friendly · R+5
- County
- — inherits STATE
- City
- — inherits STATE
ZIP-level market 79072
- Active inventory
- 150
- Price-to-rent
- 4.4×
Monthly cashflow live
- Estimated rent
- $1,232 medium interval (Pro) →
- Mortgage (P&I)
- −$341
- Tax from tax record
- −$163 /mo · $1,957/yr
- Insurance
- −$27
- HOA
- −$0
- Vacancy / Maint / Mgmt
- −$259
- Net cashflow
- $443
Break-even live
UW: 25.0% down · 7.5% · 30yr · 1.5% tax · 5.0% vac · 8.0% maint · 8.0% mgmt
Financing live
Cash to close
- Down payment
- $16,250
- Closing costs
- $1,950
- Reserves months
- —
- Total cash needed
- —
Loan-product check · same deal, 3 products live
Conventional
25% down · 7.5% · 30yr
- Down + closing
- —
- Monthly P&I
- —
- Monthly cashflow
- —
- DSCR
- —
- Eligible?
- —
Personal DTI + credit; lowest rate.
DSCR
20% down · 8.5% · 30yr
- Down + closing
- —
- Monthly P&I
- —
- Monthly cashflow
- —
- DSCR
- —
- Eligible?
- —
No personal income docs; deal must DSCR.
Hard money
10% down · 12.0% · 12mo
- Down + closing
- —
- Monthly P&I
- —
- Monthly cashflow
- —
- DSCR
- —
- Eligible?
- —
Short-term bridge; refi at stabilization.
Listing history 2 events
-
2026-06-12remarks 106-char remark
-
2026-06-12$65,000 Pending 1 DOM
ⓘ Source: listings_history table (triggers on properties + properties_extension) + one-shot
backfill from property_details.listing_events for pre-trigger history.
Tax reassessment forecast TX · Resets to sale price
- Current annual tax
- $1,957 · $163/mo
- Projected year-2 tax
- $1,957 · $163/mo
- Expected delta
- $0/yr ($0/mo · 0.0%)
ⓘ Screening estimate from a state-policy table — verify with the county assessor before closing.
Climate risk First Street
- Flood 1/10 Low FEMA zone X (unshaded) · 0% chance over 30 yrs
- Wildfire 3/10 Moderate
- Heat 5/10 Major 7 d/yr ≥99°F today · 22 d/yr by 30 yrs out
- Wind 2/10 Low
- Air quality 2/10 Low 1 unhealthy d/yr today · 1 by 30 yrs out
Nearby sold comps map
Loading sold comps map…
Walkable amenities ~0.75 mi
Loading nearby amenities…
Taxation est. · year 1
- Rental income
- $14,789
- − Mortgage interest
- −$3,641
- − Property taxes
- −$1,957
- − Insurance
- −$325
- − Repairs & maintenance
- −$1,183
- − Management
- −$1,183
- − Depreciation
- −$1,891
- Taxable income
- $4,609
- Est. tax owed @ 24.0%
- −$1,106
- After-tax cash flow
- $4,205/yr
For passive investors: Depreciation is non-cash, so a rental often shows a tax loss while cash-flowing — sheltering income. Rental losses are passive: they offset passive income freely, and up to $25,000/yr can offset ordinary (W-2) income if you actively participate and your MAGI is under $100k (phasing out to $0 by $150k); unused losses carry forward. On sale, claimed depreciation is recaptured at up to 25%, and gains may owe capital-gains tax (a 1031 exchange can defer both). Figures are a year-1 estimate at your 24.0% rate — not tax advice; consult a CPA.
Schools (NCES district)
- District
- Plainview ISD
- NCES district ID
- 4835070
- Math proficiency
- 41% ▼ -3.00%
- Reading proficiency
- 37% ▲ 1.00%
- Median HH income
- $41,146
- Composite
- 32.85/100
- National rank
- #5615
- State rank
- #445 of 826 in TX
Livability — Plainview
- Score
- 69/100
- State rank
- #393
- US rank
- #8233
Category grades
Schools grade is shown separately in the Schools card above.
Census & demographics
- Census place
- Plainview, TX
- County
- Hale County · 25,389 people
- City population
- 25,389
- Metro
- Plainview, TX
- Population (ZIP)
- 25,389
- Household income
- $47,255
- Rent vs Own
- Severe rent burden
- 1015.0
Population outlook (Hale County) Hauer SSP2
- Today (2025)
- 30,851 people
- By 2030
- 29,158 · -5.5%
- By 2040
- 25,681 · -16.8%
- By 2050
- 22,420 · -27.3%
- By 2075
- 15,857 · -48.6%
- By 2100
- 10,500 · -66.0%
Race, ethnicity, and origin ACS 2023
- Neighborhood character
- Majority Hispanic (63%)
- Race & ethnicity
- Hispanic / Latino 63% White 29% Two or more races 19% Black 4% Native American 2%
- Hispanic origin (detail)
- Mexican 52%
- Common ancestry
- Italian 1% Russian 1% Lithuanian 1%
- Foreign-born
- 11% · Canada, Jamaica
- Languages at home
- 63% English-only · Spanish 36%
Political lean MEDSL · Hale
- 2024 margin
- Solid R (+58.0) · D 20.5% · R 78.5%
- 2008→2024 swing
- -13.1pp toward R · 2008: -44.9pp · 2024: -58.0pp
- All cycles
- 2024: R+58.0 2020: R+51.1 2016: R+48.4 2012: R+47.8 2008: R+44.9
Not yet ingested
- Civics
- —
Market trends
- HPI YoY
- ▼ -120.38%
- Current HPI
- 127.9276
- Rent YoY
- —
- Metro
- Plainview, TX
- State GDP YoY
- ▲ 3.95%
- F500 in state
- 110
Industry mix (Fortune 500 HQ in TX)
| Industry | F500 HQs | Revenue |
|---|---|---|
| Energy | 16 | $1,198B |
|
||
| Technology | 5 | $198B |
|
||
| Engineering / Construction | 4 | $72B |
|
||
| Energy Services | 3 | $60B |
|
||
| Utilities | 3 | $41B |
|
||
| Healthcare | 2 | $330B |
|
||
Price history
3 events — show timeline
- 2026-06-11 Pending — PARMLS
- 2026-06-09 Listed $65,000 PARMLS
- 2021-12-22 Sold (Public Records) — Public Records
Property tax history
+6.0%/yrLatest (2025): $1,957 · -3.0% YoY. Source: county tax records.
Cash-flow waterfall
monthlySold comps — $/sqft
last 12 mo · ≤1 miLoading sold comps…