41 High Point Cir S #107 · Naples, FL
Flood risk 6/10 · Moderate
- FEMA flood zone
- X (unshaded)
- Chance of flooding over 30 yrs
- 0.52%
- Est. flood insurance / yr
- $507 – $1,088
Fire risk 1/10 · Minimal
- Est. fire insurance / yr
- $947 – $1,759
Heat risk 10/10 · Severe
- Hot days now (above 107°F)
- 7 days/yr
- Hot days in 30 yrs
- 27 days/yr
Wind risk 10/10 · Severe
- Chance of severe wind over 30 yrs
- 99.0%
Air-quality risk 2/10 · Minimal
- Unhealthy air days now
- 2 days/yr
- Unhealthy air days in 30 yrs
- 2 days/yr
Risk factors via First Street. Map © Google.
Why this score? — see what drove the B grade
The composite is a weighted blend of 9 inputs, each scored 0–100. Each bar is that input's sub-score; the figure is the points it added to the 100-point composite (weight × sub-score).
- Cash flow +27.9/30.0
- 1% rule +10.0/10.0
- DSCR +9.9/10.0
- ARV discount +7.5/15.0
- Rent growth +5.0/5.0
- Schools +5.0/10.0
- Livability +4.0/5.0
- Condition / age +2.5/5.0
- Appreciation +0.0/10.0
$299,000
🖨 Deal sheet (PDF) 📄 Offer letter ✓ Due diligence
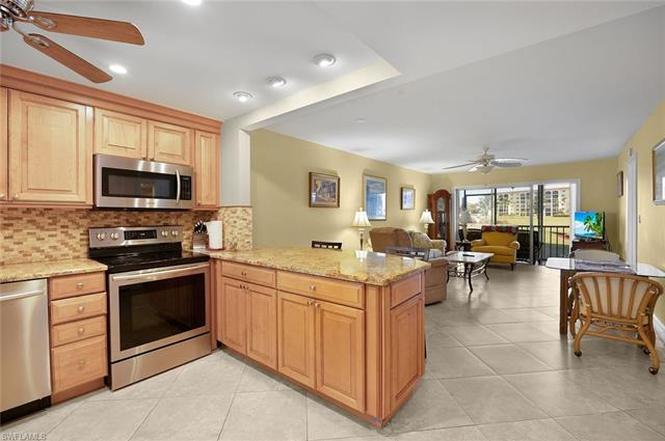
Listing remarks
Tranquil location. Updated kitchen and bathrooms! Flooring is already installed! IMMEDIATE COUNTRY CLUB MEMBERSHIP included and GOLF plus AMENITIES for 2 people! Nestles in Naples, Florida between 5th Ave and Park Shore with a main entrance off of Tamiami and a gated rear entrance at Goodlette-Frank and Ohio. High Point Country Club is a hidden gem. Condo has a new ac and new water heater. Building has a new roof. This unit boasts updated bathrooms and the kitchen has been redone. Enjoy a very active social calendar and an in season restaurant that serves both breakfast and lunch. You can easily walk or take a short bike ride to the beach from this centrally located condo. LOW quarterly HO
Key facts
- Golf amenities
- Centrally located
- Updated bathrooms
Tags
Property features AI
Finance
- Other: Part of a complex with 473 units; 30 units in this building; 1 unit per floor; building number 41, unit 107
- HOA & community: Mandatory HOA; Master HOA fee $2,536 quarterly (total annual recurring fees $10,144); Total one-time fees $150; Professional management; HOA maintenance includes cable, golf course, internet/WiFi access, irrigation water, lawn/land maintenance, manager, master association fee included, trash removal; Community amenities: clubhouse, community pool, exercise room, extra storage, golf course, putting green, restaurant, tennis court, pickleball, bocce court, bike and jog path, bike storage, BBQ/picnic area, hobby room, library, streetlights, vehicle wash area, private membership
Exterior
- Parking: 1 assigned parking space; Driveway (paved); Guest parking available; Detached 1-car carport
- Utilities: Water assessment paid; Sewer assessment paid; Cable available
- Home design: Residential low-rise building (1-3 stories); Rear exposure to the north; Located in the High Point development
- Construction: Concrete block construction; Tile roof; Built in 1979; Foundation: see remarks
- Exterior features: Golf course view; Zero lot line; Paved roads; Impact resistant windows; Impact resistant storm protection; Stucco exterior
Interior
- Kitchen: Pantry; Dishwasher; Microwave; Self-cleaning oven; Refrigerator/Freezer
- Bedrooms: 2 bedrooms (split bedroom floor plan)
- Flooring: Tile
- Bathrooms: 2 full bathrooms; Master bath: see remarks
- Heating & cooling: Central electric heat; Central electric cooling; Ceiling fans
- Interior features: Smoke detectors; Screened lanai/porch; Common elevator access; Furnished
- Laundry & utility: Washer; Dryer
Neighborhood map
What this means for you Summary
Snapshot
- This is a 2-bed/2.0-bath condo listed at $299k.
Deal economics
- At list price, monthly cash flow is $918 ($11k/yr) — positive.
- The deal already cash-flows at list — no discount required.
- Meets the 1% rule at list price ($5k rent vs $299k).
- Recommended offer: $263k (12.0% below list) — sets the bar for market timing.
Location & tenants
- Location reads 80/100 on livability (#126 in FL, #1,903 nationally) — a professional / high-income tenant draw. Strengths: crime A+, amenities A+, employment A+; Watch: commute D+, cost of living F.
- Collier (suburban): math 60% / reading 56% proficiency, ranked #16 of 73 in FL (top 22%) — acceptable for families but not a draw, mixed tenant base, ~2y average lease.
- Market conditions: Rents rising fast (+14.6%/yr); 479 active listings in the ZIP; 40 comparable units currently listed for rent nearby; rentals at typical pace (median 24d on market — plan ~3-4 weeks tenant-placement turnaround); high-income renter base; 3,520 units permitted in Collier County in 2024 (959 in 5+ unit buildings).
- At $4,646/mo this rent would consume 48% of the median local household income ($117k/yr) (locally 311% of renters already pay >50% of income on rent) — very limited rent-growth headroom before tenants either downsize or default.
Forward outlook
- Local home prices are declining (-3.0%/yr); year-one equity from $2k of loan paydown is wiped out by about $9k of value loss. Plan a longer hold.
- Collier County population projected at +30% by 2050 — long-run rental-demand tailwind backs the buy-and-hold thesis.
- At projected returns (-3.0% appreciation + 8.0% rent growth), your $84k cash investment doubles in ~6 years — after that, you're playing with house money.
Negotiation context
- It's been on market 161 days — a 12% lower offer ($263k) is reasonable based on typical stale-listing flexibility.
- 7 sale attempts since 16y ago; this cycle's ask has dropped $126k (30%) from the opening price — seller is motivated, your offer sets the floor, not the list.
- Current owner paid $145k; list at $299k implies a 106% gain — meaningful room to come down on a strong offer.
Risks & watch-outs
- Climate carrying-cost: major flood risk; severe wind risk, 99% chance of damaging wind over 30y; extreme-heat days projected 7→27/yr by 2055 (HVAC capex compounding) — expect insurance premiums to compound above CPI over the hold.
Questions for the listing agent
- It's been on market 161 days. Have you received any prior offers? Is the seller open to a 12% concession, seller financing, or rate buy-down credit?
- Built in 1979 — when were the roof, HVAC, electrical panel, plumbing, and water heater last replaced?
- What does the HOA fee cover, when was the last increase, and are there any pending special assessments or reserve-fund shortfalls?
- Any open or pending special assessments — roof, HVAC, plumbing, elevator, façade? What's the per-unit balance and payoff schedule, and is the seller paying it off at close or rolling it to the buyer?
- Why hasn't it sold? Are there any deal-killer items the seller is aware of (foundation, flood, title, zoning, code violations)?
- Is there a deadline driving the sale (1031 exchange, divorce, estate, relocation)? That informs how much negotiation room exists.
- Schools are B-rated — typically a magnet for longer-tenancy family renters. What's the average tenant stay here, and is there a school-zone premium baked into asking?
- What's the average days-on-market for RENTAL listings here right now (not sales)? A rising rental-DOM trend means longer vacancies and softer asking-rent achievability than the comps imply.
- What's the recent tenant-quality profile in this submarket — average credit score on applications, eviction rate, late-payment / NSF rate, and stable-employment percentage? A property-management company in the area should have these aggregated.
- How much new apartment / multifamily construction is in the pipeline within 1–3 miles? Heavy new supply (>2% of stock underway) typically softens rents 12–24 months out; light construction supports rent growth.
Investment metrics
- 1% rule
- 1.55% ✓
- Cap rate
- 9.98%
- Cash-on-cash
- 13.16%
- DSCR
- 1.59
- GRM
- 5.4
CMA / ARV
No comps found within radius.
Projected returns pro-forma
-3.0% appreciation · 8.0% rent growth · sell at horizon
- IRR
- 9.9%
- Equity multiple
- 1.42×
- Total profit
- $35,079
- Equity at exit
- $44,582
- IRR
- 23.5%
- Equity multiple
- 3.62×
- Total profit
- $219,611
- Equity at exit
- $25,852
Cash invested: $83,720 (down + closing). Projections, not guarantees.
Landlord ↔ Tenant lean methodology
- Overall (STATE)
- 87 Strongly Landlord-Friendly
- State Florida
- 87 Strongly Landlord-Friendly · R+3
- County
- — inherits STATE
- City
- — inherits STATE
ZIP-level market 34103
- Rents YoY
- 14.6%
- Active inventory
- 479
- Price-to-rent
- 5.4×
Monthly cashflow live
- Estimated rent
- $4,646 medium interval (Pro) →
- Mortgage (P&I)
- −$1,568
- Tax from tax record
- −$215 /mo · $2,579/yr
- Insurance
- −$125
- HOA
- −$845
- Vacancy / Maint / Mgmt
- −$976
- Net cashflow
- $918
Break-even live
Sensitivity live
| Price | -10% $1,087 | -5% $1,003 | +0% $918 | +5% $834 | +10% $749 |
|---|---|---|---|---|---|
| Rent | -10% $551 | -5% $735 | +0% $918 | +5% $1,102 | +10% $1,285 |
| Rate | -1.0pp $1,069 | -0.5pp $994 | base $918 | +0.5pp $841 | +1.0pp $762 |
UW: 25.0% down · 7.5% · 30yr · 1.5% tax · 5.0% vac · 8.0% maint · 8.0% mgmt
Financing live
Cash to close
- Down payment
- $74,750
- Closing costs
- $8,970
- Reserves months
- —
- Total cash needed
- —
Loan-product check · same deal, 3 products live
Conventional
25% down · 7.5% · 30yr
- Down + closing
- —
- Monthly P&I
- —
- Monthly cashflow
- —
- DSCR
- —
- Eligible?
- —
Personal DTI + credit; lowest rate.
DSCR
20% down · 8.5% · 30yr
- Down + closing
- —
- Monthly P&I
- —
- Monthly cashflow
- —
- DSCR
- —
- Eligible?
- —
No personal income docs; deal must DSCR.
Hard money
10% down · 12.0% · 12mo
- Down + closing
- —
- Monthly P&I
- —
- Monthly cashflow
- —
- DSCR
- —
- Eligible?
- —
Short-term bridge; refi at stabilization.
Rent comps 40 comps
| Address | Beds | Baths | Sqft | Rent | $/sqft | DOM | Units | Dist |
|---|---|---|---|---|---|---|---|---|
| 45 High Point Cir S #303 Naples, FL | 2.0 | 2.0 | 1015 | $5,500 | $5.42 | 24d | 1 | 0.05mi |
| 3200 Binnacle Dr Unit D3 Naples, FL | 2.0 | 2.0 | 1180 | $9,000 | $7.63 | 22d | 1 | 0.45mi |
| 3030 Binnacle Dr #201 Naples, FL | 2.0 | 2.0 | 1092 | $5,000 | $4.58 | 24d | 1 | 0.52mi |
| 820 Ketch Dr #3 Naples, FL | 2.0 | 2.0 | 1100 | $5,500 | $5.00 | 24d | 1 | 0.53mi |
| 820 Ketch Dr #2 Naples, FL | 2.0 | 2.0 | 1100 | $5,700 | $5.18 | 24d | 1 | 0.53mi |
| 2400 14th St N Naples, FL | 3.0 | 2.0 | 1464 | $5,890 | $4.02 | 14d | 1 | 0.62mi |
| 788 Park Shore Dr Naples, FL | 1.0–2.0 | 1.5–2.0 | 931 | $5,500 | $5.90 | 14d | 3 | 0.65mi |
| 3930 Belair Ln Naples, FL | 2.0 | 2.0 | 1300 | $6,000 | $4.62 | 24d | 1 | 0.78mi |
| 3520 Bolero Way Unit 1325569P Naples, FL | 3.0 | 2.0 | 1399 | $5,021 | $3.59 | 14d | 1 | 0.96mi |
| 4092 Belair Ln #15 Naples, FL | 3.0 | 3.0 | 1500 | $6,200 | $4.13 | 24d | 1 | 0.97mi |
| 333 Harbour Dr #211 Naples, FL | 2.0 | 2.0 | 975 | $5,500 | $5.64 | 14d | 1 | 1.04mi |
| 555 Park Shore Dr Unit B410 Naples, FL | 2.0 | 2.0 | 1200 | $6,000 | $5.00 | 22d | 1 | 1.13mi |
| 222 Harbour Dr #105 Naples, FL | 2.0 | 2.0 | 1393 | $13,000 | $9.33 | 24d | 1 | 1.13mi |
| 1082 Capri Dr Naples, FL | 3.0 | 2.0 | 1500 | $9,000 | $6.00 | 24d | 1 | 1.14mi |
| 600 Neapolitan Way Naples, FL | 1.0–2.0 | 2.0 | 832 | $5,200 | $6.25 | 24d | 2 | 1.14mi |
| 3400 Gulf Shore Blvd N Unit M3 Naples, FL | 2.0 | 2.0 | 1337 | $9,500 | $7.11 | 24d | 1 | 1.16mi |
| 4523 Fluvia Ave Naples, FL | 2.0 | 1.0 | 1050 | $5,500 | $5.24 | 24d | 1 | 1.16mi |
| 4525 Fluvia Ave Naples, FL | 2.0 | 1.0 | 1050 | $5,500 | $5.24 | 24d | 1 | 1.16mi |
| 3200 Gulf Shore Blvd N #105 Naples, FL | 2.0 | 2.0 | 1116 | $8,500 | $7.62 | 24d | 1 | 1.19mi |
| 3070 Gulf Shore Blvd N #103 Naples, FL | 2.0 | 2.0 | 1300 | $8,000 | $6.15 | 24d | 1 | 1.19mi |
| 2581 Poinciana St Naples, FL | 3.0 | 2.0 | 1255 | $9,000 | $7.17 | 24d | 1 | 1.21mi |
| 3500 Gulf Shore Blvd N Naples, FL | 2.0 | 2.0 | 1258 | $7,650 | $6.08 | 24d | 2 | 1.24mi |
| 2600 Gulf Shore Blvd N #64 Naples, FL | 2.0 | 2.0 | 1200 | $7,200 | $6.00 | 24d | 1 | 1.28mi |
| 4200 Belair Ln Naples, FL | 2.0–3.0 | 2.0 | 1406 | $6,500 | $4.62 | 24d | 5 | 1.28mi |
| 2885 Gulf Shore Blvd N #302 Naples, FL | 2.0 | 2.0 | 1500 | $20,000 | $13.33 | 24d | 1 | 1.29mi |
| 2500 Gulf Shore Blvd N Unit S6 Naples, FL | 2.0 | 2.0 | 1145 | $7,500 | $6.55 | 24d | 1 | 1.29mi |
| 3443 Gulf Shore Blvd N Naples, FL | 2.0 | 2.0 | 1171 | $12,750 | $10.88 | 14d | 11 | 1.31mi |
| 2258 Gulf Shore Blvd N Unit O1 Naples, FL | 2.0 | 2.0 | 1491 | $13,750 | $9.22 | 24d | 1 | 1.34mi |
| 2216 Gulf Shore Blvd N Unit R3 Naples, FL | 2.0 | 2.0 | 1265 | $10,000 | $7.91 | 24d | 1 | 1.34mi |
| 4300 Belair Ln Naples, FL | 2.0 | 2.0 | 1200 | $6,750 | $5.62 | 14d | 2 | 1.37mi |
| 4001 Gulf Shore Blvd N #105 Naples, FL | 2.0 | 2.0 | 1247 | $12,000 | $9.62 | 24d | 1 | 1.42mi |
| 4001 Gulf Shore Blvd N #1104 Naples, FL | 2.0 | 2.0 | 1267 | $11,000 | $8.68 | 24d | 1 | 1.42mi |
| 4001 Gulf Shore Blvd N #303 Naples, FL | 2.0 | 2.0 | 1248 | $9,000 | $7.21 | 24d | 1 | 1.42mi |
| 4001 Gulf Shore Blvd N #803 Naples, FL | 2.0 | 2.0 | 1267 | $13,000 | $10.26 | 24d | 1 | 1.42mi |
| 4001 Gulf Shore Blvd N #505 Naples, FL | 2.0 | 2.0 | 1271 | $9,000 | $7.08 | 14d | 1 | 1.42mi |
| 4001 Gulf Shore Blvd N #707 Naples, FL | 2.0 | 2.0 | 1267 | $20,000 | $15.79 | 24d | 1 | 1.42mi |
| 4005 Gulf Shore Blvd N #605 Naples, FL | 2.0 | 2.0 | 1267 | $10,000 | $7.89 | 24d | 1 | 1.44mi |
| 4005 Gulf Shore Blvd N #607 Naples, FL | 2.0 | 2.0 | 1400 | $14,000 | $10.00 | 24d | 1 | 1.44mi |
| 2203 Gulf Shore Blvd N Unit E1 Naples, FL | 2.0 | 2.0 | 1491 | $17,500 | $11.74 | 24d | 1 | 1.44mi |
| 2211 Gulf Shore Blvd N Unit C4 Naples, FL | 2.0 | 2.0 | 1265 | $17,500 | $13.83 | 24d | 1 | 1.46mi |
HOA detail condo
- Monthly dues
- $845 · $10,140/yr
- Likely covers
- watersecurity
- Assessments
- None detected in remarks — confirm with the listing agent.
Listing history 30 events
-
2026-06-19price $299,000 Active 161 DOM
-
2026-06-18days on market $339,000 Active 161 DOM
-
2026-06-17days on market $339,000 Active 160 DOM
-
2026-06-16days on market $339,000 Active 159 DOM
-
2026-06-15days on market $339,000 Active 158 DOM
-
2026-06-14days on market $339,000 Active 156 DOM
-
2026-06-10days on market $339,000 Active 153 DOM
-
2026-06-09days on market $339,000 Active 152 DOM
-
2026-06-08days on market $339,000 Active 151 DOM
-
2026-06-07days on market $339,000 Active 150 DOM
-
2026-06-03days on market $339,000 Active 146 DOM
-
2026-06-02days on market $339,000 Active 145 DOM
-
2026-06-01days on market $339,000 Active 144 DOM
-
2026-05-31days on market $339,000 Active 143 DOM
-
2026-05-30days on market $339,000 Active 142 DOM
-
2026-02-19price $349,000
-
2026-02-04price $389,000
-
2026-01-08$425,000 Active
-
2019-03-07historical
-
2019-01-21$279,900 Active
-
2019-01-18$279,900
-
2015-03-17soldstatus $145,000
-
2015-03-11price $160,000
-
2015-03-11soldstatus $145,000
-
2015-01-25$145,000
-
2012-10-16soldstatus $95,000
-
2012-10-05soldstatus $95,000
-
2012-04-18$107,000
-
2010-10-27$103,900
-
2010-01-25$139,900
ⓘ Source: listings_history table (triggers on properties + properties_extension) + one-shot
backfill from property_details.listing_events for pre-trigger history.
Tax reassessment forecast FL · Resets to sale price
- Current annual tax
- $2,579 · $215/mo
- Projected year-2 tax
- $2,579 · $215/mo
- Expected delta
- $0/yr ($0/mo · 0.0%)
ⓘ Screening estimate from a state-policy table — verify with the county assessor before closing.
Climate risk First Street
- Flood 6/10 Major FEMA zone X (unshaded) · 52% chance over 30 yrs
- Wildfire 1/10 Low
- Heat 10/10 Extreme 7 d/yr ≥107°F today · 27 d/yr by 30 yrs out
- Wind 10/10 Extreme 99% chance of damaging wind over 30 yrs
- Air quality 2/10 Low 2 unhealthy d/yr today · 2 by 30 yrs out
Nearby sold comps map
Loading sold comps map…
Walkable amenities ~0.75 mi
Loading nearby amenities…
Taxation est. · year 1
- Rental income
- $55,757
- − Mortgage interest
- −$16,749
- − Property taxes
- −$2,579
- − Insurance
- −$1,495
- − Repairs & maintenance
- −$4,461
- − Management
- −$4,461
- − HOA
- −$10,140
- − Depreciation
- −$8,698
- Taxable income
- $7,176
- Est. tax owed @ 24.0%
- −$1,722
- After-tax cash flow
- $9,297/yr
For passive investors: Depreciation is non-cash, so a rental often shows a tax loss while cash-flowing — sheltering income. Rental losses are passive: they offset passive income freely, and up to $25,000/yr can offset ordinary (W-2) income if you actively participate and your MAGI is under $100k (phasing out to $0 by $150k); unused losses carry forward. On sale, claimed depreciation is recaptured at up to 25%, and gains may owe capital-gains tax (a 1031 exchange can defer both). Figures are a year-1 estimate at your 24.0% rate — not tax advice; consult a CPA.
Schools (NCES district)
- District
- Collier
- NCES district ID
- 1200330
- Math proficiency
- 60% ▼ -4.00%
- Reading proficiency
- 56% ▼ -2.00%
- Median HH income
- $58,275
- Composite
- 50.23/100
- National rank
- #1892
- State rank
- #16 of 73 in FL
Livability — Naples
- Score
- 80/100
- State rank
- #126
- US rank
- #1903
Category grades
Schools grade is shown separately in the Schools card above.
Census & demographics
- County
- Collier County · 396,295 people
- City population
- 344,941
- Metro
- Naples-Marco Island, FL
- Population (ZIP)
- 11,299
- Household income
- $116,875
- Rent vs Own
- Severe rent burden
- 311.0
Population outlook (Collier County) Hauer SSP2
- Today (2025)
- 420,858 people
- By 2030
- 450,054 · +6.9%
- By 2040
- 502,232 · +19.3%
- By 2050
- 544,932 · +29.5%
- By 2075
- 627,203 · +49.0%
- By 2100
- 659,015 · +56.6%
Race, ethnicity, and origin ACS 2023
- Neighborhood character
- Predominantly White (87%)
- Race & ethnicity
- White 87% Hispanic / Latino 10% Two or more races 8% Asian 1%
- Hispanic origin (detail)
- Common ancestry
- Romanian 4% Lithuanian 2% Portuguese 2%
- Foreign-born
- 13% · Canada
- Languages at home
- 87% English-only · Spanish 9% Other Indo-European 2% German/W. Germanic 1%
Political lean MEDSL · Collier
- 2024 margin
- Solid R (+33.1) · D 33.1% · R 66.2%
- 2008→2024 swing
- -10.6pp toward R · 2008: -22.5pp · 2024: -33.1pp
- All cycles
- 2024: R+33.1 2020: R+24.7 2016: R+26.0 2012: R+30.1 2008: R+22.5
Not yet ingested
- Civics
- —
Market trends
- HPI YoY
- ▼ -327.53%
- Current HPI
- 315.1396
- Rent YoY
- ▲ 14.55%
- Metro
- Naples-Marco Island, FL
- State GDP YoY
- ▲ 3.28%
- F500 in state
- 36
Industry mix (Fortune 500 HQ in FL)
| Industry | F500 HQs | Revenue |
|---|---|---|
| Industrial Technology | 2 | $29B |
|
||
| Insurance | 2 | $17B |
|
||
| Retail | 1 | $60B |
|
||
| Technology Distribution | 1 | $58B |
|
||
| Homebuilding | 1 | $35B |
|
||
| Technology Manufacturing | 1 | $35B |
|
||
Price history
+149.5% since first listed15 events — show timeline
- 2026-02-19 Price Changed $349,000 NAPLESMLS
- 2026-02-04 Price Changed $389,000 NAPLESMLS
- 2026-01-08 Listed $425,000 NAPLESMLS
- 2019-03-07 Listing Removed — NAPLESMLS
- 2019-01-21 Listed $279,900 NAPLESMLS
- 2019-01-18 Listed $279,900 MIML
- 2015-03-17 Sold (Public Records) $145,000 Public Records
- 2015-03-11 Sold (MLS) $145,000 NAPLESMLS
- 2015-03-11 Price Changed $160,000 NAPLESMLS
- 2015-01-25 Listed $145,000 NAPLESMLS
- 2012-10-16 Sold (Public Records) $95,000 Public Records
- 2012-10-05 Sold (MLS) $95,000 NAPLESMLS
- 2012-04-18 Listed $107,000 NAPLESMLS
- 2010-10-27 Listed $103,900 NAPLESMLS
- 2010-01-25 Listed $139,900 NAPLESMLS
Property tax history
+7.1%/yrLatest (2025): $2,579 · +5.0% YoY. Source: county tax records.
Cash-flow waterfall
monthlySold comps — $/sqft
last 12 mo · ≤1 miLoading sold comps…