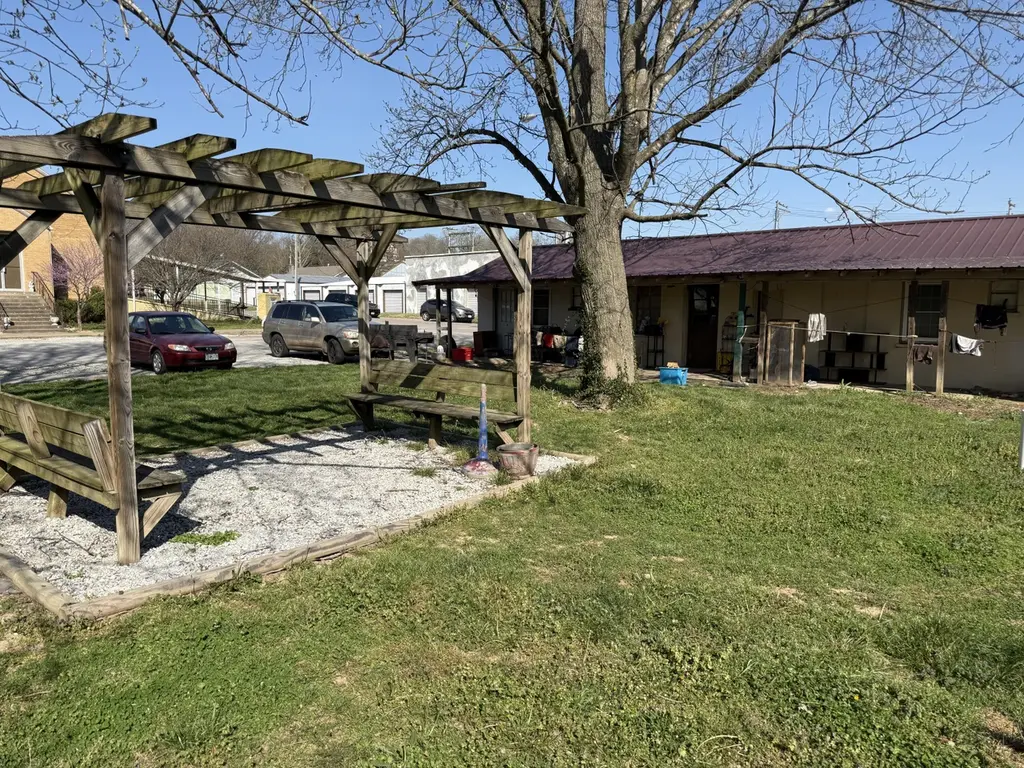
 5-Plex
304 W Meadow Ave · Crane, MO
Flood risk 1/10 · Minimal
- FEMA flood zone
- X (unshaded)
- Chance of flooding over 30 yrs
- 0.0%
- Est. flood insurance / yr
- $507 – $1,088
Fire risk 5/10 · Moderate
- Est. fire insurance / yr
- $1,054 – $1,958
Heat risk 5/10 · Moderate
- Hot days now (above 104°F)
- 7 days/yr
- Hot days in 30 yrs
- 21 days/yr
Wind risk 2/10 · Minimal
- Chance of severe wind over 30 yrs
- 0.0%
Air-quality risk 1/10 · Minimal
- Unhealthy air days now
- 0 days/yr
- Unhealthy air days in 30 yrs
- 0 days/yr
Risk factors via First Street. Map © Google.
Why this score? — see what drove the B grade
The composite is a weighted blend of 9 inputs, each scored 0–100. Each bar is that input's sub-score; the figure is the points it added to the 100-point composite (weight × sub-score).
- Cash flow +27.2/30.0
- Appreciation +10.0/10.0
- DSCR +9.4/10.0
- ARV discount +7.5/15.0
- 1% rule +7.4/10.0
- Livability +3.1/5.0
- Schools +3.0/10.0
- Rent growth +2.5/5.0
- Condition / age +2.5/5.0
$341,000
🖨 Deal sheet 📄 Offer letter ✓ Due diligence
Multi-family units
County records classify this as Multi-Family (5+ Unit). Listing-text estimate: 5 units. confirmed
5+ unit building — per-unit beds/baths from public records are typically unavailable; the breakdown below (if shown) is an estimate from the listing text.
Listing remarks MLS
Eight apartments in three buildings that are fully rented out. Five of the apartments have been remodeled. Three efficiency apartments have not been refreshed, but could rent for more if a new owner spiffed them up. This property is offered in a package that includes these apartments plus five rental houses, all being sold to move fast with a high cap rate. ONE OF THE HOUSES SOLD, CHANGING THE LISTING PRICE FOR THE PACKAGE.
Key facts
- 0.33 acre lot
- Built 1940
- Listed 76 days
Neighborhood map
What this means for you Summary
Snapshot
- This is a 5 × 1-bed/1-bath units multifamily listed at $341k.
Deal economics
- At list price, monthly cash flow is $974 ($12k/yr) — positive. Per door: $195/mo.
- The deal already cash-flows at list — no discount required.
- Meets the 1% rule at list price ($4k rent vs $341k).
- Recommended offer: $321k (6.0% below list) — sets the bar for market timing.
Location & tenants
- Location reads 62/100 on livability (#390 in MO) — a middle-class / working-renter tenant base. Strengths: cost of living A+, housing A-, crime B+; Watch: health & safety C-, schools F, amenities F.
- Crane R-III (rural): math 33% / reading 38% proficiency, ranked #218 of 324 in MO (top 67%) — families likely to look elsewhere, expect single-tenant / working-renter base with shorter leases.
- Market conditions: 39 active listings in the ZIP; 191 units permitted in Stone County in 2024 (0 in 5+ unit buildings).
Forward outlook
- In year one you build about $36k of equity ($2k loan paydown + $34k appreciation (10.0% local appreciation)).
- Stone County population projected at -30% by 2050 — secular population decline; favor cash flow + early exit over multi-decade hold.
- At projected returns (10.0% appreciation + 3.0% rent growth), your $95k cash investment doubles in ~2 years — after that, you're playing with house money.
- By year 2, paydown + projected appreciation supports a ~$59k cash-out refi (75% LTV) — recoverable capital for the next deal without selling this one.
Negotiation context
- It's been on market 76 days — a 6% lower offer ($321k) is reasonable based on typical stale-listing flexibility.
- 2 sale attempts; this cycle's ask has dropped $18k (5%) from the opening price — seller is motivated, your offer sets the floor, not the list.
Risks & watch-outs
- Watch-outs: built in 1940 — expect roof / HVAC / electrical / plumbing capex.
- Climate carrying-cost: moderate wildfire risk; extreme-heat days projected 7→21/yr by 2055 (HVAC capex compounding) — expect insurance premiums to compound above CPI over the hold.
Questions for the listing agent
- It's been on market 76 days. Have you received any prior offers? Is the seller open to a 6% concession, seller financing, or rate buy-down credit?
- Can we see the unit-by-unit rent roll, current vacancy, and any below-market leases? What's the average tenancy length?
- What capital expenditures (roof, boiler, parking lot, exteriors) have been made in the last 5 years, and what's planned in the next 2?
- Built in 1940 — when were the roof, HVAC, electrical panel, plumbing, and water heater last replaced?
- Why hasn't it sold? Are there any deal-killer items the seller is aware of (foundation, flood, title, zoning, code violations)?
- Is there a deadline driving the sale (1031 exchange, divorce, estate, relocation)? That informs how much negotiation room exists.
- Schools are F-rated, which usually means shorter tenancies and higher turnover. Who's the typical renter profile here, and what's been the actual vacancy rate?
- What's the average days-on-market for RENTAL listings here right now (not sales)? A rising rental-DOM trend means longer vacancies and softer asking-rent achievability than the comps imply.
- What's the recent tenant-quality profile in this submarket — average credit score on applications, eviction rate, late-payment / NSF rate, and stable-employment percentage? A property-management company in the area should have these aggregated.
- How much new apartment / multifamily construction is in the pipeline within 1–3 miles? Heavy new supply (>2% of stock underway) typically softens rents 12–24 months out; light construction supports rent growth.
Investment metrics
- 1% rule
- 1.24% ✓
- Cap rate
- 9.72%
- Cash-on-cash
- 12.24%
- DSCR
- 1.54
- GRM
- 6.7
CMA / ARV
No comps found within radius.
Projected returns pro-forma
10.0% appreciation · 3.0% rent growth · sell at horizon
- IRR
- 33.3%
- Equity multiple
- 3.60×
- Total profit
- $247,820
- Equity at exit
- $307,200
- IRR
- 28.7%
- Equity multiple
- 8.13×
- Total profit
- $681,129
- Equity at exit
- $662,488
Cash invested: $95,480 (down + closing). Projections, not guarantees.
Landlord ↔ Tenant lean methodology
- Overall (STATE)
- 81 Strongly Landlord-Friendly
- State Missouri
- 81 Strongly Landlord-Friendly · R+10
- County
- — inherits STATE
- City
- — inherits STATE
ZIP-level market 65633
- Home prices YoY
- 6.7%
- Active inventory
- 39
- Price-to-rent
- 33.7×
Monthly cashflow live
- Estimated rent
- $4,216 medium interval (Pro) →
- Mortgage (P&I)
- −$1,788
- Tax est. 1.5%
- −$426 /mo · $5,115/yr
- Insurance
- −$142
- HOA
- −$0
- Vacancy / Maint / Mgmt
- −$885
- Net cashflow
- $974
Break-even live
5-unit breakdown (identical units grouped — click to expand)
| Units | Beds | Baths | Est. rent |
|---|---|---|---|
| 5× units | 1 | 1 | $4,215 |
| #1 | 1 | 1 | $843 |
| #2 | 1 | 1 | $843 |
| #3 | 1 | 1 | $843 |
| #4 | 1 | 1 | $843 |
| #5 | 1 | 1 | $843 |
| Total (5 units) | $4,216 | ||
UW: 25.0% down · 7.5% · 30yr · 1.5% tax · 5.0% vac · 8.0% maint · 8.0% mgmt
Financing live
Cash to close
- Down payment
- $85,250
- Closing costs
- $10,230
- Reserves months
- —
- Total cash needed
- —
Loan-product check · same deal, 3 products live
Conventional
25% down · 7.5% · 30yr
- Down + closing
- —
- Monthly P&I
- —
- Monthly cashflow
- —
- DSCR
- —
- Eligible?
- —
Personal DTI + credit; lowest rate.
DSCR
20% down · 8.5% · 30yr
- Down + closing
- —
- Monthly P&I
- —
- Monthly cashflow
- —
- DSCR
- —
- Eligible?
- —
No personal income docs; deal must DSCR.
Hard money
10% down · 12.0% · 12mo
- Down + closing
- —
- Monthly P&I
- —
- Monthly cashflow
- —
- DSCR
- —
- Eligible?
- —
Short-term bridge; refi at stabilization.
Listing history 18 events
-
2026-06-18days on market $341,000 Active 76 DOM
-
2026-06-17days on market $341,000 Active 75 DOM
-
2026-06-16days on market $341,000 Active 74 DOM
-
2026-06-15days on market $341,000 Active 73 DOM
-
2026-06-13days on market $341,000 Active 71 DOM
-
2026-06-12days on market $341,000 Active 70 DOM
-
2026-06-09days on market $341,000 Active 67 DOM
-
2026-06-08days on market $341,000 Active 66 DOM
-
2026-06-07days on market $341,000 Active 65 DOM
-
2026-06-07days on market $341,000 Active 64 DOM
-
2026-06-04days on market $341,000 Active 61 DOM
-
2026-06-02pricedays on market $341,000 Active 60 DOM
-
2026-06-01days on market $359,000 Active 59 DOM
-
2026-05-31days on market $359,000 Active 58 DOM
-
2026-05-07price $500,000 427-char remark
Show marketing remark (427 chars)
Eight apartments in three buildings that are fully rented out. Five of the apartments have been remodeled. Three efficiency apartments have not been refreshed, but could rent for more if a new owner spiffed them up. This property is offered in a package that includes these apartments plus five rental houses, all being sold to move fast with a high cap rate. ONE OF THE HOUSES SOLD, CHANGING THE LISTING PRICE FOR THE PACKAGE.
-
2026-04-02$359,000 Active 436-char remark
Show marketing remark (436 chars)
Eight fully occupied apartments across three buildings, with strong in-place income. Five units have been recently remodeled, while three efficiency apartments offer clear upside potential with light updates and increased rents. This property is part of a larger investment package that includes five rental homes-priced to sell quickly and offering an attractive cap rate for investors seeking both stability and value-add opportunity.
-
2026-04-01$659,000 Active 427-char remark
Show marketing remark (427 chars)
Eight apartments in three buildings that are fully rented out. Five of the apartments have been remodeled. Three efficiency apartments have not been refreshed, but could rent for more if a new owner spiffed them up. This property is offered in a package that includes these apartments plus five rental houses, all being sold to move fast with a high cap rate. ONE OF THE HOUSES SOLD, CHANGING THE LISTING PRICE FOR THE PACKAGE.
-
2005-02-01soldstatus
ⓘ Source: listings_history table (triggers on properties + properties_extension) + one-shot
backfill from property_details.listing_events for pre-trigger history.
Climate risk First Street
- Flood 1/10 Low FEMA zone X (unshaded) · 0% chance over 30 yrs
- Wildfire 5/10 Major
- Heat 5/10 Major 7 d/yr ≥104°F today · 21 d/yr by 30 yrs out
- Wind 2/10 Low 0% chance of damaging wind over 30 yrs
- Air quality 1/10 Low 0 unhealthy d/yr today · 0 by 30 yrs out
Nearby sold comps map
Loading sold comps map…
Walkable amenities ~0.75 mi
Loading nearby amenities…
Taxation est. · year 1
- Rental income
- $50,592
- − Mortgage interest
- −$19,101
- − Property taxes
- −$5,115
- − Insurance
- −$1,705
- − Repairs & maintenance
- −$4,047
- − Management
- −$4,047
- − Depreciation
- −$9,920
- Taxable income
- $6,656
- Est. tax owed @ 24.0%
- −$1,597
- After-tax cash flow
- $10,091/yr
For passive investors: Depreciation is non-cash, so a rental often shows a tax loss while cash-flowing — sheltering income. Rental losses are passive: they offset passive income freely, and up to $25,000/yr can offset ordinary (W-2) income if you actively participate and your MAGI is under $100k (phasing out to $0 by $150k); unused losses carry forward. On sale, claimed depreciation is recaptured at up to 25%, and gains may owe capital-gains tax (a 1031 exchange can defer both). Figures are a year-1 estimate at your 24.0% rate — not tax advice; consult a CPA.
Schools (NCES district)
- District
- Crane R-III
- NCES district ID
- 2910290
- Math proficiency
- 33% ▲ 8.00%
- Reading proficiency
- 38% ▼ -1.00%
- Median HH income
- $37,713
- Composite
- 29.57/100
- National rank
- #6484
- State rank
- #218 of 324 in MO
Livability — Crane
- Score
- 62/100
- State rank
- #390
- US rank
- #16905
Category grades
Schools grade is shown separately in the Schools card above.
Census & demographics
- Census place
- Crane, MO
- Population (ZIP)
- 3,940
Population outlook (Stone County) Hauer SSP2
- Today (2025)
- 28,147 people
- By 2030
- 26,405 · -6.2%
- By 2040
- 22,762 · -19.1%
- By 2050
- 19,706 · -30.0%
- By 2075
- 14,742 · -47.6%
- By 2100
- 10,832 · -61.5%
Race, ethnicity, and origin ACS 2023
- Neighborhood character
- Predominantly White (91%)
- Race & ethnicity
- White 91% Two or more races 7% Hispanic / Latino 2%
- Common ancestry
- Italian 4% Lithuanian 2% Serbian 1%
- Foreign-born
- 0% · Canada
- Languages at home
- 99% English-only · Spanish 1%
Political lean MEDSL · Stone
- 2024 margin
- Solid R (+61.4) · D 18.9% · R 80.3%
- 2008→2024 swing
- -24.1pp toward R · 2008: -37.3pp · 2024: -61.4pp
- All cycles
- 2024: R+61.4 2020: R+61.1 2016: R+62.1 2012: R+49.2 2008: R+37.3
Not yet ingested
- Civics
- —
Market trends
- HPI YoY
- ▲ 13.77%
- Current HPI
- 218.31
- Rent YoY
- —
- Metro
- —
- State GDP YoY
- ▲ 1.84%
- F500 in state
- 20
Industry mix (Fortune 500 HQ in MO)
| Industry | F500 HQs | Revenue |
|---|---|---|
| Healthcare | 1 | $163B |
|
||
| Insurance | 1 | $21B |
|
||
| Industrial Technology | 1 | $17B |
|
||
| Retail | 1 | $16B |
|
||
| Industrial Distribution | 1 | $10B |
|
||
| Utilities | 1 | $9B |
|
||
Price history
-24.1% since first listed4 events — show timeline
- 2026-05-07 Price Changed $500,000 SOMO
- 2026-04-02 Listed $359,000 SOMO
- 2026-04-01 Listed $659,000 SOMO
- 2005-02-01 Sold (Public Records) — Public Records
Property tax history
+0.5%/yrLatest (2025): $454 · -0.0% YoY. Source: county tax records.
Cash-flow waterfall
monthlySold comps — $/sqft
last 12 mo · ≤1 miLoading sold comps…