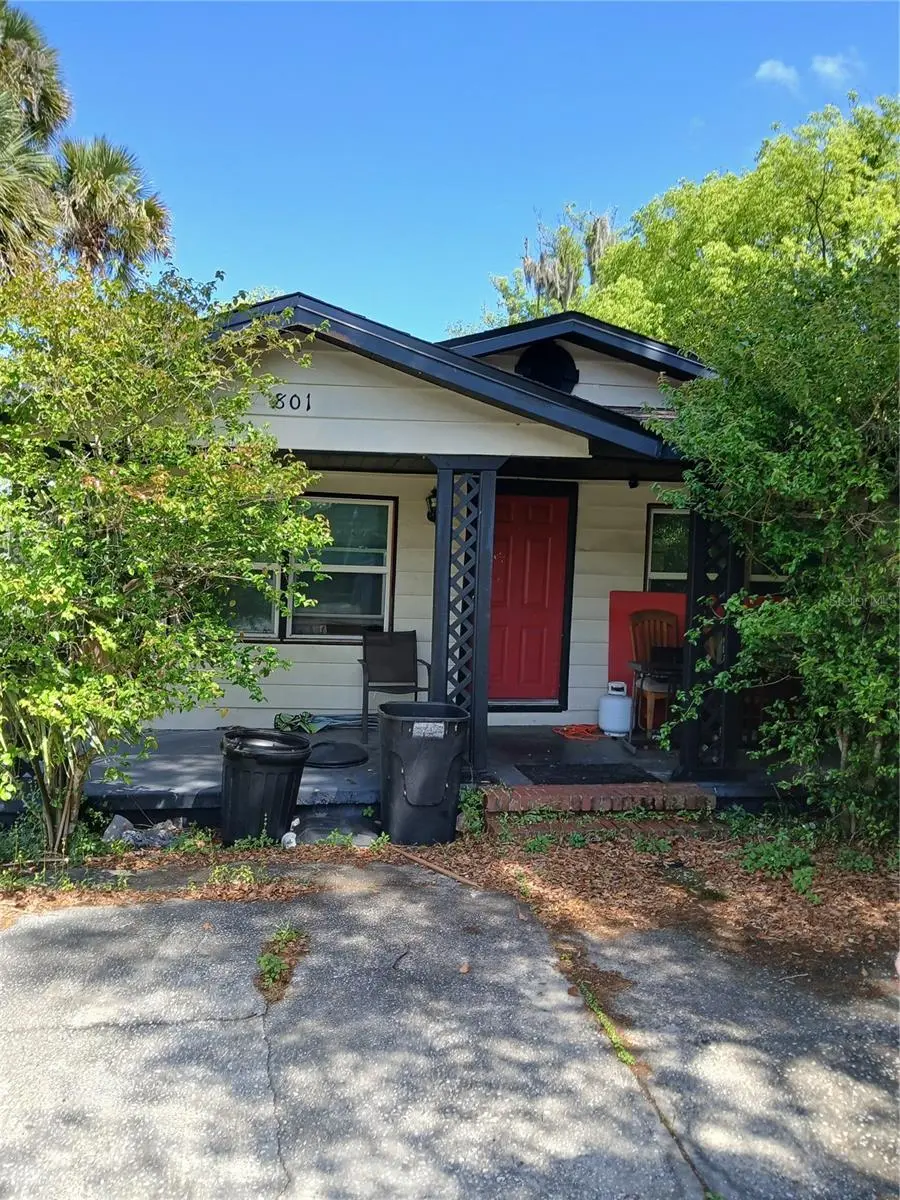
801 S Bay Ave · Sanford, FL
Flood risk 1/10 · Minimal
- FEMA flood zone
- X (unshaded)
- Chance of flooding over 30 yrs
- 0.0%
- Est. flood insurance / yr
- $507 – $1,088
Fire risk 1/10 · Minimal
- Est. fire insurance / yr
- $947 – $1,759
Heat risk 8/10 · Major
- Hot days now (above 107°F)
- 7 days/yr
- Hot days in 30 yrs
- 21 days/yr
Wind risk 9/10 · Severe
- Chance of severe wind over 30 yrs
- 99.0%
Air-quality risk 2/10 · Minimal
- Unhealthy air days now
- 1 days/yr
- Unhealthy air days in 30 yrs
- 1 days/yr
Risk factors via First Street. Map © Google.
Why this score? — see what drove the D+ grade
The composite is a weighted blend of 9 inputs, each scored 0–100. Each bar is that input's sub-score; the figure is the points it added to the 100-point composite (weight × sub-score).
- Cash flow +15.3/30.0
- ARV discount +12.8/15.0
- Schools +5.1/10.0
- DSCR +4.7/10.0
- Livability +3.7/5.0
- 1% rule +2.9/10.0
- Rent growth +2.6/5.0
- Condition / age +2.5/5.0
- Appreciation +0.0/10.0
$190,000
🖨 Deal sheet (PDF) 📄 Offer letter ✓ Due diligence
Listing remarks MLS
Must see this move in ready home priced for either a new homeowner or investor. The open floor plan is absolutely amazing for a home priced so low. New Central A/C has warranty transferable to purchaser. Call your Realtor for a personal showing today before it is gone! Owner will entertain both Cash and Conventionally financed offers from bank qualified buyers.
Key facts
- Open floor plan
- 2 parking spaces
- Corner unit
Tags
Property features AI
Finance
- Other: No lease restrictions; Property type: Residential (Single Family Residence)
- HOA & community: Senior community; Pets allowed; No HOA/association
Exterior
- Parking: Use GPS for directions
- Utilities: Public water; Public sewer; Cable available; Electricity available
- Home design: Single-family residence; One story; Homestead exempt; Faces west
- Construction: Frame construction; Shingle roof; Crawlspace foundation; Built as a completed property
- Exterior features: Front porch; Rear porch; Private mailbox; Oak trees on the property; Corner lot in city limits, paved road
Interior
- Kitchen: Range; Refrigerator
- Bedrooms: 2 bedrooms
- Flooring: Laminate
- Bathrooms: 1 full bathroom
- Heating & cooling: Central heating; Central air conditioning
- Interior features: Open floor plan with living room/dining room combo; Inside utility room
- Laundry & utility: Laundry located inside
Neighborhood map
What this means for you Summary
Snapshot
- This is a 2-bed/1.0-bath single-family listed at $190k.
Deal economics
- At list price, monthly cash flow is $68 ($821/yr) — positive.
- The deal already cash-flows at list — no discount required.
- To meet the 1% rule (rent ≥ 1% of price), the offer needs to be $151k (20.7% below list).
- Recommended offer: $151k (20.7% below list) — sets the bar for 1% rule.
- Cap rate 6.7% vs local median 3.6% in Sanford — top-decile yield for the area; either an underpriced asset or a hidden risk that comps aren't pricing in. Stress-test before assuming the spread holds.
Location & tenants
- Location reads 73/100 on livability (#316 in FL) — a middle-class / working-renter tenant base. Strengths: cost of living A+, housing A+, health & safety A+; Watch: employment C-, crime F, amenities F.
- Seminole (suburban): math 57% / reading 61% proficiency, ranked #13 of 73 in FL (top 18%) — acceptable for families but not a draw, mixed tenant base, ~2y average lease.
- Zoned schools: Midway Elementary School (math 44% / reading 46%, grade D-, #1,271 of 2,144 statewide, top 60%, 786 students, 86% FRL); Markham Woods Middle School (math 61% / reading 60%, grade B+, #131 of 571 statewide, top 23%, 961 students, 51% FRL); Seminole High School (math 35% / reading 51%, grade F, #255 of 667 statewide, top 39%, 4,036 students, 53% FRL) — zoned schools average 63% FRL vs 38% district-wide (25 pts higher); higher-poverty schools than district average — tighter screening recommended.
- Market conditions: Rents flat; 570 active listings in the ZIP; 22 comparable units currently listed for rent nearby; rentals at typical pace (median 19d on market — plan ~3-4 weeks tenant-placement turnaround); solid renter incomes; 1,979 units permitted in Seminole County in 2024 (1,191 in 5+ unit buildings).
Forward outlook
- Local home prices are declining (-3.0%/yr); year-one equity from $1k of loan paydown is wiped out by about $6k of value loss. Plan a longer hold.
- Seminole County population projected at +24% by 2050 — long-run rental-demand tailwind backs the buy-and-hold thesis.
Negotiation context
- It's been on market 51 days — a 3% lower offer ($184k) is reasonable based on typical stale-listing flexibility.
- 4 sale attempts since 21y ago; this cycle's ask has dropped $20k (10%) from the opening price — seller is motivated, your offer sets the floor, not the list.
- Current owner paid $73k; list at $190k implies a 160% gain — meaningful room to come down on a strong offer.
Risks & watch-outs
- Watch-outs: built in 1926 — expect roof / HVAC / electrical / plumbing capex.
- Climate carrying-cost: severe wind risk, 99% chance of damaging wind over 30y; extreme-heat days projected 7→21/yr by 2055 (HVAC capex compounding) — expect insurance premiums to compound above CPI over the hold.
Questions for the listing agent
- It's been on market 51 days. Have you received any prior offers? Is the seller open to a 21% concession, seller financing, or rate buy-down credit?
- Built in 1926 — when were the roof, HVAC, electrical panel, plumbing, and water heater last replaced?
- Is there a deadline driving the sale (1031 exchange, divorce, estate, relocation)? That informs how much negotiation room exists.
- Schools are B-rated — typically a magnet for longer-tenancy family renters. What's the average tenant stay here, and is there a school-zone premium baked into asking?
- Crime grade is F in this area — have there been break-ins, vandalism, or insurance claims at this property in the last 3 years? What carrier currently insures it and at what premium?
- The area grade is low — what's the realistic commute time and amenity access for the typical tenant pool here? Any planned neighborhood developments (good or bad) we should know about?
- What's the average days-on-market for RENTAL listings here right now (not sales)? A rising rental-DOM trend means longer vacancies and softer asking-rent achievability than the comps imply.
- What's the recent tenant-quality profile in this submarket — average credit score on applications, eviction rate, late-payment / NSF rate, and stable-employment percentage? A property-management company in the area should have these aggregated.
- How much new for-sale + rental construction is in the pipeline within 1–3 miles? Heavy new supply typically softens prices + rents 12–24 months out; constrained supply supports both.
Investment metrics
- 1% rule
- 0.79% ✗
- Cap rate
- 6.73%
- Cash-on-cash
- 1.54%
- DSCR
- 1.07
- GRM
- 10.5
CMA / ARV
- ARV (on-the-fly)
- $215,280
- Comps found
- 12
Show comp detail 12 sales within ~0.75 mi
| Address | Dist | Beds/Ba | Sqft | Sold | Price | $/sf | Match |
|---|---|---|---|---|---|---|---|
| 806 Orange Ave | 0.16mi | 3/1.0 (+1) | 930 (-1%) | 1mo | $210,000 | $226 | 86 |
| 805 Willow Ave | 0.06mi | 2/1.0 | 868 (-7%) | 3mo | $198,000 | $228 | 82 |
| 1500 S Summerlin Ave | 0.52mi | 2/1.0 | 952 (+2%) | 2mo | $148,000 | $155 | 71 |
| 405 Willow Ave | 0.20mi | 2/1.0 | 1,030 (+10%) | 4mo | $254,900 | $247 | 70 |
| 1105 S Locust Ave | 0.27mi | 2/1.0 | 848 (-9%) | 6mo | $100,000 | $118 | 67 |
| 1523 S Mellonville Ave | 0.51mi | 2/1.0 | 912 (-3%) | 10mo | $210,000 | $230 | 64 |
| 409 Orange Ave | 0.22mi | 3/1.0 (+1) | 820 (-12%) | 1mo | $219,000 | $267 | 63 |
| 812 S Locust Ave | 0.22mi | 3/2.0 (+1) | 1,029 (+10%) | 9mo | $253,000 | $246 | 57 |
| 104 W 10th St | 0.67mi | 3/1.0 (+1) | 892 (-5%) | 1mo | $140,000 | $157 | 55 |
| 328 San Lanta Cir | 0.50mi | 3/2.0 (+1) | 1,064 (+14%) | 4mo | $285,000 | $268 | 42 |
| 1102 S Oak Ave | 0.74mi | 2/1.0 | 830 (-11%) | 8mo | $300,000 | $361 | 40 |
| 814 Rosalia Dr | 0.57mi | 3/1.0 (+1) | 804 (-14%) | 6mo | $169,900 | $211 | 40 |
Match score weights: distance 35% · size 25% · config 20% · recency 20%. Top-matched comps best support the ARV.
Projected returns pro-forma
-3.0% appreciation · 0.38% rent growth · sell at horizon
- IRR
- -16.5%
- Equity multiple
- 0.43×
- Total profit
- $-30,393
- Equity at exit
- $28,330
- IRR
- -13.0%
- Equity multiple
- 0.32×
- Total profit
- $-36,304
- Equity at exit
- $16,428
Cash invested: $53,200 (down + closing). Projections, not guarantees.
Landlord ↔ Tenant lean methodology
- Overall (STATE)
- 87 Strongly Landlord-Friendly
- State Florida
- 87 Strongly Landlord-Friendly · R+3
- County
- — inherits STATE
- City
- — inherits STATE
ZIP-level market 32771
- Rents YoY
- 0.4%
- Active inventory
- 570
- Price-to-rent
- 10.5×
Monthly cashflow live
- Estimated rent
- $1,506 high interval (Pro) →
- Mortgage (P&I)
- −$996
- Tax from tax record
- −$46 /mo · $549/yr
- Insurance
- −$79
- HOA
- −$0
- Lot rent
- −$0
- Vacancy / Maint / Mgmt
- −$316
- Net cashflow
- $68
Break-even live
Sensitivity live
| Price | -10% $176 | -5% $122 | +0% $68 | +5% $15 | +10% $-39 |
|---|---|---|---|---|---|
| Rent | -10% $-51 | -5% $9 | +0% $68 | +5% $128 | +10% $187 |
| Rate | -1.0pp $164 | -0.5pp $117 | base $68 | +0.5pp $19 | +1.0pp $-31 |
UW: 25.0% down · 7.5% · 30yr · 1.5% tax · 5.0% vac · 8.0% maint · 8.0% mgmt
Financing live
Cash to close
- Down payment
- $47,500
- Closing costs
- $5,700
- Reserves months
- —
- Total cash needed
- —
Loan-product check · same deal, 3 products live
Conventional
25% down · 7.5% · 30yr
- Down + closing
- —
- Monthly P&I
- —
- Monthly cashflow
- —
- DSCR
- —
- Eligible?
- —
Personal DTI + credit; lowest rate.
DSCR
20% down · 8.5% · 30yr
- Down + closing
- —
- Monthly P&I
- —
- Monthly cashflow
- —
- DSCR
- —
- Eligible?
- —
No personal income docs; deal must DSCR.
Hard money
10% down · 12.0% · 12mo
- Down + closing
- —
- Monthly P&I
- —
- Monthly cashflow
- —
- DSCR
- —
- Eligible?
- —
Short-term bridge; refi at stabilization.
Rent comps 22 comps
| Address | Beds | Baths | Sqft | Rent | $/sqft | DOM | Units | Dist |
|---|---|---|---|---|---|---|---|---|
| 918 E 10th St Unit 918A Sanford, FL | 2.0 | 1.0 | 745 | $945 | $1.27 | 26d | 1 | 0.14mi |
| 1111 Willow Ave Sanford, FL | 2.0 | 1.0 | 648 | $1,050 | $1.62 | 26d | 1 | 0.23mi |
| 619 San Lanta Cir Sanford, FL | 3.0 | 2.0 | 1092 | $1,796 | $1.64 | 17d | 1 | 0.31mi |
| 1005 Pine Ave Unit A Sanford, FL | 1.0 | 1.0 | 636 | $850 | $1.34 | 7d | 1 | 0.36mi |
| 912 Pine Ave Sanford, FL | 2.0 | 1.0 | 1122 | $1,595 | $1.42 | 26d | 1 | 0.38mi |
| 517 E 5th St Unit B Sanford, FL | 2.0 | 1.0 | 540 | $1,050 | $1.94 | 26d | 1 | 0.43mi |
| 711 E 1st St Sanford, FL | 1.0 | 1.0 | 720 | $1,525 | $2.12 | 7d | 2 | 0.50mi |
| 711 E 1st St Unit 15w Sanford, FL | 1.0 | 1.0 | 720 | $1,525 | $2.12 | 17d | 1 | 0.50mi |
| 711 E 1st St Sanford, FL | 1.0 | 1.0 | 720 | $1,525 | $2.12 | 18d | 1 | 0.50mi |
| 838 Rosalia Dr Sanford, FL | 2.0 | 1.0 | 873 | $1,600 | $1.83 | 15d | 1 | 0.54mi |
| 404 E 14th St Unit 202 Sanford, FL | 1.0 | 1.0 | 600 | $1,095 | $1.82 | 18d | 1 | 0.55mi |
| 201 Sanford Ave Sanford, FL | 1.0 | 1.0 | 779 | $1,795 | $2.30 | 5d | 1 | 0.61mi |
| 612 S Park Ave Unit 4 Sanford, FL | 2.0 | 1.0 | 720 | $1,295 | $1.80 | 24d | 1 | 0.69mi |
| 1711 Roseberry Ln Sanford, FL | 3.0 | 2.0 | 984 | $2,150 | $2.18 | 7d | 1 | 0.86mi |
| 131 Langston Dr Sanford, FL | 3.0 | 1.5 | 1082 | $1,697 | $1.57 | 22d | 1 | 1.01mi |
| 101 E 21st St Sanford, FL | 3.0 | 2.0 | 896 | $2,500 | $2.79 | 26d | 1 | 1.06mi |
| 401 W Seminole Blvd Sanford, FL | 1.0–2.0 | 1.0–2.0 | 818 | $1,824 | $2.23 | 4d | 12 | 1.12mi |
| 2420 Daffadil Ter Sanford, FL | 3.0 | 2.0 | 1097 | $1,850 | $1.69 | 20d | 1 | 1.26mi |
| 1001 W 8th St Unit 1 Sanford, FL | 3.0 | 1.0 | 1075 | $2,250 | $2.09 | 24d | 1 | 1.28mi |
| 1013 W 3rd St Unit B Sanford, FL | 2.0 | 1.0 | 800 | $1,195 | $1.49 | 17d | 1 | 1.34mi |
| 2628 Daffadil Ter Sanford, FL | 3.0 | 2.0 | 1099 | $1,995 | $1.82 | 7d | 1 | 1.35mi |
| 2561 Daffadil Ter Sanford, FL | 3.0 | 2.0 | 1099 | $1,900 | $1.73 | 26d | 1 | 1.38mi |
Listing history 13 events
-
2026-05-24price $199,900
-
2026-05-06price $205,000
-
2026-04-07$210,000 Active
-
2016-04-26soldstatus $73,000
-
2016-04-25soldstatus $73,000 Sold 366-char remark
Show marketing remark (366 chars)
Must see this move in ready home priced for either a new homeowner or investor. The open floor plan is absolutely amazing for a home priced so low. New Central A/C has warranty transferable to purchaser. Call your Realtor for a personal showing today before it is gone! Owner will entertain both Cash and Conventionally financed offers from bank qualified buyers.
-
2016-02-24historical Active with Contract 366-char remark
Show marketing remark (366 chars)
Must see this move in ready home priced for either a new homeowner or investor. The open floor plan is absolutely amazing for a home priced so low. New Central A/C has warranty transferable to purchaser. Call your Realtor for a personal showing today before it is gone! Owner will entertain both Cash and Conventionally financed offers from bank qualified buyers.
-
2016-02-04$75,000 Active 366-char remark
Show marketing remark (366 chars)
Must see this move in ready home priced for either a new homeowner or investor. The open floor plan is absolutely amazing for a home priced so low. New Central A/C has warranty transferable to purchaser. Call your Realtor for a personal showing today before it is gone! Owner will entertain both Cash and Conventionally financed offers from bank qualified buyers.
-
2008-11-19historical
-
2008-10-01$119,000
-
2005-08-22soldstatus $85,700
-
2005-08-12soldstatus $85,674
-
2005-05-29$84,900
-
1990-07-01soldstatus $18,000
ⓘ Source: listings_history table (triggers on properties + properties_extension) + one-shot
backfill from property_details.listing_events for pre-trigger history.
Tax reassessment forecast FL · Resets to sale price
- Current annual tax
- $549 · $46/mo
- Projected year-2 tax
- $1,577 · $131/mo
- Expected delta
- +$1,028/yr (+$86/mo · 187.4%)
ⓘ Screening estimate from a state-policy table — verify with the county assessor before closing.
Climate risk First Street
- Flood 1/10 Low FEMA zone X (unshaded) · 0% chance over 30 yrs
- Wildfire 1/10 Low
- Heat 8/10 Severe 7 d/yr ≥107°F today · 21 d/yr by 30 yrs out
- Wind 9/10 Extreme 99% chance of damaging wind over 30 yrs
- Air quality 2/10 Low 1 unhealthy d/yr today · 1 by 30 yrs out
Nearby sold comps map
Loading sold comps map…
Walkable amenities ~0.75 mi
Loading nearby amenities…
Taxation est. · year 1
- Rental income
- $18,072
- − Mortgage interest
- −$10,643
- − Property taxes
- −$549
- − Insurance
- −$950
- − Repairs & maintenance
- −$1,446
- − Management
- −$1,446
- − Depreciation
- −$5,527
- Taxable loss
- −$2,489
- Est. tax savings @ 24.0%
- +$597
- After-tax cash flow
- $1,419/yr
For passive investors: Depreciation is non-cash, so a rental often shows a tax loss while cash-flowing — sheltering income. Rental losses are passive: they offset passive income freely, and up to $25,000/yr can offset ordinary (W-2) income if you actively participate and your MAGI is under $100k (phasing out to $0 by $150k); unused losses carry forward. On sale, claimed depreciation is recaptured at up to 25%, and gains may owe capital-gains tax (a 1031 exchange can defer both). Figures are a year-1 estimate at your 24.0% rate — not tax advice; consult a CPA.
Schools (NCES district)
- District
- Seminole
- NCES district ID
- 1201710
- Math proficiency
- 57% ▼ -7.00%
- Reading proficiency
- 61% ▼ -1.00%
- Median HH income
- $58,478
- Composite
- 51.05/100
- National rank
- #1769
- State rank
- #13 of 73 in FL
Livability — Sanford
- Score
- 73/100
- State rank
- #316
- US rank
- #5359
Category grades
Schools grade is shown separately in the Schools card above.
Census & demographics
- Census place
- Sanford, FL
- County
- Seminole County · 436,154 people
- City population
- 96,638
- Metro
- Orlando-Kissimmee-Sanford, FL
- Population (ZIP)
- 62,606
- Household income
- $77,868
- Rent vs Own
- Severe rent burden
- 2645.0
Population outlook (Seminole County) Hauer SSP2
- Today (2025)
- 515,494 people
- By 2030
- 545,713 · +5.9%
- By 2040
- 598,068 · +16.0%
- By 2050
- 640,663 · +24.3%
- By 2075
- 724,461 · +40.5%
- By 2100
- 755,530 · +46.6%
Race, ethnicity, and origin ACS 2023
- Neighborhood character
- Diverse neighborhood (Simpson 0.70)
- Race & ethnicity
- White 43% Black 24% Hispanic / Latino 23% Two or more races 13% Asian 7%
- Hispanic origin (detail)
- Mexican 2% Puerto Rican 7% Cuban 2% Dominican 2%
- Common ancestry
- Romanian 2% Slovak 1% Italian 1%
- Foreign-born
- 18% · Canada, Jamaica, China
- Languages at home
- 76% English-only · Spanish 15% Other Indo-European 3% Other Asian/Pacific 1%
Political lean MEDSL · Seminole
- 2024 margin
- Toss-up / Even · D 47.6% · R 51.1% · Other 1.3%
- 2008→2024 swing
- -0.8pp no change · 2008: -2.8pp · 2024: -3.5pp
- All cycles
- 2024: R+3.5 2020: D+2.8 2016: R+1.6 2012: R+6.5 2008: R+2.8
Not yet ingested
- Civics
- —
Market trends
- HPI YoY
- ▼ -281.27%
- Current HPI
- 299.2738
- Rent YoY
- ▲ 0.38%
- Metro
- Orlando-Kissimmee-Sanford, FL
- State GDP YoY
- ▲ 3.28%
- F500 in state
- 36
Industry mix (Fortune 500 HQ in FL)
| Industry | F500 HQs | Revenue |
|---|---|---|
| Industrial Technology | 2 | $29B |
|
||
| Insurance | 2 | $17B |
|
||
| Retail | 1 | $60B |
|
||
| Technology Distribution | 1 | $58B |
|
||
| Homebuilding | 1 | $35B |
|
||
| Technology Manufacturing | 1 | $35B |
|
||
Price history
+1010.6% since first listed13 events — show timeline
- 2026-05-24 Price Changed $199,900 Stellar MLS as Distributed by MLS Grid
- 2026-05-06 Price Changed $205,000 Stellar MLS as Distributed by MLS Grid
- 2026-04-07 Listed $210,000 Stellar MLS as Distributed by MLS Grid
- 2016-04-26 Sold (Public Records) $73,000 Public Records
- 2016-04-25 Sold (MLS) $73,000 Stellar MLS as Distributed by MLS Grid
- 2016-02-24 Contingent — Stellar MLS as Distributed by MLS Grid
- 2016-02-04 Listed $75,000 Stellar MLS as Distributed by MLS Grid
- 2008-11-19 Listing Removed — Stellar MLS as Distributed by MLS Grid
- 2008-10-01 Listed $119,000 Stellar MLS as Distributed by MLS Grid
- 2005-08-22 Sold (Public Records) $85,700 Public Records
- 2005-08-12 Sold (MLS) $85,674 Stellar MLS as Distributed by MLS Grid
- 2005-05-29 Listed $84,900 Stellar MLS as Distributed by MLS Grid
- 1990-07-01 Sold (Public Records) $18,000 Public Records
Property tax history
+6.7%/yrLatest (2025): $549 · +4.0% YoY. Source: county tax records.
Cash-flow waterfall
monthlySold comps — $/sqft
last 12 mo · ≤1 miLoading sold comps…