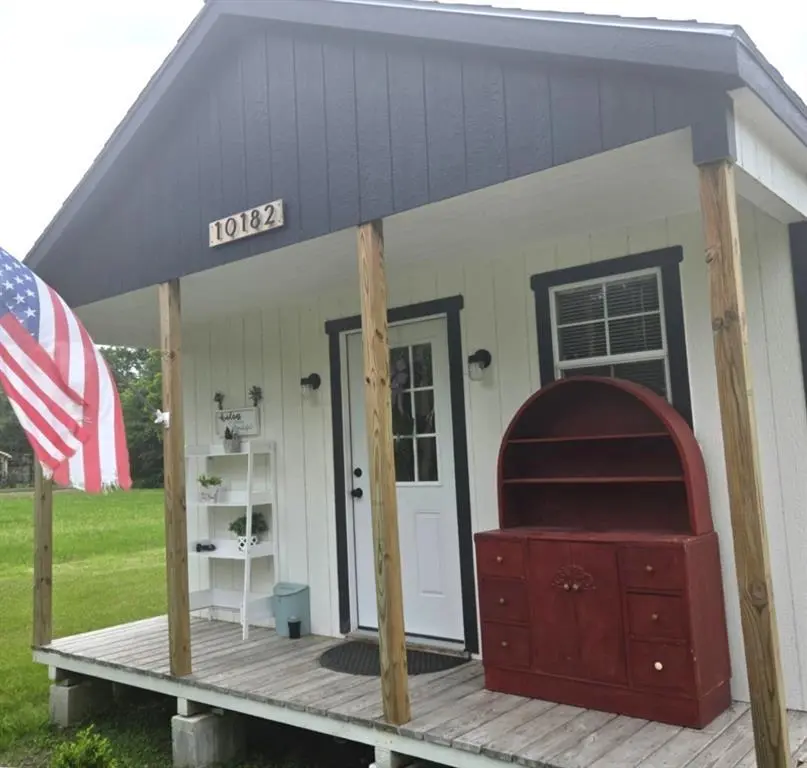
10182 Northview Dr · Wills Point, TX
Flood risk 1/10 · Minimal
- FEMA flood zone
- X (unshaded)
- Chance of flooding over 30 yrs
- 0.0%
- Est. flood insurance / yr
- $507 – $1,088
Fire risk 4/10 · Minor
- Est. fire insurance / yr
- $1,222 – $2,270
Heat risk 7/10 · Major
- Hot days now (above 110°F)
- 7 days/yr
- Hot days in 30 yrs
- 24 days/yr
Wind risk 6/10 · Moderate
- Chance of severe wind over 30 yrs
- 27.0%
Air-quality risk 2/10 · Minimal
- Unhealthy air days now
- 0 days/yr
- Unhealthy air days in 30 yrs
- 1 days/yr
Risk factors via First Street. Map © Google.
Why this score? — see what drove the B- grade
The composite is a weighted blend of 9 inputs, each scored 0–100. Each bar is that input's sub-score; the figure is the points it added to the 100-point composite (weight × sub-score).
- Cash flow +30.0/30.0
- 1% rule +10.0/10.0
- DSCR +10.0/10.0
- ARV discount +7.5/15.0
- Livability +3.0/5.0
- Schools +2.6/10.0
- Rent growth +2.5/5.0
- Condition / age +2.5/5.0
- Appreciation +0.0/10.0
$60,000
🖨 Deal sheet 📄 Offer letter ✓ Due diligence
Listing remarks
Charming 1-story home with loft in a peaceful lake community in Wills Point, just 30 minutes from Dallas! This cozy 500 sq. ft. home sits on a large lot and features a spacious front porch perfect for relaxing mornings or evening sunsets. Inside, you’ll find an open kitchen with an eat-in dining area, a full bathroom with both a shower and tub, and a large closet for extra storage. The loft provides an additional sleeping area, making great use of the space for guests or a private retreat. Enjoy quiet lake community living with easy access to the city, all in a comfortable and inviting setting
Key facts
- Eat-in dining area
- Lake community
- Large closet
Tags
Property features AI
Finance
- Other: Community amenities include boat ramp, club house, fishing, park, and playground
- HOA & community: Mandatory association; Annual association fee of $124 (includes full use of facilities); HOA managed by Panarama Land Owners
Exterior
- Parking: No garage / no covered parking
- Utilities: Aerobic septic; Co-op electric
- Home design: Single family residence; One level
- Construction: Composition roof; Slab foundation; Built in 2025; Construction materials: Unknown
- Exterior features: Covered porch(es); Storage; Other exterior storage structure; Cleared, interior lot
Interior
- Kitchen: Microwave
- Bedrooms: 1 bedroom (Primary Bedroom on level 1)
- Flooring: Luxury vinyl plank
- Bathrooms: 1 full bathroom
- Interior features: Cable TV available; High-speed internet available; Eat-in kitchen; Kitchen island; Walk-in closet(s)
- Laundry & utility: Washer hookup; Electric dryer hookup
Neighborhood map
What this means for you Summary
Snapshot
- This is a 1-bed/1.0-bath single-family listed at $60k.
Deal economics
- At list price, monthly cash flow is $452 ($5k/yr) — positive.
- The deal already cash-flows at list — no discount required.
- Meets the 1% rule at list price ($1k rent vs $60k).
- Cap rate 15.3% vs local median 2.4% in Wills Point — top-decile yield for the area; either an underpriced asset or a hidden risk that comps aren't pricing in. Stress-test before assuming the spread holds.
Location & tenants
- Location reads 59/100 on livability (#1,174 in TX) — a working-class tenant base; expect higher turnover. Strengths: crime A+, cost of living A+, housing A+; Watch: amenities F, commute F, employment F.
- Quinlan ISD (rural): math 27% / reading 34% proficiency, ranked #610 of 826 in TX (top 74%) — families likely to look elsewhere, expect single-tenant / working-renter base with shorter leases.
- Zoned schools: D C Cannon El (765 students, 81% FRL) — zoned schools average 81% FRL vs 60% district-wide (22 pts higher); higher-poverty schools than district average — tighter screening recommended.
- Market conditions: 284 active listings in the ZIP; 1,289 units permitted in Hunt County in 2024 (527 in 5+ unit buildings).
Forward outlook
- Local home prices are declining (-3.0%/yr); year-one equity from $415 of loan paydown is wiped out by about $2k of value loss. Plan a longer hold.
- Hunt County population projected at +15% by 2050 — modest demand growth; plan on rents tracking national, not racing it.
- At projected returns (-3.0% appreciation + 3.0% rent growth), your $17k cash investment doubles in ~4 years — after that, you're playing with house money.
Negotiation context
- Only 13 days on market — expect competitive offers; lowballing is unlikely to land.
- Current owner paid $5k; list at $60k implies a 1204% gain — meaningful room to come down on a strong offer.
Risks & watch-outs
- Climate carrying-cost: major wind risk, 27% chance of damaging wind over 30y; extreme-heat days projected 7→24/yr by 2055 (HVAC capex compounding) — expect insurance premiums to compound above CPI over the hold.
Questions for the listing agent
- What does the HOA fee cover, when was the last increase, and are there any pending special assessments or reserve-fund shortfalls?
- Is there a deadline driving the sale (1031 exchange, divorce, estate, relocation)? That informs how much negotiation room exists.
- Schools are D-rated, which usually means shorter tenancies and higher turnover. Who's the typical renter profile here, and what's been the actual vacancy rate?
- What's the average days-on-market for RENTAL listings here right now (not sales)? A rising rental-DOM trend means longer vacancies and softer asking-rent achievability than the comps imply.
- What's the recent tenant-quality profile in this submarket — average credit score on applications, eviction rate, late-payment / NSF rate, and stable-employment percentage? A property-management company in the area should have these aggregated.
- How much new for-sale + rental construction is in the pipeline within 1–3 miles? Heavy new supply typically softens prices + rents 12–24 months out; constrained supply supports both.
Investment metrics
- 1% rule
- 1.86% ✓
- Cap rate
- 15.33%
- Cash-on-cash
- 32.27%
- DSCR
- 2.44
- GRM
- 4.5
CMA / ARV
No comps found within radius.
Projected returns pro-forma
-3.0% appreciation · 3.0% rent growth · sell at horizon
- IRR
- 27.3%
- Equity multiple
- 2.14×
- Total profit
- $19,079
- Equity at exit
- $8,946
- IRR
- 34.9%
- Equity multiple
- 4.20×
- Total profit
- $53,776
- Equity at exit
- $5,188
Cash invested: $16,800 (down + closing). Projections, not guarantees.
Landlord ↔ Tenant lean methodology
- Overall (STATE)
- 87 Strongly Landlord-Friendly
- State Texas
- 87 Strongly Landlord-Friendly · R+5
- County
- — inherits STATE
- City
- — inherits STATE
ZIP-level market 75169
- Home prices YoY
- -15.4%
- Active inventory
- 284
- Price-to-rent
- 4.5×
Monthly cashflow live
- Estimated rent
- $1,118 medium interval (Pro) →
- Mortgage (P&I)
- −$315
- Tax from tax record
- −$82 /mo · $979/yr
- Insurance
- −$25
- HOA
- −$10
- Vacancy / Maint / Mgmt
- −$235
- Net cashflow
- $452
Break-even live
UW: 25.0% down · 7.5% · 30yr · 1.5% tax · 5.0% vac · 8.0% maint · 8.0% mgmt
Financing live
Cash to close
- Down payment
- $15,000
- Closing costs
- $1,800
- Reserves months
- —
- Total cash needed
- —
Loan-product check · same deal, 3 products live
Conventional
25% down · 7.5% · 30yr
- Down + closing
- —
- Monthly P&I
- —
- Monthly cashflow
- —
- DSCR
- —
- Eligible?
- —
Personal DTI + credit; lowest rate.
DSCR
20% down · 8.5% · 30yr
- Down + closing
- —
- Monthly P&I
- —
- Monthly cashflow
- —
- DSCR
- —
- Eligible?
- —
No personal income docs; deal must DSCR.
Hard money
10% down · 12.0% · 12mo
- Down + closing
- —
- Monthly P&I
- —
- Monthly cashflow
- —
- DSCR
- —
- Eligible?
- —
Short-term bridge; refi at stabilization.
HOA detail
- Monthly dues
- $10 · $120/yr
Listing history 11 events
-
2026-06-09days on market $60,000 Active 13 DOM
-
2026-06-08days on market $60,000 Active 12 DOM
-
2026-06-07pricedays on market $60,000 Active 11 DOM
-
2026-06-04days on market $100,000 Active 8 DOM
-
2026-06-03days on market $100,000 Active 7 DOM
-
2026-06-02days on market $100,000 Active 6 DOM
-
2026-06-01days on market $100,000 Active 5 DOM
-
2026-05-31days on market $100,000 Active 4 DOM
-
2026-05-21$100,000 Active
-
2024-06-18soldstatus
-
2019-03-06soldstatus $4,600
ⓘ Source: listings_history table (triggers on properties + properties_extension) + one-shot
backfill from property_details.listing_events for pre-trigger history.
Tax reassessment forecast TX · Resets to sale price
- Current annual tax
- $979 · $82/mo
- Projected year-2 tax
- $1,098 · $92/mo
- Expected delta
- +$119/yr (+$10/mo · 12.1%)
ⓘ Screening estimate from a state-policy table — verify with the county assessor before closing.
Climate risk First Street
- Flood 1/10 Low FEMA zone X (unshaded) · 0% chance over 30 yrs
- Wildfire 4/10 Moderate
- Heat 7/10 Severe 7 d/yr ≥110°F today · 24 d/yr by 30 yrs out
- Wind 6/10 Major 27% chance of damaging wind over 30 yrs
- Air quality 2/10 Low 0 unhealthy d/yr today · 1 by 30 yrs out
Nearby sold comps map
Loading sold comps map…
Walkable amenities ~0.75 mi
Loading nearby amenities…
Taxation est. · year 1
- Rental income
- $13,413
- − Mortgage interest
- −$3,361
- − Property taxes
- −$979
- − Insurance
- −$300
- − Repairs & maintenance
- −$1,073
- − Management
- −$1,073
- − HOA
- −$120
- − Depreciation
- −$1,745
- Taxable income
- $4,761
- Est. tax owed @ 24.0%
- −$1,143
- After-tax cash flow
- $4,279/yr
For passive investors: Depreciation is non-cash, so a rental often shows a tax loss while cash-flowing — sheltering income. Rental losses are passive: they offset passive income freely, and up to $25,000/yr can offset ordinary (W-2) income if you actively participate and your MAGI is under $100k (phasing out to $0 by $150k); unused losses carry forward. On sale, claimed depreciation is recaptured at up to 25%, and gains may owe capital-gains tax (a 1031 exchange can defer both). Figures are a year-1 estimate at your 24.0% rate — not tax advice; consult a CPA.
Schools (NCES district)
- District
- Quinlan ISD
- NCES district ID
- 4836240
- Math proficiency
- 27% ▼ -10.00%
- Reading proficiency
- 34% ▼ -2.00%
- Median HH income
- $45,461
- Composite
- 26.16/100
- National rank
- #7271
- State rank
- #610 of 826 in TX
Livability — Wills Point
- Score
- 59/100
- State rank
- #1174
- US rank
- #20542
Category grades
Schools grade is shown separately in the Schools card above.
Census & demographics
- City population
- 15,744
- Population (ZIP)
- 15,744
Population outlook (Hunt County) Hauer SSP2
- Today (2025)
- 97,090 people
- By 2030
- 100,452 · +3.5%
- By 2040
- 106,544 · +9.7%
- By 2050
- 111,218 · +14.6%
- By 2075
- 121,695 · +25.3%
- By 2100
- 123,683 · +27.4%
Race, ethnicity, and origin ACS 2023
- Neighborhood character
- Predominantly White (78%)
- Race & ethnicity
- White 78% Hispanic / Latino 15% Two or more races 7% Black 4%
- Hispanic origin (detail)
- Mexican 15%
- Common ancestry
- Slovak 2% Italian 1% Lithuanian 1%
- Foreign-born
- 4% · Canada
- Languages at home
- 92% English-only · Spanish 8%
Political lean MEDSL · Hunt
- 2024 margin
- Solid R (+55.5) · D 21.9% · R 77.4%
- 2008→2024 swing
- -14.9pp toward R · 2008: -40.6pp · 2024: -55.5pp
- All cycles
- 2024: R+55.5 2020: R+52.5 2016: R+56.3 2012: R+51.2 2008: R+40.6
Not yet ingested
- Civics
- —
Market trends
- HPI YoY
- ▼ -45.68%
- Current HPI
- 250.2271
- Rent YoY
- —
- Metro
- —
- State GDP YoY
- ▲ 3.95%
- F500 in state
- 110
Industry mix (Fortune 500 HQ in TX)
| Industry | F500 HQs | Revenue |
|---|---|---|
| Energy | 16 | $1,198B |
|
||
| Technology | 5 | $198B |
|
||
| Engineering / Construction | 4 | $72B |
|
||
| Energy Services | 3 | $60B |
|
||
| Utilities | 3 | $41B |
|
||
| Healthcare | 2 | $330B |
|
||
Price history
+2073.9% since first listed3 events — show timeline
- 2026-05-21 Listed $100,000 NTREIS
- 2024-06-18 Sold (Public Records) — Public Records
- 2019-03-06 Sold (Public Records) $4,600 Public Records
Property tax history
+18.1%/yrLatest (2025): $979 · +190.8% YoY. Source: county tax records.
Cash-flow waterfall
monthlySold comps — $/sqft
last 12 mo · ≤1 miLoading sold comps…