 Multi-family
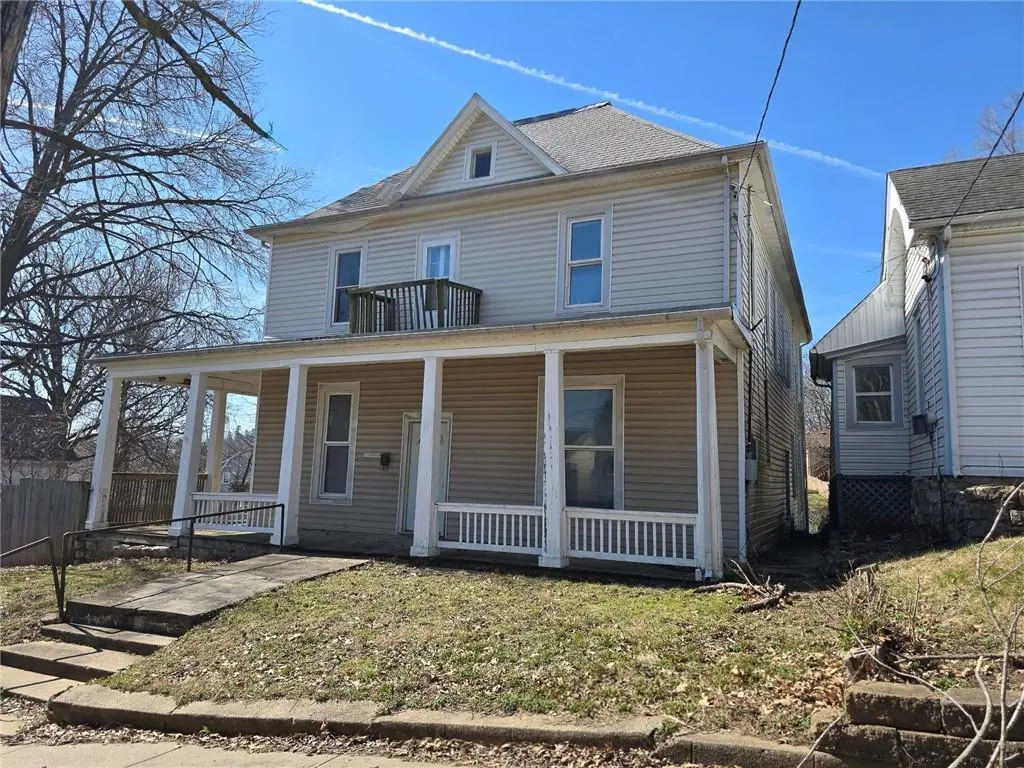
715 Magnolia Ave · Excelsior Springs, MO
Flood risk 1/10 · Minimal
- FEMA flood zone
- X (unshaded)
- Chance of flooding over 30 yrs
- 0.0%
- Est. flood insurance / yr
- $473 – $860
Fire risk 2/10 · Minimal
- Est. fire insurance / yr
- $1,054 – $1,958
Heat risk 4/10 · Minor
- Hot days now (above 107°F)
- 7 days/yr
- Hot days in 30 yrs
- 16 days/yr
Wind risk 2/10 · Minimal
- Chance of severe wind over 30 yrs
- —
Air-quality risk 3/10 · Minor
- Unhealthy air days now
- 3 days/yr
- Unhealthy air days in 30 yrs
- 3 days/yr
Risk factors via First Street. Map © Google.
Why this score? — see what drove the B- grade
The composite is a weighted blend of 9 inputs, each scored 0–100. Each bar is that input's sub-score; the figure is the points it added to the 100-point composite (weight × sub-score).
- Cash flow +30.0/30.0
- 1% rule +10.0/10.0
- DSCR +10.0/10.0
- ARV discount +7.5/15.0
- Livability +3.4/5.0
- Schools +2.9/10.0
- Rent growth +2.5/5.0
- Condition / age +2.5/5.0
- Appreciation +0.0/10.0
$67,500
🖨 Deal sheet 📄 Offer letter ✓ Due diligence
Multi-family units
County records classify this as Multi-Family (5+ Unit). Listing-text estimate: 1 unit. estimate disagrees with records
5+ unit building — per-unit beds/baths from public records are typically unavailable; the breakdown below (if shown) is an estimate from the listing text.
Listing remarks MLS
Investor special with serious upside. This former 4-unit multiplex has been completely gutted and is ready for your vision and finishing touches. With major systems already addressed; HVAC (2016) and roof (2018), you can focus on bringing this property back to life and maximizing its income potential. Situated on a large lot with off-street parking, the property offers flexibility for a multi-unit rebuild, rental portfolio addition, or potential single-family conversion. A structural inspection is already in hand, giving you added confidence as you plan your next steps. This is your chance to restore a once-beautiful home and turn it into a high-performing asset in Excelsior Springs. Opportunities like this—where the heavy demo work is already done—don’t come around often. Bring your contractor, your vision, and move quickly.
Key facts
- Multi-unit rebuild
- Large lot
- Off-street parking
Tags
Neighborhood map
What this means for you Summary
Snapshot
- This is a 4-bed/4.0-bath multifamily listed at $68k.
Deal economics
- At list price, monthly cash flow is $850 ($10k/yr) — positive.
- The deal already cash-flows at list — no discount required.
- Meets the 1% rule at list price ($2k rent vs $68k).
- Recommended offer: $61k (9.0% below list) — sets the bar for market timing.
- Cap rate 21.4% vs local median 4.6% in Excelsior Springs — top-decile yield for the area; either an underpriced asset or a hidden risk that comps aren't pricing in. Stress-test before assuming the spread holds.
Location & tenants
- Location reads 67/100 on livability (#228 in MO) — a middle-class / working-renter tenant base. Strengths: cost of living A+, housing A+; Watch: schools D+, crime D+, amenities F.
- Excelsior Springs 40 (town): math 27% / reading 40% proficiency, ranked #225 of 324 in MO (top 69%) — families likely to look elsewhere, expect single-tenant / working-renter base with shorter leases.
- Market conditions: 122 active listings in the ZIP; 3 comparable units currently listed for rent nearby; rentals lingering (median 44d on market — plan ~5-8 weeks vacancy on turnover, expect pricing pressure); 67% of comp listings sitting > 30 days — soft ceiling on asking rent; solid renter incomes; 341 units permitted in Clay County in 2024 (40 in 5+ unit buildings).
Forward outlook
- Local home prices are declining (-3.0%/yr); year-one equity from $467 of loan paydown is wiped out by about $2k of value loss. Plan a longer hold.
- Clay County population projected at +24% by 2050 — long-run rental-demand tailwind backs the buy-and-hold thesis.
- At projected returns (-3.0% appreciation + 3.0% rent growth), your $19k cash investment doubles in ~3 years — after that, you're playing with house money.
Negotiation context
- It's been on market 91 days — a 9% lower offer ($61k) is reasonable based on typical stale-listing flexibility.
- 10 sale attempts since 29y ago with the ask held roughly flat each time — persistent listings suggest the price (not the market) is what's stuck; bring a comps-based counter.
Risks & watch-outs
- Watch-outs: property tax is 3.2% of price; built in 1900 — expect roof / HVAC / electrical / plumbing capex.
Questions for the listing agent
- It's been on market 91 days. Have you received any prior offers? Is the seller open to a 9% concession, seller financing, or rate buy-down credit?
- Built in 1900 — when were the roof, HVAC, electrical panel, plumbing, and water heater last replaced?
- Property tax is high relative to price — has the assessment been appealed recently, and will the sale trigger a re-assessment?
- Why hasn't it sold? Are there any deal-killer items the seller is aware of (foundation, flood, title, zoning, code violations)?
- Is there a deadline driving the sale (1031 exchange, divorce, estate, relocation)? That informs how much negotiation room exists.
- Schools are D-rated, which usually means shorter tenancies and higher turnover. Who's the typical renter profile here, and what's been the actual vacancy rate?
- Crime grade is D in this area — have there been break-ins, vandalism, or insurance claims at this property in the last 3 years? What carrier currently insures it and at what premium?
- What's the average days-on-market for RENTAL listings here right now (not sales)? A rising rental-DOM trend means longer vacancies and softer asking-rent achievability than the comps imply.
- What's the recent tenant-quality profile in this submarket — average credit score on applications, eviction rate, late-payment / NSF rate, and stable-employment percentage? A property-management company in the area should have these aggregated.
- How much new apartment / multifamily construction is in the pipeline within 1–3 miles? Heavy new supply (>2% of stock underway) typically softens rents 12–24 months out; light construction supports rent growth.
Investment metrics
- 1% rule
- 2.65% ✓
- Cap rate
- 21.41%
- Cash-on-cash
- 53.98%
- DSCR
- 3.40
- GRM
- 3.1
CMA / ARV
- ARV (median comp)
- $182,975
- List price
- $67,500
- Delta
- -63.11%
- Verdict
- UNDERPRICED
- Comps
- 20 within 1.0 mi
Show comp detail 2 sales within ~0.75 mi
| Address | Dist | Beds/Ba | Sqft | Sold | Price | $/sf | Match |
|---|---|---|---|---|---|---|---|
| 508 Caldwell Ave | 0.40mi | 5/2.0 (+1) | — | 20mo | $199,000 | — | 39 |
| 1001/1003 Frontier St | 0.69mi | 4/2.0 | 3,600 | 18mo | $350,000 | $97 | 32 |
Match score weights: distance 35% · size 25% · config 20% · recency 20%. Top-matched comps best support the ARV.
Projected returns pro-forma
-3.0% appreciation · 3.0% rent growth · sell at horizon
- IRR
- 52.2%
- Equity multiple
- 3.29×
- Total profit
- $43,302
- Equity at exit
- $10,064
- IRR
- 57.5%
- Equity multiple
- 6.70×
- Total profit
- $107,792
- Equity at exit
- $5,836
Cash invested: $18,900 (down + closing). Projections, not guarantees.
Landlord ↔ Tenant lean methodology
- Overall (STATE)
- 81 Strongly Landlord-Friendly
- State Missouri
- 81 Strongly Landlord-Friendly · R+10
- County
- — inherits STATE
- City
- — inherits STATE
ZIP-level market 64024
- Home prices YoY
- -15.3%
- Active inventory
- 122
- Price-to-rent
- 3.1×
Monthly cashflow live
- Estimated rent
- $1,791 medium interval (Pro) →
- Mortgage (P&I)
- −$354
- Tax from tax record
- −$182 /mo · $2,186/yr
- Insurance
- −$28
- HOA
- −$0
- Vacancy / Maint / Mgmt
- −$376
- Net cashflow
- $850
Break-even live
UW: 25.0% down · 7.5% · 30yr · 1.5% tax · 5.0% vac · 8.0% maint · 8.0% mgmt
Financing live
Cash to close
- Down payment
- $16,875
- Closing costs
- $2,025
- Reserves months
- —
- Total cash needed
- —
Loan-product check · same deal, 3 products live
Conventional
25% down · 7.5% · 30yr
- Down + closing
- —
- Monthly P&I
- —
- Monthly cashflow
- —
- DSCR
- —
- Eligible?
- —
Personal DTI + credit; lowest rate.
DSCR
20% down · 8.5% · 30yr
- Down + closing
- —
- Monthly P&I
- —
- Monthly cashflow
- —
- DSCR
- —
- Eligible?
- —
No personal income docs; deal must DSCR.
Hard money
10% down · 12.0% · 12mo
- Down + closing
- —
- Monthly P&I
- —
- Monthly cashflow
- —
- DSCR
- —
- Eligible?
- —
Short-term bridge; refi at stabilization.
Rent comps 3 comps
| Address | Beds | Baths | Sqft | Rent | $/sqft | DOM | Units | Dist |
|---|---|---|---|---|---|---|---|---|
| 139 S Maple St Excelsior Springs, MO | 3.0 | 2.0 | 1490 | $1,650 | $1.11 | 1d | 1 | 0.11mi |
| 410 N Titus Ave Excelsior Springs, MO | 3.0 | 2.0 | 910 | $1,476 | $1.62 | 43d | 1 | 0.42mi |
| 1904 Wornall Rd Excelsior Springs, MO | 4.0 | 2.0 | 1819 | $1,771 | $0.97 | 43d | 1 | 1.38mi |
Listing history 35 events
-
2026-06-18days on market $67,500 Active 91 DOM
-
2026-06-17days on market $67,500 Active 90 DOM
-
2026-06-16days on market $67,500 Active 89 DOM
-
2026-06-15days on market $67,500 Active 88 DOM
-
2026-06-13days on market $67,500 Active 86 DOM
-
2026-06-13days on market $67,500 Active 85 DOM
-
2026-06-09days on market $67,500 Active 82 DOM
-
2026-06-08days on market $67,500 Active 81 DOM
-
2026-06-07days on market $67,500 Active 80 DOM
-
2026-06-03days on market $67,500 Active 76 DOM
-
2026-06-02days on market $67,500 Active 75 DOM
-
2026-06-01days on market $67,500 Active 74 DOM
-
2026-05-31days on market $67,500 Active 73 DOM
-
2026-03-19$67,500 Active 855-char remark
Show marketing remark (855 chars)
Investor special with serious upside. This former 4-unit multiplex has been completely gutted and is ready for your vision and finishing touches. With major systems already addressed; HVAC (2016) and roof (2018), you can focus on bringing this property back to life and maximizing its income potential. Situated on a large lot with off-street parking, the property offers flexibility for a multi-unit rebuild, rental portfolio addition, or potential single-family conversion. A structural inspection is already in hand, giving you added confidence as you plan your next steps. This is your chance to restore a once-beautiful home and turn it into a high-performing asset in Excelsior Springs. Opportunities like this—where the heavy demo work is already done—don’t come around often. Bring your contractor, your vision, and move quickly.
-
2020-07-26$80,000 Active 273-char remark
Show marketing remark (273 chars)
Investor Special! ARV makes this heavily discounted price more than worth it for the right person who wants to take on the project. This property is being offered as a principal-driven sale for his own account. All bona fide offers will be seriously reviewed and evaluated.
-
2020-01-12historical
-
2019-12-05price $81,000
-
2019-11-04price $87,000
-
2019-10-24$90,000 Active
-
2018-03-09soldstatus Sold
-
2018-02-14historical Contingent - Accepting Backup Offers
-
2017-10-06historical
-
2017-10-05price $59,900
-
2017-10-05status Active
-
2017-10-05status Active
-
2017-07-10status Pending
-
2017-06-25historical
-
2017-03-28$69,900 Active
-
2017-01-19historical
-
2016-01-25$69,900 Active
-
2013-11-15$119,000
-
2004-02-27soldstatus
-
2004-01-12$55,000
-
1997-11-01soldstatus
-
1997-08-23$75,000
ⓘ Source: listings_history table (triggers on properties + properties_extension) + one-shot
backfill from property_details.listing_events for pre-trigger history.
Tax reassessment forecast MO · Resets to sale price
- Current annual tax
- $2,186 · $182/mo
- Projected year-2 tax
- $2,186 · $182/mo
- Expected delta
- $0/yr ($0/mo · 0.0%)
ⓘ Screening estimate from a state-policy table — verify with the county assessor before closing.
Climate risk First Street
- Flood 1/10 Low FEMA zone X (unshaded) · 0% chance over 30 yrs
- Wildfire 2/10 Low
- Heat 4/10 Moderate 7 d/yr ≥107°F today · 16 d/yr by 30 yrs out
- Wind 2/10 Low
- Air quality 3/10 Moderate 3 unhealthy d/yr today · 3 by 30 yrs out
Nearby sold comps map
Loading sold comps map…
Walkable amenities ~0.75 mi
Loading nearby amenities…
Taxation est. · year 1
- Rental income
- $21,487
- − Mortgage interest
- −$3,781
- − Property taxes
- −$2,186
- − Insurance
- −$338
- − Repairs & maintenance
- −$1,719
- − Management
- −$1,719
- − Depreciation
- −$1,964
- Taxable income
- $9,780
- Est. tax owed @ 24.0%
- −$2,347
- After-tax cash flow
- $7,856/yr
For passive investors: Depreciation is non-cash, so a rental often shows a tax loss while cash-flowing — sheltering income. Rental losses are passive: they offset passive income freely, and up to $25,000/yr can offset ordinary (W-2) income if you actively participate and your MAGI is under $100k (phasing out to $0 by $150k); unused losses carry forward. On sale, claimed depreciation is recaptured at up to 25%, and gains may owe capital-gains tax (a 1031 exchange can defer both). Figures are a year-1 estimate at your 24.0% rate — not tax advice; consult a CPA.
Schools (NCES district)
- District
- Excelsior Springs 40
- NCES district ID
- 2911650
- Math proficiency
- 27% ▼ -6.00%
- Reading proficiency
- 40% ▼ -1.00%
- Median HH income
- $52,747
- Composite
- 29.32/100
- National rank
- #6548
- State rank
- #225 of 324 in MO
Livability — Excelsior Springs
- Score
- 67/100
- State rank
- #228
- US rank
- #11166
Category grades
Schools grade is shown separately in the Schools card above.
Census & demographics
- Census place
- Excelsior Springs, MO
- County
- Clay County · 220,651 people
- City population
- 15,574
- Metro
- Kansas City, MO-KS
- Population (ZIP)
- 15,574
- Household income
- $77,895
- Rent vs Own
- Severe rent burden
- 329.0
Population outlook (Clay County) Hauer SSP2
- Today (2025)
- 266,022 people
- By 2030
- 280,057 · +5.3%
- By 2040
- 306,153 · +15.1%
- By 2050
- 328,630 · +23.5%
- By 2075
- 375,182 · +41.0%
- By 2100
- 392,861 · +47.7%
Race, ethnicity, and origin ACS 2023
- Neighborhood character
- Predominantly White (85%)
- Race & ethnicity
- White 85% Two or more races 7% Hispanic / Latino 6% Black 3% Native American 1%
- Hispanic origin (detail)
- Mexican 4% Cuban 2%
- Common ancestry
- Italian 2% Serbian 2% Portuguese 1%
- Foreign-born
- 3% · Canada, China
- Languages at home
- 95% English-only · Spanish 3%
Political lean MEDSL · Clay
- 2024 margin
- Lean R (+5.6) · D 46.4% · R 52.0% · Other 1.6%
- 2008→2024 swing
- -4.9pp toward R · 2008: -0.7pp · 2024: -5.6pp
- All cycles
- 2024: R+5.6 2020: R+4.1 2016: R+11.1 2012: R+8.4 2008: R+0.7
Not yet ingested
- Civics
- —
Market trends
- HPI YoY
- ▼ -54.83%
- Current HPI
- 302.9184
- Rent YoY
- —
- Metro
- Kansas City, MO-KS
- State GDP YoY
- ▲ 1.84%
- F500 in state
- 20
Industry mix (Fortune 500 HQ in MO)
| Industry | F500 HQs | Revenue |
|---|---|---|
| Healthcare | 1 | $163B |
|
||
| Insurance | 1 | $21B |
|
||
| Industrial Technology | 1 | $17B |
|
||
| Retail | 1 | $16B |
|
||
| Industrial Distribution | 1 | $10B |
|
||
| Utilities | 1 | $9B |
|
||
Price history
-10.0% since first listed22 events — show timeline
- 2026-03-19 Listed $67,500 Heartland MLS as Distributed by MLS Grid
- 2020-07-26 Listed $80,000 Heartland MLS as Distributed by MLS Grid
- 2020-01-12 Listing Removed — Heartland MLS as Distributed by MLS Grid
- 2019-12-05 Price Changed $81,000 Heartland MLS as Distributed by MLS Grid
- 2019-11-04 Price Changed $87,000 Heartland MLS as Distributed by MLS Grid
- 2019-10-24 Listed $90,000 Heartland MLS as Distributed by MLS Grid
- 2018-03-09 Sold (MLS) — Heartland MLS as Distributed by MLS Grid
- 2018-02-14 Contingent — Heartland MLS as Distributed by MLS Grid
- 2017-10-06 Listing Removed — Heartland MLS as Distributed by MLS Grid
- 2017-10-05 Price Changed $59,900 Heartland MLS as Distributed by MLS Grid
- 2017-10-05 Relisted — Heartland MLS as Distributed by MLS Grid
- 2017-10-05 Relisted — Heartland MLS as Distributed by MLS Grid
- 2017-07-10 Pending — Heartland MLS as Distributed by MLS Grid
- 2017-06-25 Listing Removed — Heartland MLS as Distributed by MLS Grid
- 2017-03-28 Listed $69,900 Heartland MLS as Distributed by MLS Grid
- 2017-01-19 Listing Removed — Heartland MLS as Distributed by MLS Grid
- 2016-01-25 Listed $69,900 Heartland MLS as Distributed by MLS Grid
- 2013-11-15 Listed $119,000 Heartland MLS as Distributed by MLS Grid
- 2004-02-27 Sold (MLS) — Heartland MLS as Distributed by MLS Grid
- 2004-01-12 Listed $55,000 Heartland MLS as Distributed by MLS Grid
- 1997-11-01 Sold (MLS) — Heartland MLS as Distributed by MLS Grid
- 1997-08-23 Listed $75,000 Heartland MLS as Distributed by MLS Grid
Property tax history
+6.1%/yrLatest (2025): $2,186 · +70.5% YoY. Source: county tax records.
Cash-flow waterfall
monthlySold comps — $/sqft
last 12 mo · ≤1 miLoading sold comps…