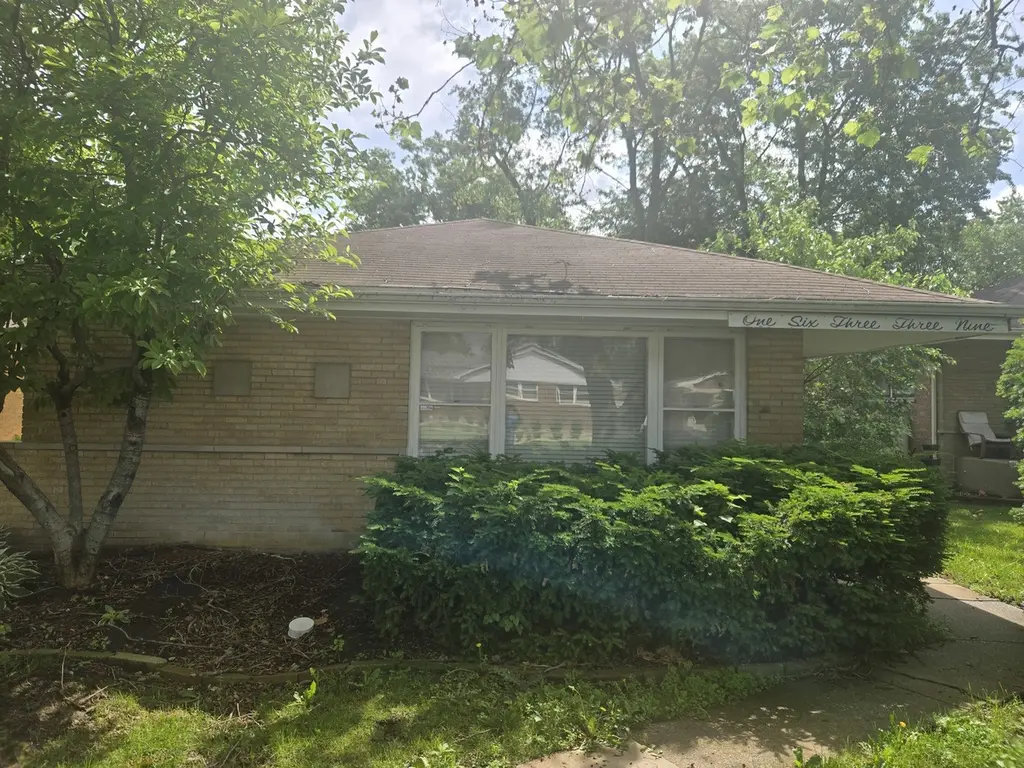
16339 Dobson Ave · South Holland, IL
Flood risk 1/10 · Minimal
- FEMA flood zone
- X (unshaded)
- Chance of flooding over 30 yrs
- 0.0%
- Est. flood insurance / yr
- $473 – $860
Fire risk 1/10 · Minimal
- Est. fire insurance / yr
- $804 – $1,492
Heat risk 3/10 · Minor
- Hot days now (above 103°F)
- 7 days/yr
- Hot days in 30 yrs
- 15 days/yr
Wind risk 2/10 · Minimal
- Chance of severe wind over 30 yrs
- —
Air-quality risk 4/10 · Minor
- Unhealthy air days now
- 4 days/yr
- Unhealthy air days in 30 yrs
- 5 days/yr
Risk factors via First Street. Map © Google.
Why this score? — see what drove the B grade
The composite is a weighted blend of 9 inputs, each scored 0–100. Each bar is that input's sub-score; the figure is the points it added to the 100-point composite (weight × sub-score).
- Cash flow +30.0/30.0
- ARV discount +15.0/15.0
- 1% rule +10.0/10.0
- DSCR +10.0/10.0
- Livability +3.9/5.0
- Rent growth +2.5/5.0
- Condition / age +2.5/5.0
- Schools +0.7/10.0
- Appreciation +0.0/10.0
$165,000
🖨 Deal sheet 📄 Offer letter ✓ Due diligence
Listing remarks
* * Time-sensitive opportunity! * * This solid 3-bedroom, 1.5-bath brick home offers exceptional value and is conveniently located just minutes from expressways, shopping, and everyday amenities. The home features spacious living areas, generously sized bedrooms, an updated full bathroom, stainless steel appliances, a lower-level family room, and a 2-car detached garage. Whether you're an owner-occupant looking to build equity or an investor seeking your next opportunity, this property offers tremendous potential with room to add your personal touch. * * Seller is seeking a prompt closing. Property is being sold as-is. Serious inquiries only. Don't miss this opportunity! * *
Key facts
- Brick home
- 3,125 sq ft lot
- 2 garage spots
Tags
Property features AI
Finance
- Other: Property assessed using assessor's living area; Directions: 162 St to Cottage Grove South to 166 St East to Dobson North to address
- HOA & community: No master association fee required
Exterior
- Parking: Detached garage (owned) with 2 garage spaces; 2 total parking spaces
- Utilities: Public water; Public sewer
- Home design: Detached single-family home; Split-level design; Fee simple ownership; Built between 61-70 years ago; Home built before 1978
- Construction: Brick construction
- Exterior features: Lot dimensions approximately 125 x 25; Lot size less than 0.25 acre
Interior
- Kitchen: Kitchen on main level (approx. 16 x 16)
- Bedrooms: 3 bedrooms (all on main level); Master bedroom on main level (approx. 14 x 14); Second bedroom on main level (approx. 13 x 13); Third bedroom on main level (approx. 12 x 12)
- Bathrooms: 1 full bathroom; 1 half bathroom
- Heating & cooling: Natural gas heating; Central air conditioning
- Interior features: Unfinished full basement; 5 total rooms
- Laundry & utility: Dedicated laundry room
Neighborhood map
What this means for you Summary
Snapshot
- This is a 3-bed/1.5-bath single-family listed at $165k.
Deal economics
- At list price, monthly cash flow is $1k ($16k/yr) — positive.
- The deal already cash-flows at list — no discount required.
- Meets the 1% rule at list price ($3k rent vs $165k).
- Cap rate 16.2% vs local median 8.4% in South Holland — top-decile yield for the area; either an underpriced asset or a hidden risk that comps aren't pricing in. Stress-test before assuming the spread holds.
Location & tenants
- Location reads 77/100 on livability (#167 in IL, #3,071 nationally) — a middle-class / working-renter tenant base. Strengths: commute A+, housing A+, cost of living A; Watch: crime C-, amenities C-, schools D+.
- Thornton Twp Hsd 205 (suburban): math 7% / reading 8% proficiency, ranked #594 of 620 in IL (top 96%) — low school quality limits family demand, transient renter base, plan for 1-2y turnover.
- Market conditions: 135 active listings in the ZIP; 5 comparable units currently listed for rent nearby; rentals leasing fast (median 8d on market — plan ~1-2 weeks tenant-placement turnaround); 6,272 units permitted in Cook County in 2024 (4,658 in 5+ unit buildings).
Forward outlook
- Local home prices are declining (-3.0%/yr); year-one equity from $1k of loan paydown is wiped out by about $5k of value loss. Plan a longer hold.
- At projected returns (-3.0% appreciation + 3.0% rent growth), your $46k cash investment doubles in ~4 years — after that, you're playing with house money.
Negotiation context
- Only 5 days on market — expect competitive offers; lowballing is unlikely to land.
- 8 sale attempts since 5y ago with the ask held roughly flat each time — persistent listings suggest the price (not the market) is what's stuck; bring a comps-based counter.
Risks & watch-outs
- Watch-outs: built in 1958 — expect roof / HVAC / electrical / plumbing capex.
Questions for the listing agent
- Built in 1958 — when were the roof, HVAC, electrical panel, plumbing, and water heater last replaced?
- Is there a deadline driving the sale (1031 exchange, divorce, estate, relocation)? That informs how much negotiation room exists.
- Schools are D-rated, which usually means shorter tenancies and higher turnover. Who's the typical renter profile here, and what's been the actual vacancy rate?
- What's the average days-on-market for RENTAL listings here right now (not sales)? A rising rental-DOM trend means longer vacancies and softer asking-rent achievability than the comps imply.
- What's the recent tenant-quality profile in this submarket — average credit score on applications, eviction rate, late-payment / NSF rate, and stable-employment percentage? A property-management company in the area should have these aggregated.
- How much new for-sale + rental construction is in the pipeline within 1–3 miles? Heavy new supply typically softens prices + rents 12–24 months out; constrained supply supports both.
Investment metrics
- 1% rule
- 1.92% ✓
- Cap rate
- 16.23%
- Cash-on-cash
- 35.47%
- DSCR
- 2.58
- GRM
- 4.3
CMA / ARV
- ARV (on-the-fly)
- $224,983
- Comps found
- 12
Show comp detail 12 sales within ~0.75 mi
| Address | Dist | Beds/Ba | Sqft | Sold | Price | $/sf | Match |
|---|---|---|---|---|---|---|---|
| 1006 E 163rd St | 0.12mi | 3/2.0 | 1,263 (+2%) | 1mo | $262,500 | $208 | 89 |
| 823 E 163rd St | 0.28mi | 3/1.0 | 1,184 (-5%) | 1mo | $197,500 | $167 | 76 |
| 16417 Claire Ln | 0.61mi | 3/2.5 | 1,209 (-3%) | 2mo | $254,995 | $211 | 62 |
| 16645 Cottage Grove Ave | 0.46mi | 3/2.0 | 1,120 (-10%) | 1mo | $211,894 | $189 | 59 |
| 16728 School St | 0.69mi | 3/1.5 | 1,170 (-6%) | 2mo | $196,000 | $168 | 56 |
| 16549 Cottage Grove Ave | 0.37mi | 3/2.0 | 1,426 (+15%) | 2mo | $219,500 | $154 | 55 |
| 702 E 162nd Pl | 0.46mi | 3/2.0 | 1,400 (+13%) | 1mo | $230,000 | $164 | 55 |
| 16001 Avalon Ave | 0.54mi | 4/2.0 (+1) | 1,136 (-9%) | 1mo | $187,500 | $165 | 53 |
| 618 E 159th Pl | 0.71mi | 4/2.0 (+1) | 1,294 (+4%) | 2mo | $236,000 | $182 | 52 |
| 1241 E 168th St | 0.63mi | 3/3.0 | 1,331 (+7%) | 2mo | $230,000 | $173 | 52 |
| 459 E 166th St | 0.75mi | 4/2.0 (+1) | 1,300 (+5%) | 1mo | $235,000 | $181 | 50 |
| 16916 Kimbark Ave | 0.73mi | 4/2.0 (+1) | 1,397 (+12%) | 0mo | $283,000 | $203 | 38 |
Match score weights: distance 35% · size 25% · config 20% · recency 20%. Top-matched comps best support the ARV.
Projected returns pro-forma
-3.0% appreciation · 3.0% rent growth · sell at horizon
- IRR
- 31.1%
- Equity multiple
- 2.31×
- Total profit
- $60,297
- Equity at exit
- $24,602
- IRR
- 38.3%
- Equity multiple
- 4.57×
- Total profit
- $164,708
- Equity at exit
- $14,266
Cash invested: $46,200 (down + closing). Projections, not guarantees.
Landlord ↔ Tenant lean methodology
- Overall (STATE)
- 43 Moderately Tenant-Leaning
- State Illinois
- 43 Moderately Tenant-Leaning · D+7
- County
- — inherits STATE
- City
- — inherits STATE
ZIP-level market 60473
- Active inventory
- 135
- Price-to-rent
- 4.3×
Monthly cashflow live
- Estimated rent
- $3,172 high interval (Pro) →
- Mortgage (P&I)
- −$865
- Tax est. 1.5%
- −$206 /mo · $2,475/yr
- Insurance
- −$69
- HOA
- −$0
- Vacancy / Maint / Mgmt
- −$666
- Net cashflow
- $1,366
Break-even live
UW: 25.0% down · 7.5% · 30yr · 1.5% tax · 5.0% vac · 8.0% maint · 8.0% mgmt
Financing live
Cash to close
- Down payment
- $41,250
- Closing costs
- $4,950
- Reserves months
- —
- Total cash needed
- —
Loan-product check · same deal, 3 products live
Conventional
25% down · 7.5% · 30yr
- Down + closing
- —
- Monthly P&I
- —
- Monthly cashflow
- —
- DSCR
- —
- Eligible?
- —
Personal DTI + credit; lowest rate.
DSCR
20% down · 8.5% · 30yr
- Down + closing
- —
- Monthly P&I
- —
- Monthly cashflow
- —
- DSCR
- —
- Eligible?
- —
No personal income docs; deal must DSCR.
Hard money
10% down · 12.0% · 12mo
- Down + closing
- —
- Monthly P&I
- —
- Monthly cashflow
- —
- DSCR
- —
- Eligible?
- —
Short-term bridge; refi at stabilization.
Rent comps 5 comps
| Address | Beds | Baths | Sqft | Rent | $/sqft | DOM | Units | Dist |
|---|---|---|---|---|---|---|---|---|
| 16246 Dobson Ave South Holland, IL | 3.0 | 2.0 | 1250 | $3,170 | $2.54 | 1d | 1 | 0.11mi |
| 16001 Avalon Ave South Holland, IL | 3.0 | 2.0 | 1136 | $3,330 | $2.93 | 6d | 1 | 0.52mi |
| 15509 Park Ln South Holland, IL | 4.0 | 1.5 | 1200 | $3,400 | $2.83 | 24d | 1 | 1.21mi |
| 15509 Park Ln South Holland, IL | 4.0 | 1.5 | 1200 | $3,400 | $2.83 | 7d | 1 | 1.21mi |
| 15231 Hastings Dr Dolton, IL | 4.0 | 1.5 | 1487 | $2,146 | $1.44 | 7d | 1 | 1.38mi |
Listing history 5 events
-
2026-06-17days on market $165,000 Active 5 DOM
-
2026-06-16days on market $165,000 Active 4 DOM
-
2026-06-15days on market $165,000 Active 3 DOM
-
2026-06-13remarks 688-char remark
-
2026-06-13$165,000 Active 1 DOM
ⓘ Source: listings_history table (triggers on properties + properties_extension) + one-shot
backfill from property_details.listing_events for pre-trigger history.
Climate risk First Street
- Flood 1/10 Low FEMA zone X (unshaded) · 0% chance over 30 yrs
- Wildfire 1/10 Low
- Heat 3/10 Moderate 7 d/yr ≥103°F today · 15 d/yr by 30 yrs out
- Wind 2/10 Low
- Air quality 4/10 Moderate 4 unhealthy d/yr today · 5 by 30 yrs out
Nearby sold comps map
Loading sold comps map…
Walkable amenities ~0.75 mi
Loading nearby amenities…
Taxation est. · year 1
- Rental income
- $38,066
- − Mortgage interest
- −$9,243
- − Property taxes
- −$2,475
- − Insurance
- −$825
- − Repairs & maintenance
- −$3,045
- − Management
- −$3,045
- − Depreciation
- −$4,800
- Taxable income
- $14,633
- Est. tax owed @ 24.0%
- −$3,512
- After-tax cash flow
- $12,877/yr
For passive investors: Depreciation is non-cash, so a rental often shows a tax loss while cash-flowing — sheltering income. Rental losses are passive: they offset passive income freely, and up to $25,000/yr can offset ordinary (W-2) income if you actively participate and your MAGI is under $100k (phasing out to $0 by $150k); unused losses carry forward. On sale, claimed depreciation is recaptured at up to 25%, and gains may owe capital-gains tax (a 1031 exchange can defer both). Figures are a year-1 estimate at your 24.0% rate — not tax advice; consult a CPA.
Schools (NCES district)
- District
- Thornton Twp Hsd 205
- NCES district ID
- 1738970
- Math proficiency
- 7% ▬ 0.00%
- Reading proficiency
- 8% ▼ -2.00%
- Median HH income
- $43,392
- Composite
- 6.92/100
- National rank
- #9976
- State rank
- #594 of 620 in IL
Livability — South Holland
- Score
- 77/100
- State rank
- #167
- US rank
- #3071
Category grades
Schools grade is shown separately in the Schools card above.
Census & demographics
- Census place
- South Holland, IL
- City population
- 21,407
- Population (ZIP)
- 21,407
Population outlook (Cook County) Hauer SSP2
- Today (2025)
- 5,347,519 people
- By 2030
- 5,357,703 · +0.2%
- By 2040
- 5,324,924 · -0.4%
- By 2050
- 5,230,762 · -2.2%
- By 2075
- 4,785,735 · -10.5%
- By 2100
- 4,188,836 · -21.7%
Race, ethnicity, and origin ACS 2023
- Neighborhood character
- Predominantly Black (75%)
- Race & ethnicity
- Black 75% White 10% Hispanic / Latino 10% Two or more races 3% Asian 1%
- Hispanic origin (detail)
- Mexican 9% Puerto Rican 1%
- Common ancestry
- Iranian 3% Romanian 2%
- Foreign-born
- 6% · Canada, China
- Languages at home
- 87% English-only · Spanish 8% Other Asian/Pacific 1% Russian/Polish/Slavic 1%
Political lean MEDSL · Cook
- 2024 margin
- Solid D (+42.0) · D 70.4% · R 28.4% · Other 1.2%
- 2008→2024 swing
- -11.4pp toward R · 2008: 53.4pp · 2024: 42.0pp
- All cycles
- 2024: D+42.0 2020: D+50.3 2016: D+53.0 2012: D+49.4 2008: D+53.4
Not yet ingested
- Civics
- —
Market trends
- HPI YoY
- ▼ -114.36%
- Current HPI
- 201.2479
- Rent YoY
- —
- Metro
- —
- State GDP YoY
- ▲ 1.59%
- F500 in state
- 60
Industry mix (Fortune 500 HQ in IL)
| Industry | F500 HQs | Revenue |
|---|---|---|
| Insurance | 4 | $201B |
|
||
| Consumer Goods | 4 | $87B |
|
||
| Industrial Machinery | 3 | $64B |
|
||
| Healthcare | 2 | $55B |
|
||
| Retail / Pharmacy | 1 | $148B |
|
||
| Agriculture / Food | 1 | $86B |
|
||
Price history
23 events — show timeline
- 2026-06-12 Listed $165,000 MRED as Distributed by MLS Grid
- 2023-07-27 Pending — MRED as Distributed by MLS Grid
- 2023-07-25 Listing Removed — MRED as Distributed by MLS Grid
- 2023-07-17 Price Changed — MRED as Distributed by MLS Grid
- 2023-07-11 Listed — MRED as Distributed by MLS Grid
- 2023-07-05 Listing Removed — MRED as Distributed by MLS Grid
- 2023-06-20 Relisted — MRED as Distributed by MLS Grid
- 2023-06-12 Pending — MRED as Distributed by MLS Grid
- 2023-05-06 Price Changed — MRED as Distributed by MLS Grid
- 2023-04-19 Price Changed — MRED as Distributed by MLS Grid
- 2023-04-05 Listed — MRED as Distributed by MLS Grid
- 2022-11-07 Listing Removed — MRED as Distributed by MLS Grid
- 2022-09-08 Relisted — MRED as Distributed by MLS Grid
- 2022-09-01 Contingent — MRED as Distributed by MLS Grid
- 2022-08-10 Price Changed — MRED as Distributed by MLS Grid
- 2022-07-08 Price Changed — MRED as Distributed by MLS Grid
- 2022-06-28 Relisted — MRED as Distributed by MLS Grid
- 2022-06-18 Listing Removed — MRED as Distributed by MLS Grid
- 2022-06-12 Listed — MRED as Distributed by MLS Grid
- 2021-11-16 Listing Removed — MRED as Distributed by MLS Grid
- 2021-10-28 Price Changed — MRED as Distributed by MLS Grid
- 2021-09-10 Price Changed — MRED as Distributed by MLS Grid
- 2021-08-23 Listed — MRED as Distributed by MLS Grid
Property tax history
+5.8%/yrLatest (2023): $8,722 · +48.5% YoY. Source: county tax records.
Cash-flow waterfall
monthlySold comps — $/sqft
last 12 mo · ≤1 miLoading sold comps…