 Fourplex
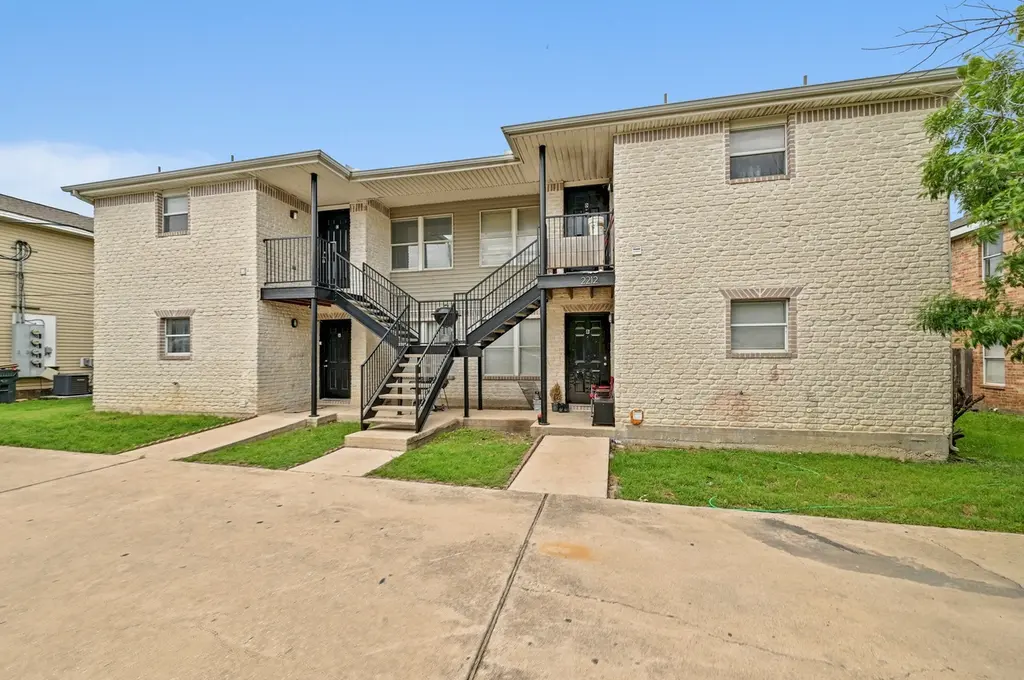
2212 Katy Ln · Georgetown, TX
Flood risk 1/10 · Minimal
- FEMA flood zone
- X (unshaded)
- Chance of flooding over 30 yrs
- 0.0%
- Est. flood insurance / yr
- $507 – $1,088
Fire risk 4/10 · Minor
- Est. fire insurance / yr
- $1,222 – $2,270
Heat risk 8/10 · Major
- Hot days now (above 107°F)
- 7 days/yr
- Hot days in 30 yrs
- 23 days/yr
Wind risk 8/10 · Major
- Chance of severe wind over 30 yrs
- 80.0%
Air-quality risk 2/10 · Minimal
- Unhealthy air days now
- 1 days/yr
- Unhealthy air days in 30 yrs
- 1 days/yr
Risk factors via First Street. Map © Google.
Why this score? — see what drove the D grade
The composite is a weighted blend of 9 inputs, each scored 0–100. Each bar is that input's sub-score; the figure is the points it added to the 100-point composite (weight × sub-score).
- Cash flow +12.4/30.0
- ARV discount +10.2/15.0
- Livability +4.1/5.0
- DSCR +3.7/10.0
- 1% rule +3.6/10.0
- Schools +3.2/10.0
- Condition / age +2.5/5.0
- Rent growth +1.6/5.0
- Appreciation +0.0/10.0
$649,999
🖨 Deal sheet (PDF) 📄 Offer letter ✓ Due diligence
Multi-family units
County records classify this as Multi-Family (2-4 Unit). Listing-text estimate: 4 units. confirmed
Listing remarks MLS
Please do not disturb Tenants! All showings must be arranged with Broker – No lock box or sign on the property, showings/inspection of units and documents available with executed contract – rent roll and leases. Great Georgetown investment property, 100% OCCUPIED – Desired floor plan – Spacious 4 – 2/2’s with Washer/ Dryers, Dishwashers and Refrigerators, all 4 units are identical, low maintenance – Roof Replaced August 2015, Owner maintains LandscapingRestrictions: Yes
Key facts
- Ample parking
- 8,380 sq ft lot
- 10 parking spots
Tags
Property features AI
Finance
- Financial info: Total actual rent: $4,895 per month; Unit A rent $1,250 (deposit $1,195) — leased through June 30, 2026; Unit B rent $1,225 (deposit $1,225) — leased through May 31, 2026; Unit C rent $1,225 (deposit $1,225); Unit D rent $1,195 (deposit $500) — month-to-month, leased (lease expires May 31, 2026); Pets: Cats OK, Dogs OK, Negotiable
- HOA & community: Community mailbox; Curbs
Exterior
- Parking: 10 parking spaces
- Security: Smoke detectors
- Utilities: Electricity available; Public water; Public sewer
- Home design: 2-story building; Faces northeast; Resale property
- Construction: Masonry and vinyl siding exterior; Composition roof; Slab foundation; Year built per public records
- Exterior features: Partial wood fencing; Fenced yard; Small trees; Level lot
Interior
- Kitchen: Cooktop; Oven; Dishwasher; Disposal; Refrigerator
- Bedrooms: Four 2-bedroom units (Units A, B, C, D)
- Flooring: Tile; No carpet
- Bathrooms: Each unit has 2 full bathrooms
- Heating & cooling: Central heating; Central air; Ceiling fans for cooling
- Interior features: Ceiling fan(s); Pantry; Window treatments
- Laundry & utility: Washer; Dryer
Neighborhood map
What this means for you Summary
Snapshot
- This is a 4 × 2-bed/2.0-bath units multifamily listed at $650k.
Deal economics
- At list price, monthly cash flow is $-108 ($-1k/yr) — negative. Per door: $-27/mo.
- To cash-flow at today's rent, offer at most $631k (2.9% below list).
- To meet the 1% rule (rent ≥ 1% of price), the offer needs to be $558k (14.1% below list).
- Recommended offer: $558k (14.1% below list) — sets the bar for 1% rule.
- Cap rate 6.1% vs local median 2.4% in Georgetown — top-decile yield for the area; either an underpriced asset or a hidden risk that comps aren't pricing in. Stress-test before assuming the spread holds.
Location & tenants
- Location reads 82/100 on livability (#18 in TX, #1,294 nationally) — a professional / high-income tenant draw. Strengths: amenities A+, housing A+, health & safety A+; Watch: commute F.
- Georgetown ISD (suburban): math 31% / reading 38% proficiency, ranked #474 of 826 in TX (top 57%) — families likely to look elsewhere, expect single-tenant / working-renter base with shorter leases.
- Zoned schools: Annie Purl El (math 16% / reading 24%, grade F, #3,536 of 4,322 statewide, top 83%, 557 students, 75% FRL); James Tippit Middle (math 26% / reading 33%, grade F, #1,077 of 1,662 statewide, top 66%, 628 students, 49% FRL); East View H S (math 23% / reading 32%, grade F, #1,183 of 1,632 statewide, top 73%, 2,075 students, 41% FRL) — zoned schools average 55% FRL vs 40% district-wide (15 pts higher); higher-poverty schools than district average — tighter screening recommended.
- Market conditions: Rents falling (-3.5%/yr); 571 active listings in the ZIP; solid renter incomes; 7,543 units permitted in Williamson County in 2024 (1,425 in 5+ unit buildings).
- At $5,585/mo this rent would consume 67% of the median local household income ($100k/yr) (locally 1384% of renters already pay >50% of income on rent) — very limited rent-growth headroom before tenants either downsize or default.
Forward outlook
- Local home prices are declining (-3.0%/yr); year-one equity from $4k of loan paydown is wiped out by about $20k of value loss. Plan a longer hold.
- Williamson County population projected at +69% by 2050 — long-run rental-demand tailwind backs the buy-and-hold thesis.
Negotiation context
- It's been on market 64 days — a 6% lower offer ($611k) is reasonable based on typical stale-listing flexibility.
- 16 sale attempts since 25y ago with the ask held roughly flat each time — persistent listings suggest the price (not the market) is what's stuck; bring a comps-based counter.
Risks & watch-outs
- Climate carrying-cost: severe wind risk, 80% chance of damaging wind over 30y; extreme-heat days projected 7→23/yr by 2055 (HVAC capex compounding) — expect insurance premiums to compound above CPI over the hold.
Questions for the listing agent
- What do current leases actually rent for vs. the listed asking? Can we see a recent rent roll and the last 12 months of T-12 income?
- It's been on market 64 days. Have you received any prior offers? Is the seller open to a 14% concession, seller financing, or rate buy-down credit?
- Can we see the unit-by-unit rent roll, current vacancy, and any below-market leases? What's the average tenancy length?
- What capital expenditures (roof, boiler, parking lot, exteriors) have been made in the last 5 years, and what's planned in the next 2?
- Why hasn't it sold? Are there any deal-killer items the seller is aware of (foundation, flood, title, zoning, code violations)?
- Is there a deadline driving the sale (1031 exchange, divorce, estate, relocation)? That informs how much negotiation room exists.
- The area grade is low — what's the realistic commute time and amenity access for the typical tenant pool here? Any planned neighborhood developments (good or bad) we should know about?
- What's the average days-on-market for RENTAL listings here right now (not sales)? A rising rental-DOM trend means longer vacancies and softer asking-rent achievability than the comps imply.
- What's the recent tenant-quality profile in this submarket — average credit score on applications, eviction rate, late-payment / NSF rate, and stable-employment percentage? A property-management company in the area should have these aggregated.
- How much new apartment / multifamily construction is in the pipeline within 1–3 miles? Heavy new supply (>2% of stock underway) typically softens rents 12–24 months out; light construction supports rent growth.
Investment metrics
- 1% rule
- 0.86% ✗
- Cap rate
- 6.09%
- Cash-on-cash
- -0.71%
- DSCR
- 0.97
- GRM
- 9.7
CMA / ARV
- ARV (median comp)
- $691,687
- List price
- $649,999
- Delta
- -6.03%
- Verdict
- FAIR
- Comps
- 7 within 1.0 mi
Show comp detail 1 sale within ~0.75 mi
| Address | Dist | Beds/Ba | Sqft | Sold | Price | $/sf | Match |
|---|---|---|---|---|---|---|---|
| 2203 Creekside Ln | 0.10mi | 8/6.0 | 4,074 (-0%) | 2mo | $584,999 | $144 | 85 |
Match score weights: distance 35% · size 25% · config 20% · recency 20%. Top-matched comps best support the ARV.
Projected returns pro-forma
-3.0% appreciation · 0.0% rent growth · sell at horizon
- IRR
- -20.9%
- Equity multiple
- 0.29×
- Total profit
- $-128,465
- Equity at exit
- $96,917
- IRR
- -23.2%
- Equity multiple
- -0.01×
- Total profit
- $-183,555
- Equity at exit
- $56,200
Cash invested: $182,000 (down + closing). Projections, not guarantees.
Landlord ↔ Tenant lean methodology
- Overall (STATE)
- 87 Strongly Landlord-Friendly
- State Texas
- 87 Strongly Landlord-Friendly · R+5
- County
- — inherits STATE
- City
- — inherits STATE
ZIP-level market 78626
- Rents YoY
- -3.5%
- Active inventory
- 571
- Price-to-rent
- 38.8×
Monthly cashflow live
- Estimated rent
- $5,585 high interval (Pro) →
- Mortgage (P&I)
- −$3,409
- Tax from tax record
- −$841 /mo · $10,086/yr
- Insurance
- −$271
- HOA
- −$0
- Vacancy / Maint / Mgmt
- −$1,173
- Net cashflow
- $-108
Break-even live
Sensitivity live
| Price | -10% $260 | -5% $76 | +0% $-108 | +5% $-292 | +10% $-476 |
|---|---|---|---|---|---|
| Rent | -10% $-549 | -5% $-328 | +0% $-108 | +5% $113 | +10% $333 |
| Rate | -1.0pp $219 | -0.5pp $57 | base $-108 | +0.5pp $-276 | +1.0pp $-448 |
4-unit breakdown (identical units grouped — click to expand)
| Units | Beds | Baths | Est. rent |
|---|---|---|---|
| 4× units | 2 | 2 | $5,584 |
| #1 | 2 | 2 | $1,396 |
| #2 | 2 | 2 | $1,396 |
| #3 | 2 | 2 | $1,396 |
| #4 | 2 | 2 | $1,396 |
| Total (4 units) | $5,585 | ||
UW: 25.0% down · 7.5% · 30yr · 1.5% tax · 5.0% vac · 8.0% maint · 8.0% mgmt
Financing live
Cash to close
- Down payment
- $162,500
- Closing costs
- $19,500
- Reserves months
- —
- Total cash needed
- —
Loan-product check · same deal, 3 products live
Conventional
25% down · 7.5% · 30yr
- Down + closing
- —
- Monthly P&I
- —
- Monthly cashflow
- —
- DSCR
- —
- Eligible?
- —
Personal DTI + credit; lowest rate.
DSCR
20% down · 8.5% · 30yr
- Down + closing
- —
- Monthly P&I
- —
- Monthly cashflow
- —
- DSCR
- —
- Eligible?
- —
No personal income docs; deal must DSCR.
Hard money
10% down · 12.0% · 12mo
- Down + closing
- —
- Monthly P&I
- —
- Monthly cashflow
- —
- DSCR
- —
- Eligible?
- —
Short-term bridge; refi at stabilization.
Listing history 50 events
-
2026-06-21days on market $649,999 Active 64 DOM
-
2026-06-18days on market $649,999 Active 61 DOM
-
2026-06-17days on market $649,999 Active 60 DOM
-
2026-06-16days on market $649,999 Active 59 DOM
-
2026-06-15days on market $649,999 Active 58 DOM
-
2026-06-13days on market $649,999 Active 56 DOM
-
2026-06-09days on market $649,999 Active 52 DOM
-
2026-06-08days on market $649,999 Active 51 DOM
-
2026-06-07days on market $649,999 Active 50 DOM
-
2026-06-03days on market $649,999 Active 46 DOM
-
2026-06-02days on market $649,999 Active 45 DOM
-
2026-06-01days on market $649,999 Active 44 DOM
-
2026-05-31days on market $649,999 Active 43 DOM
-
2026-04-18$649,999 Active 998-char remark
-
2023-08-21historical $1,250
-
2023-07-19price $1,250
-
2023-07-16$1,295
-
2019-04-22soldstatus
-
2019-04-19soldstatus Sold 516-char remark
Show marketing remark (516 chars)
Please do not disturb Tenants! All showings must be arranged with Broker – No lock box or sign on the property, showings/inspection of units and documents available with executed contract – rent roll and leases. Great Georgetown investment property, 100% OCCUPIED – Desired floor plan – Spacious 4 – 2/2’s with Washer/ Dryers, Dishwashers and Refrigerators, all 4 units are identical, low maintenance – Roof Replaced August 2015, Owner maintains LandscapingRestrictions: Yes
-
2019-03-18status Pending - Taking Backups 516-char remark
Show marketing remark (516 chars)
Please do not disturb Tenants! All showings must be arranged with Broker – No lock box or sign on the property, showings/inspection of units and documents available with executed contract – rent roll and leases. Great Georgetown investment property, 100% OCCUPIED – Desired floor plan – Spacious 4 – 2/2’s with Washer/ Dryers, Dishwashers and Refrigerators, all 4 units are identical, low maintenance – Roof Replaced August 2015, Owner maintains LandscapingRestrictions: Yes
-
2019-02-15$489,900 Active 516-char remark
Show marketing remark (516 chars)
Please do not disturb Tenants! All showings must be arranged with Broker – No lock box or sign on the property, showings/inspection of units and documents available with executed contract – rent roll and leases. Great Georgetown investment property, 100% OCCUPIED – Desired floor plan – Spacious 4 – 2/2’s with Washer/ Dryers, Dishwashers and Refrigerators, all 4 units are identical, low maintenance – Roof Replaced August 2015, Owner maintains LandscapingRestrictions: Yes
-
2012-10-31soldstatus
-
2012-09-28soldstatus Sold
Show marketing remark (269 chars)
ALL 4 UNITIS ARE IDENTICAL 2/2. GOOD CONDITION, LOW MAINTENANCE, GREAT INVESTMENT PROPERTY, ALL UNITS LEASED, DISHWASHER, WASHER & DRYERS, ALL TILE THROUGHOUT, CLOSE TO SHOPPING, UNIVERSITY. LOCKBOX ON APT A, ALL OTHERS SHOWN WITH CONTRACT. Restrictions: Unknown
-
2012-08-21status Pending - Taking Backups
Show marketing remark (269 chars)
ALL 4 UNITIS ARE IDENTICAL 2/2. GOOD CONDITION, LOW MAINTENANCE, GREAT INVESTMENT PROPERTY, ALL UNITS LEASED, DISHWASHER, WASHER & DRYERS, ALL TILE THROUGHOUT, CLOSE TO SHOPPING, UNIVERSITY. LOCKBOX ON APT A, ALL OTHERS SHOWN WITH CONTRACT. Restrictions: Unknown
-
2012-08-15status Active
Show marketing remark (269 chars)
ALL 4 UNITIS ARE IDENTICAL 2/2. GOOD CONDITION, LOW MAINTENANCE, GREAT INVESTMENT PROPERTY, ALL UNITS LEASED, DISHWASHER, WASHER & DRYERS, ALL TILE THROUGHOUT, CLOSE TO SHOPPING, UNIVERSITY. LOCKBOX ON APT A, ALL OTHERS SHOWN WITH CONTRACT. Restrictions: Unknown
-
2012-08-09status Pending - Taking Backups
Show marketing remark (269 chars)
ALL 4 UNITIS ARE IDENTICAL 2/2. GOOD CONDITION, LOW MAINTENANCE, GREAT INVESTMENT PROPERTY, ALL UNITS LEASED, DISHWASHER, WASHER & DRYERS, ALL TILE THROUGHOUT, CLOSE TO SHOPPING, UNIVERSITY. LOCKBOX ON APT A, ALL OTHERS SHOWN WITH CONTRACT. Restrictions: Unknown
-
2012-07-25$230,000 Active
Show marketing remark (269 chars)
ALL 4 UNITIS ARE IDENTICAL 2/2. GOOD CONDITION, LOW MAINTENANCE, GREAT INVESTMENT PROPERTY, ALL UNITS LEASED, DISHWASHER, WASHER & DRYERS, ALL TILE THROUGHOUT, CLOSE TO SHOPPING, UNIVERSITY. LOCKBOX ON APT A, ALL OTHERS SHOWN WITH CONTRACT. Restrictions: Unknown
-
2006-05-30soldstatus
-
2006-05-25soldstatus
-
2006-04-26historical
-
2006-03-03$259,900
-
2005-05-06soldstatus
-
2004-09-17soldstatus
-
2004-07-08historical
-
2004-06-24$209,900
-
2004-05-20historical
-
2004-05-20
-
2004-04-30historical
-
2004-04-23
-
2004-04-16historical
-
2003-10-21
-
2003-08-29historical
-
2003-05-15
-
2003-02-17historical
-
2003-01-09
-
2003-01-09historical
-
2002-08-19
-
2002-05-01historical
-
2002-03-02
-
2002-03-01historical
ⓘ Source: listings_history table (triggers on properties + properties_extension) + one-shot
backfill from property_details.listing_events for pre-trigger history.
Tax reassessment forecast TX · Resets to sale price
- Current annual tax
- $10,086 · $841/mo
- Projected year-2 tax
- $11,895 · $991/mo
- Expected delta
- +$1,809/yr (+$151/mo · 17.9%)
ⓘ Screening estimate from a state-policy table — verify with the county assessor before closing.
Climate risk First Street
- Flood 1/10 Low FEMA zone X (unshaded) · 0% chance over 30 yrs
- Wildfire 4/10 Moderate
- Heat 8/10 Severe 7 d/yr ≥107°F today · 23 d/yr by 30 yrs out
- Wind 8/10 Severe 80% chance of damaging wind over 30 yrs
- Air quality 2/10 Low 1 unhealthy d/yr today · 1 by 30 yrs out
Nearby sold comps map
Loading sold comps map…
Walkable amenities ~0.75 mi
Loading nearby amenities…
Taxation est. · year 1
- Rental income
- $67,020
- − Mortgage interest
- −$36,410
- − Property taxes
- −$10,086
- − Insurance
- −$3,250
- − Repairs & maintenance
- −$5,362
- − Management
- −$5,362
- − Depreciation
- −$18,909
- Taxable loss
- −$12,359
- Est. tax savings @ 24.0%
- +$2,966
- After-tax cash flow
- $1,671/yr
For passive investors: Depreciation is non-cash, so a rental often shows a tax loss while cash-flowing — sheltering income. Rental losses are passive: they offset passive income freely, and up to $25,000/yr can offset ordinary (W-2) income if you actively participate and your MAGI is under $100k (phasing out to $0 by $150k); unused losses carry forward. On sale, claimed depreciation is recaptured at up to 25%, and gains may owe capital-gains tax (a 1031 exchange can defer both). Figures are a year-1 estimate at your 24.0% rate — not tax advice; consult a CPA.
Schools (NCES district)
- District
- Georgetown ISD
- NCES district ID
- 4820600
- Math proficiency
- 31% ▼ -5.00%
- Reading proficiency
- 38% ▼ -8.00%
- Median HH income
- $69,461
- Composite
- 31.77/100
- National rank
- #5897
- State rank
- #474 of 826 in TX
Livability — Georgetown
- Score
- 82/100
- State rank
- #18
- US rank
- #1294
Category grades
Schools grade is shown separately in the Schools card above.
Census & demographics
- Census place
- Georgetown, TX
- County
- Williamson County · 680,029 people
- City population
- 128,203
- Metro
- Austin-Round Rock-Georgetown, TX
- Population (ZIP)
- 48,072
- Household income
- $100,431
- Rent vs Own
- Severe rent burden
- 1384.0
Population outlook (Williamson County) Hauer SSP2
- Today (2025)
- 699,027 people
- By 2030
- 795,537 · +13.8%
- By 2040
- 990,683 · +41.7%
- By 2050
- 1,184,292 · +69.4%
- By 2075
- 1,623,825 · +132.3%
- By 2100
- 1,924,153 · +175.3%
Race, ethnicity, and origin ACS 2023
- Neighborhood character
- Diverse neighborhood (Simpson 0.61)
- Race & ethnicity
- White 53% Hispanic / Latino 33% Two or more races 18% Black 8% Asian 3%
- Hispanic origin (detail)
- Mexican 26% Puerto Rican 2%
- Common ancestry
- Slovak 2% Lithuanian 2% Italian 2%
- Foreign-born
- 13% · Canada, China, Jamaica
- Languages at home
- 75% English-only · Spanish 18% Other Indo-European 2% French/Haitian/Cajun 1%
Political lean MEDSL · Williamson
- 2024 margin
- Toss-up / Even · D 48.0% · R 50.4% · Other 1.6%
- 2008→2024 swing
- +10.6pp toward D · 2008: -13.0pp · 2024: -2.5pp
- All cycles
- 2024: R+2.5 2020: D+1.4 2016: R+9.9 2012: R+21.5 2008: R+13.0
Not yet ingested
- Civics
- —
Market trends
- HPI YoY
- ▼ -215.77%
- Current HPI
- 198.0316
- Rent YoY
- ▼ -3.48%
- Metro
- Austin-Round Rock-Georgetown, TX
- State GDP YoY
- ▲ 3.95%
- F500 in state
- 110
Industry mix (Fortune 500 HQ in TX)
| Industry | F500 HQs | Revenue |
|---|---|---|
| Energy | 16 | $1,198B |
|
||
| Technology | 5 | $198B |
|
||
| Engineering / Construction | 4 | $72B |
|
||
| Energy Services | 3 | $60B |
|
||
| Utilities | 3 | $41B |
|
||
| Healthcare | 2 | $330B |
|
||
Price history
+150.1% since first listed41 events — show timeline
- 2026-04-18 Listed $649,999 Unlock MLS
- 2023-08-21 Rental Removed $1,250 APPFOLIO
- 2023-07-19 Price Changed $1,250 APPFOLIO
- 2023-07-16 Listed for Rent $1,295 APPFOLIO
- 2019-04-22 Sold (Public Records) — Public Records
- 2019-04-19 Sold (MLS) — Unlock MLS
- 2019-03-18 Pending — Unlock MLS
- 2019-02-15 Listed $489,900 Unlock MLS
- 2012-10-31 Sold (Public Records) — Public Records
- 2012-09-28 Sold (MLS) — Unlock MLS
- 2012-08-21 Pending — Unlock MLS
- 2012-08-15 Relisted — Unlock MLS
- 2012-08-09 Pending — Unlock MLS
- 2012-07-25 Listed $230,000 Unlock MLS
- 2006-05-30 Sold (Public Records) — Public Records
- 2006-05-25 Sold (MLS) — Unlock MLS
- 2006-04-26 Delisted — Unlock MLS
- 2006-03-03 Listed $259,900 Unlock MLS
- 2005-05-06 Sold (Public Records) — Public Records
- 2004-09-17 Sold (MLS) — Unlock MLS
- 2004-07-08 Delisted — Unlock MLS
- 2004-06-24 Listed $209,900 Unlock MLS
- 2004-05-20 Listed — Unlock MLS
- 2004-05-20 Delisted — Unlock MLS
- 2004-04-30 Delisted — Unlock MLS
- 2004-04-23 Listed — Unlock MLS
- 2004-04-16 Delisted — Unlock MLS
- 2003-10-21 Listed — Unlock MLS
- 2003-08-29 Delisted — Unlock MLS
- 2003-05-15 Listed — Unlock MLS
- 2003-02-17 Delisted — Unlock MLS
- 2003-01-09 Delisted — Unlock MLS
- 2003-01-09 Listed — Unlock MLS
- 2002-08-19 Listed — Unlock MLS
- 2002-05-01 Delisted — Unlock MLS
- 2002-03-02 Listed — Unlock MLS
- 2002-03-01 Delisted — Unlock MLS
- 2002-02-02 Listed — Unlock MLS
- 2001-12-31 Sold (MLS) — Unlock MLS
- 2001-12-07 Delisted — Unlock MLS
- 2001-11-19 Listed $259,900 Unlock MLS
Property tax history
+3.9%/yrLatest (2026): $10,086 · -6.3% YoY. Source: county tax records.
Cash-flow waterfall
monthlySold comps — $/sqft
last 12 mo · ≤1 miLoading sold comps…