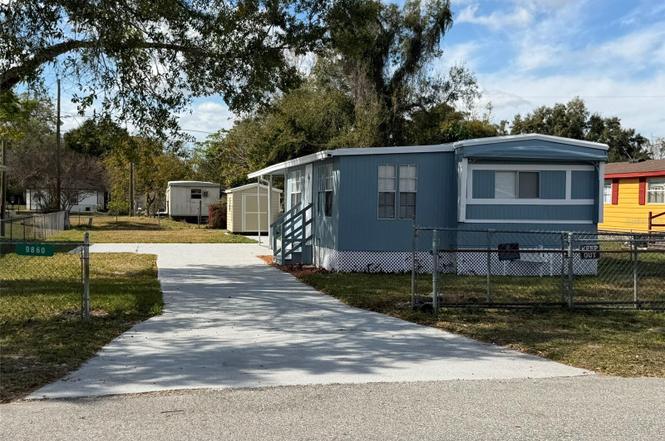
9860 5th Ave · Taft, FL
Flood risk 1/10 · Minimal
- FEMA flood zone
- X (unshaded)
- Chance of flooding over 30 yrs
- 0.0%
- Est. flood insurance / yr
- $507 – $1,088
Fire risk 2/10 · Minimal
- Est. fire insurance / yr
- $947 – $1,759
Heat risk 9/10 · Severe
- Hot days now (above 108°F)
- 7 days/yr
- Hot days in 30 yrs
- 21 days/yr
Wind risk 9/10 · Severe
- Chance of severe wind over 30 yrs
- 99.0%
Air-quality risk 1/10 · Minimal
- Unhealthy air days now
- 0 days/yr
- Unhealthy air days in 30 yrs
- 0 days/yr
Risk factors via First Street. Map © Google.
Why this score? — see what drove the D grade
The composite is a weighted blend of 9 inputs, each scored 0–100. Each bar is that input's sub-score; the figure is the points it added to the 100-point composite (weight × sub-score).
- Cash flow +15.2/30.0
- ARV discount +7.5/15.0
- DSCR +4.7/10.0
- Schools +4.1/10.0
- Livability +3.7/5.0
- 1% rule +3.5/10.0
- Condition / age +2.5/5.0
- Rent growth +2.4/5.0
- Appreciation +0.0/10.0
$209,000
🖨 Deal sheet (PDF) 📄 Offer letter ✓ Due diligence
Listing remarks
This TOTALLY UPGRADED property in a nice quiet neighborhood is NOW SIGNIFICANTLY REDUCED IN PRICE! All New Appliances including Washer and Dryer (Washer and Dryer is in Storage Garage) All New Electrical including the Elec Panel, New Plumbing, Septic has been emptied and verified via receipts, has New Insulation thru out trailer, New Paint thru out, changed out some windows to new, New Hurricane door from outside to 3rd Bdrm(3rd Bdrm has a separate entrance), also: has 90sq ft Shed and New Driveway, fits about 4 vehicles, totally fenced in yard with sliding gate; (Note: total sq footage after remodeling is about 908 sq ft. )
Key facts
- New plumbing
- All new appliances
- New paint
Tags
Property features AI
Finance
- Other: Property type: Residential mobile home; Zoning: R-T-2; Total rooms: 8
- Financial info: No lease restrictions; Unfurnished
- HOA & community: No association
Exterior
- Parking: No parking details provided
- Security: No security features listed
- Utilities: Public water; Public sewer; Public utilities
- Home design: Residential mobile home (double wide); Single story; Home faces south; Entry on one level
- Construction: Metal siding; Shingle roof; Crawlspace foundation; Estimated living area about 908 square feet
- Exterior features: Concrete road access; Lot approximately 0.17 acres
Interior
- Kitchen: Range; Microwave; Refrigerator; Dishwasher not listed
- Bedrooms: 3 bedrooms
- Flooring: Laminate flooring; Tile flooring
- Bathrooms: 3 full bathrooms
- Heating & cooling: Electric heating; Central air conditioning
- Interior features: Ceiling fans
- Laundry & utility: Washer; Dryer; Laundry located outside
Neighborhood map
What this means for you Summary
Snapshot
- This is a 2-bed/2.0-bath manufactured listed at $209k.
Deal economics
- At list price, monthly cash flow is $74 ($892/yr) — positive.
- The deal already cash-flows at list — no discount required.
- To meet the 1% rule (rent ≥ 1% of price), the offer needs to be $179k (14.5% below list).
- Recommended offer: $179k (14.5% below list) — sets the bar for 1% rule.
Location & tenants
- Location reads 74/100 on livability (#275 in FL, #4,431 nationally) — a middle-class / working-renter tenant base. Strengths: crime A+, cost of living A+, housing A+; Watch: amenities F, employment D-.
- Orange (suburban): math 46% / reading 51% proficiency, ranked #43 of 73 in FL (top 59%) — families likely to look elsewhere, expect single-tenant / working-renter base with shorter leases.
- Zoned schools: Sally Ride Elementary (math 52% / reading 47%, grade D, #1,088 of 2,144 statewide, top 53%, 406 students, 71% FRL); Judson B Walker Middle (math 31% / reading 31%, grade F, #462 of 571 statewide, top 81%, 933 students, 73% FRL); Cypress Creek High (math 20% / reading 44%, grade F, #415 of 667 statewide, top 63%, 3,467 students, 43% FRL).
- Market conditions: Rents soft (-0.2%/yr); 344 active listings in the ZIP; 3 comparable units currently listed for rent nearby; rentals at typical pace (median 20d on market — plan ~3-4 weeks tenant-placement turnaround); solid renter incomes; 8,053 units permitted in Orange County in 2024 (3,133 in 5+ unit buildings).
Forward outlook
- Local home prices are declining (-3.0%/yr); year-one equity from $1k of loan paydown is wiped out by about $6k of value loss. Plan a longer hold.
- Orange County population projected at +52% by 2050 — long-run rental-demand tailwind backs the buy-and-hold thesis.
Negotiation context
- It's been on market 136 days — a 12% lower offer ($184k) is reasonable based on typical stale-listing flexibility.
Risks & watch-outs
- Climate carrying-cost: severe wind risk, 99% chance of damaging wind over 30y; extreme-heat days projected 7→21/yr by 2055 (HVAC capex compounding) — expect insurance premiums to compound above CPI over the hold.
Questions for the listing agent
- It's been on market 136 days. Have you received any prior offers? Is the seller open to a 15% concession, seller financing, or rate buy-down credit?
- Built in 1972 — when were the roof, HVAC, electrical panel, plumbing, and water heater last replaced?
- Why hasn't it sold? Are there any deal-killer items the seller is aware of (foundation, flood, title, zoning, code violations)?
- Is there a deadline driving the sale (1031 exchange, divorce, estate, relocation)? That informs how much negotiation room exists.
- Schools are F-rated, which usually means shorter tenancies and higher turnover. Who's the typical renter profile here, and what's been the actual vacancy rate?
- The area grade is low — what's the realistic commute time and amenity access for the typical tenant pool here? Any planned neighborhood developments (good or bad) we should know about?
- What's the average days-on-market for RENTAL listings here right now (not sales)? A rising rental-DOM trend means longer vacancies and softer asking-rent achievability than the comps imply.
- What's the recent tenant-quality profile in this submarket — average credit score on applications, eviction rate, late-payment / NSF rate, and stable-employment percentage? A property-management company in the area should have these aggregated.
- How much new for-sale + rental construction is in the pipeline within 1–3 miles? Heavy new supply typically softens prices + rents 12–24 months out; constrained supply supports both.
Investment metrics
- 1% rule
- 0.85% ✗
- Cap rate
- 6.72%
- Cash-on-cash
- 1.52%
- DSCR
- 1.07
- GRM
- 9.8
CMA / ARV
- ARV (on-the-fly)
- $104,652
- Comps found
- 1
Show comp detail 1 sale within ~0.75 mi
| Address | Dist | Beds/Ba | Sqft | Sold | Price | $/sf | Match |
|---|---|---|---|---|---|---|---|
| 214 3rd St | 0.70mi | 3/2.0 (+1) | 792 (-14%) | 19mo | $90,000 | $114 | 24 |
Match score weights: distance 35% · size 25% · config 20% · recency 20%. Top-matched comps best support the ARV.
Projected returns pro-forma
-3.0% appreciation · 0.0% rent growth · sell at horizon
- IRR
- -17.1%
- Equity multiple
- 0.41×
- Total profit
- $-34,409
- Equity at exit
- $31,163
- IRR
- -15.3%
- Equity multiple
- 0.24×
- Total profit
- $-44,260
- Equity at exit
- $18,071
Cash invested: $58,520 (down + closing). Projections, not guarantees.
Landlord ↔ Tenant lean methodology
- Overall (STATE)
- 87 Strongly Landlord-Friendly
- State Florida
- 87 Strongly Landlord-Friendly · R+3
- County
- — inherits STATE
- City
- — inherits STATE
ZIP-level market 32824
- Rents YoY
- -0.2%
- Active inventory
- 344
- Price-to-rent
- 9.8×
Monthly cashflow live
- Estimated rent
- $1,786 medium interval (Pro) →
- Mortgage (P&I)
- −$1,096
- Tax from tax record
- −$154 /mo · $1,846/yr
- Insurance
- −$87
- HOA
- −$0
- Vacancy / Maint / Mgmt
- −$375
- Net cashflow
- $74
Break-even live
Sensitivity live
| Price | -10% $193 | -5% $133 | +0% $74 | +5% $15 | +10% $-44 |
|---|---|---|---|---|---|
| Rent | -10% $-67 | -5% $4 | +0% $74 | +5% $145 | +10% $215 |
| Rate | -1.0pp $180 | -0.5pp $127 | base $74 | +0.5pp $20 | +1.0pp $-35 |
UW: 25.0% down · 7.5% · 30yr · 1.5% tax · 5.0% vac · 8.0% maint · 8.0% mgmt
Financing live
Cash to close
- Down payment
- $52,250
- Closing costs
- $6,270
- Reserves months
- —
- Total cash needed
- —
Loan-product check · same deal, 3 products live
Conventional
25% down · 7.5% · 30yr
- Down + closing
- —
- Monthly P&I
- —
- Monthly cashflow
- —
- DSCR
- —
- Eligible?
- —
Personal DTI + credit; lowest rate.
DSCR
20% down · 8.5% · 30yr
- Down + closing
- —
- Monthly P&I
- —
- Monthly cashflow
- —
- DSCR
- —
- Eligible?
- —
No personal income docs; deal must DSCR.
Hard money
10% down · 12.0% · 12mo
- Down + closing
- —
- Monthly P&I
- —
- Monthly cashflow
- —
- DSCR
- —
- Eligible?
- —
Short-term bridge; refi at stabilization.
Rent comps 3 comps
| Address | Beds | Baths | Sqft | Rent | $/sqft | DOM | Units | Dist |
|---|---|---|---|---|---|---|---|---|
| 9626 3rd Ave Unit 2 Orlando, FL | 1.0 | 1.0 | 700 | $1,395 | $1.99 | 19d | 1 | 0.25mi |
| 9663 Cypress Park Dr Unit m9663c Orlando, FL | 3.0 | 2.0 | 1056 | $1,750 | $1.66 | 19d | 1 | 0.34mi |
| 123 4th St Orlando, FL | 2.0 | 2.0 | 728 | $1,800 | $2.47 | 25d | 1 | 0.70mi |
Listing history 14 events
-
2026-06-10status $209,000 Pending 136 DOM
-
2026-06-09days on market $209,000 Active 136 DOM
-
2026-06-08days on market $209,000 Active 135 DOM
-
2026-06-07days on market $209,000 Active 134 DOM
-
2026-06-04days on market $209,000 Active 131 DOM
-
2026-06-03days on market $209,000 Active 130 DOM
-
2026-06-02days on market $209,000 Active 129 DOM
-
2026-06-02days on market $209,000 Active 128 DOM
-
2026-05-31days on market $209,000 Active 127 DOM
-
2026-04-27price $209,000
-
2026-03-30price $229,000
-
2026-02-19price $239,000
-
2026-01-27price $249,000
-
2026-01-24$219,000 Active
ⓘ Source: listings_history table (triggers on properties + properties_extension) + one-shot
backfill from property_details.listing_events for pre-trigger history.
Tax reassessment forecast FL · Resets to sale price
- Current annual tax
- $1,846 · $154/mo
- Projected year-2 tax
- $1,846 · $154/mo
- Expected delta
- $0/yr ($0/mo · 0.0%)
ⓘ Screening estimate from a state-policy table — verify with the county assessor before closing.
Climate risk First Street
- Flood 1/10 Low FEMA zone X (unshaded) · 0% chance over 30 yrs
- Wildfire 2/10 Low
- Heat 9/10 Extreme 7 d/yr ≥108°F today · 21 d/yr by 30 yrs out
- Wind 9/10 Extreme 99% chance of damaging wind over 30 yrs
- Air quality 1/10 Low 0 unhealthy d/yr today · 0 by 30 yrs out
Nearby sold comps map
Loading sold comps map…
Walkable amenities ~0.75 mi
Loading nearby amenities…
Taxation est. · year 1
- Rental income
- $21,436
- − Mortgage interest
- −$11,707
- − Property taxes
- −$1,846
- − Insurance
- −$1,045
- − Repairs & maintenance
- −$1,715
- − Management
- −$1,715
- − Depreciation
- −$6,080
- Taxable loss
- −$2,672
- Est. tax savings @ 24.0%
- +$641
- After-tax cash flow
- $1,533/yr
For passive investors: Depreciation is non-cash, so a rental often shows a tax loss while cash-flowing — sheltering income. Rental losses are passive: they offset passive income freely, and up to $25,000/yr can offset ordinary (W-2) income if you actively participate and your MAGI is under $100k (phasing out to $0 by $150k); unused losses carry forward. On sale, claimed depreciation is recaptured at up to 25%, and gains may owe capital-gains tax (a 1031 exchange can defer both). Figures are a year-1 estimate at your 24.0% rate — not tax advice; consult a CPA.
Schools (NCES district)
- District
- Orange
- NCES district ID
- 1201440
- Math proficiency
- 46% ▼ -9.00%
- Reading proficiency
- 51% ▼ -2.00%
- Median HH income
- $49,350
- Composite
- 41.47/100
- National rank
- #3461
- State rank
- #43 of 73 in FL
Livability — Taft
- Score
- 74/100
- State rank
- #275
- US rank
- #4431
Category grades
Schools grade is shown separately in the Schools card above.
Census & demographics
- Census place
- Taft, FL
- County
- Orange County · 1,471,359 people
- Metro
- Orlando-Kissimmee-Sanford, FL
- Population (ZIP)
- 58,368
- Household income
- $84,841
- Rent vs Own
- Severe rent burden
- 1015.0
Population outlook (Orange County) Hauer SSP2
- Today (2025)
- 1,618,226 people
- By 2030
- 1,787,404 · +10.5%
- By 2040
- 2,125,621 · +31.4%
- By 2050
- 2,454,016 · +51.6%
- By 2075
- 3,173,711 · +96.1%
- By 2100
- 3,607,781 · +122.9%
Race, ethnicity, and origin ACS 2023
- Neighborhood character
- Diverse neighborhood (Simpson 0.57)
- Race & ethnicity
- Hispanic / Latino 62% Two or more races 34% White 15% Black 13% Asian 6%
- Hispanic origin (detail)
- Mexican 2% Puerto Rican 26% Cuban 2% Dominican 6%
- Common ancestry
- Romanian 1% Hispanic 1% Russian 1%
- Foreign-born
- 32% · Canada, Jamaica, Vietnam
- Languages at home
- 36% English-only · Spanish 54% Other Indo-European 3% French/Haitian/Cajun 2%
Political lean MEDSL · Orange
- 2024 margin
- D (+13.6) · D 56.1% · R 42.5% · Other 1.3%
- 2008→2024 swing
- -5.0pp toward R · 2008: 18.6pp · 2024: 13.6pp
- All cycles
- 2024: D+13.6 2020: D+23.1 2016: D+24.6 2012: D+18.2 2008: D+18.6
Not yet ingested
- Civics
- —
Market trends
- HPI YoY
- ▼ -165.20%
- Current HPI
- 280.977
- Rent YoY
- ▼ -0.21%
- Metro
- Orlando-Kissimmee-Sanford, FL
- State GDP YoY
- ▲ 3.28%
- F500 in state
- 36
Industry mix (Fortune 500 HQ in FL)
| Industry | F500 HQs | Revenue |
|---|---|---|
| Industrial Technology | 2 | $29B |
|
||
| Insurance | 2 | $17B |
|
||
| Retail | 1 | $60B |
|
||
| Technology Distribution | 1 | $58B |
|
||
| Homebuilding | 1 | $35B |
|
||
| Technology Manufacturing | 1 | $35B |
|
||
Price history
-4.6% since first listed5 events — show timeline
- 2026-04-27 Price Changed $209,000 Stellar MLS as Distributed by MLS Grid
- 2026-03-30 Price Changed $229,000 Stellar MLS as Distributed by MLS Grid
- 2026-02-19 Price Changed $239,000 Stellar MLS as Distributed by MLS Grid
- 2026-01-27 Price Changed $249,000 Stellar MLS as Distributed by MLS Grid
- 2026-01-24 Listed $219,000 Stellar MLS as Distributed by MLS Grid
Property tax history
+9.7%/yrLatest (2025): $1,846 · +19.8% YoY. Source: county tax records.
Cash-flow waterfall
monthlySold comps — $/sqft
last 12 mo · ≤1 miLoading sold comps…