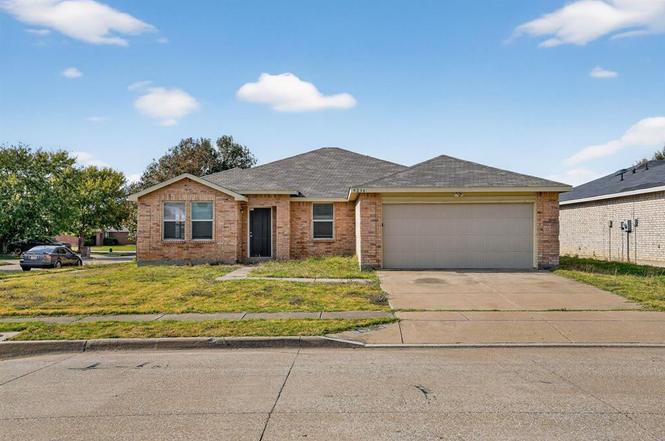
9236 Cheswick Dr · Fort Worth, TX
Flood risk 1/10 · Minimal
- FEMA flood zone
- X (unshaded)
- Chance of flooding over 30 yrs
- 0.0%
- Est. flood insurance / yr
- $507 – $1,088
Fire risk 5/10 · Moderate
- Est. fire insurance / yr
- $1,222 – $2,270
Heat risk 7/10 · Major
- Hot days now (above 108°F)
- 7 days/yr
- Hot days in 30 yrs
- 24 days/yr
Wind risk 5/10 · Moderate
- Chance of severe wind over 30 yrs
- 26.0%
Air-quality risk 3/10 · Minor
- Unhealthy air days now
- 2 days/yr
- Unhealthy air days in 30 yrs
- 3 days/yr
Risk factors via First Street. Map © Google.
Why this score? — see what drove the D grade
The composite is a weighted blend of 9 inputs, each scored 0–100. Each bar is that input's sub-score; the figure is the points it added to the 100-point composite (weight × sub-score).
- ARV discount +14.0/15.0
- Cash flow +10.7/30.0
- Livability +4.0/5.0
- 1% rule +3.9/10.0
- DSCR +3.1/10.0
- Rent growth +2.8/5.0
- Schools +2.5/10.0
- Condition / age +2.5/5.0
- Appreciation +0.0/10.0
$274,900
🖨 Deal sheet 📄 Offer letter ✓ Due diligence
Listing remarks
Beautifully maintained 4-bedroom, 2-bath home located in the Poynter Crossing community. This single-story property offers an open-concept layout with a spacious living area that connects seamlessly to the kitchen and dining space. The kitchen features granite countertops, stainless steel appliances, and a convenient breakfast nook. The primary bedroom includes an ensuite bath and a walk-in closet for ample storage. Luxury vinyl plank flooring runs throughout the main areas for durability and easy maintenance. Additional features include a 2-car garage, central HVAC, and a generously sized backyard. Conveniently situated near local schools, shopping, and major commuting routes, this home pr
Key facts
- Breakfast nook
- Walk-in closet
- Ensuite bath
Tags
Property features AI
Finance
- Other: Listing is Active Under Contract; Possession at closing/funding
- Financial info: Accepts Cash, Conventional, FHA, and VA financing; Second mortgage: No
- HOA & community: Mandatory HOA; Quarterly HOA fee of $70; HOA includes management fees; HOA managed by Community Management
Exterior
- Parking: Attached 2-car garage; 2 covered parking spaces
- Security: Security details not provided
- Utilities: City water; City sewer; Not in a municipal utility district
- Home design: Single-family residence; One-story
- Construction: Brick construction; Built in 2006; Preowned
- Exterior features: Less than 0.5 acre lot; Subdivision: Poynter Crossing Add
Interior
- Kitchen: Dishwasher
- Bedrooms: 4 bedrooms; Primary bedroom on main level
- Flooring: Flooring details not provided
- Bathrooms: 2 full bathrooms
- Heating & cooling: Heating and cooling details not provided
- Interior features: Open floorplan; Eat-in kitchen; Walk-in closet(s)
- Laundry & utility: Laundry/utility details not provided
Neighborhood map
What this means for you Summary
Snapshot
- This is a 3-bed/2.0-bath single-family listed at $275k.
Deal economics
- At list price, monthly cash flow is $-133 ($-2k/yr) — negative.
- To cash-flow at today's rent, offer at most $251k (8.5% below list).
- To meet the 1% rule (rent ≥ 1% of price), the offer needs to be $245k (10.7% below list).
- Recommended offer: $242k (12.0% below list) — sets the bar for market timing.
- Cap rate 5.7% vs local median 3.9% in Fort Worth — top-decile yield for the area; either an underpriced asset or a hidden risk that comps aren't pricing in. Stress-test before assuming the spread holds.
Location & tenants
- Location reads 80/100 on livability (#49 in TX, #1,954 nationally) — a professional / high-income tenant draw. Strengths: amenities A+, cost of living A+, housing A+; Watch: crime F.
- Crowley ISD (urban): math 23% / reading 32% proficiency, ranked #643 of 826 in TX (top 78%) — low school quality limits family demand, transient renter base, plan for 1-2y turnover.
- Zoned schools: Mary Harris El (math 27% / reading 22%, grade F, #3,052 of 4,322 statewide, top 74%, 389 students, 87% FRL) — zoned schools average 87% FRL vs 52% district-wide (35 pts higher); higher-poverty schools than district average — tighter screening recommended.
- Market conditions: Rents rising (+1.1%/yr); 364 active listings in the ZIP; 40 comparable units currently listed for rent nearby; rentals at typical pace (median 25d on market — plan ~3-4 weeks tenant-placement turnaround); 40% of comp listings sitting > 30 days — soft ceiling on asking rent; solid renter incomes; 18,938 units permitted in Tarrant County in 2024 (8,336 in 5+ unit buildings).
Forward outlook
- Local home prices are declining (-3.0%/yr); year-one equity from $2k of loan paydown is wiped out by about $8k of value loss. Plan a longer hold.
- Tarrant County population projected at +41% by 2050 — long-run rental-demand tailwind backs the buy-and-hold thesis.
Negotiation context
- It's been on market 156 days — a 12% lower offer ($242k) is reasonable based on typical stale-listing flexibility.
- 6 sale attempts since 3y ago; this cycle's ask has dropped $20k (7%) from the opening price — seller is motivated, your offer sets the floor, not the list.
Risks & watch-outs
- Climate carrying-cost: moderate wind risk, 26% chance of damaging wind over 30y; moderate wildfire risk; extreme-heat days projected 7→24/yr by 2055 (HVAC capex compounding) — expect insurance premiums to compound above CPI over the hold.
Questions for the listing agent
- What do current leases actually rent for vs. the listed asking? Can we see a recent rent roll and the last 12 months of T-12 income?
- It's been on market 156 days. Have you received any prior offers? Is the seller open to a 12% concession, seller financing, or rate buy-down credit?
- What does the HOA fee cover, when was the last increase, and are there any pending special assessments or reserve-fund shortfalls?
- Why hasn't it sold? Are there any deal-killer items the seller is aware of (foundation, flood, title, zoning, code violations)?
- Is there a deadline driving the sale (1031 exchange, divorce, estate, relocation)? That informs how much negotiation room exists.
- Schools are D-rated, which usually means shorter tenancies and higher turnover. Who's the typical renter profile here, and what's been the actual vacancy rate?
- Crime grade is F in this area — have there been break-ins, vandalism, or insurance claims at this property in the last 3 years? What carrier currently insures it and at what premium?
- The area grade is low — what's the realistic commute time and amenity access for the typical tenant pool here? Any planned neighborhood developments (good or bad) we should know about?
- What's the average days-on-market for RENTAL listings here right now (not sales)? A rising rental-DOM trend means longer vacancies and softer asking-rent achievability than the comps imply.
- What's the recent tenant-quality profile in this submarket — average credit score on applications, eviction rate, late-payment / NSF rate, and stable-employment percentage? A property-management company in the area should have these aggregated.
- How much new for-sale + rental construction is in the pipeline within 1–3 miles? Heavy new supply typically softens prices + rents 12–24 months out; constrained supply supports both.
Investment metrics
- 1% rule
- 0.89% ✗
- Cap rate
- 5.71%
- Cash-on-cash
- -2.07%
- DSCR
- 0.91
- GRM
- 9.3
CMA / ARV
- ARV (on-the-fly)
- $321,204
- Comps found
- 12
Show comp detail 12 sales within ~0.75 mi
| Address | Dist | Beds/Ba | Sqft | Sold | Price | $/sf | Match |
|---|---|---|---|---|---|---|---|
| 4312 Kyleigh Dr | 0.13mi | 4/2.0 (+1) | 2,124 (-6%) | 3mo | $280,000 | $132 | 76 |
| 3920 Golden Horn Ln | 0.44mi | 3/2.5 | 2,305 (+2%) | 1mo | $289,000 | $125 | 74 |
| 4401 Double Oak Ln | 0.31mi | 3/2.0 | 2,434 (+8%) | 1mo | $310,000 | $127 | 72 |
| 4241 Glen Abbey Dr | 0.10mi | 3/2.0 | 1,924 (-15%) | 1mo | $318,500 | $166 | 70 |
| 3916 Foxhound Ln | 0.40mi | 3/2.5 | 2,172 (-4%) | 4mo | $265,000 | $122 | 70 |
| 4312 Bower Hill Dr | 0.58mi | 4/3.0 (+1) | 2,294 (+1%) | 2mo | $379,480 | $165 | 60 |
| 8745 Fox Meadow Way | 0.62mi | 3/2.5 | 2,134 (-6%) | 3mo | $275,000 | $129 | 57 |
| 8753 Hunters Point Way | 0.66mi | 3/2.5 | 2,134 (-6%) | 2mo | $215,000 | $101 | 56 |
| 4508 Rush River Trl | 0.37mi | 4/3.0 (+1) | 2,465 (+9%) | 4mo | $350,000 | $142 | 55 |
| 9721 Mcclane Farm Dr | 0.53mi | 4/2.5 (+1) | 2,079 (-8%) | 1mo | $356,590 | $172 | 54 |
| 9708 Austin Hollow Rd | 0.60mi | 4/2.5 (+1) | 2,079 (-8%) | 1mo | $351,190 | $169 | 50 |
| 4504 Embercrest Ln | 0.61mi | 3/2.0 | 1,936 (-14%) | 1mo | $302,500 | $156 | 46 |
Match score weights: distance 35% · size 25% · config 20% · recency 20%. Top-matched comps best support the ARV.
Projected returns pro-forma
-3.0% appreciation · 1.07% rent growth · sell at horizon
- IRR
- -22.1%
- Equity multiple
- 0.25×
- Total profit
- $-57,528
- Equity at exit
- $40,988
- IRR
- -22.0%
- Equity multiple
- -0.02×
- Total profit
- $-78,855
- Equity at exit
- $23,768
Cash invested: $76,972 (down + closing). Projections, not guarantees.
Landlord ↔ Tenant lean methodology
- Overall (STATE)
- 87 Strongly Landlord-Friendly
- State Texas
- 87 Strongly Landlord-Friendly · R+5
- County
- — inherits STATE
- City
- — inherits STATE
ZIP-level market 76123
- Home prices YoY
- -17.9%
- Rents YoY
- 1.1%
- Active inventory
- 364
- Price-to-rent
- 9.3×
Monthly cashflow live
- Estimated rent
- $2,455 high interval (Pro) →
- Mortgage (P&I)
- −$1,442
- Tax from tax record
- −$493 /mo · $5,915/yr
- Insurance
- −$115
- HOA
- −$23
- Vacancy / Maint / Mgmt
- −$516
- Net cashflow
- $-133
Break-even live
UW: 25.0% down · 7.5% · 30yr · 1.5% tax · 5.0% vac · 8.0% maint · 8.0% mgmt
Financing live
Cash to close
- Down payment
- $68,725
- Closing costs
- $8,247
- Reserves months
- —
- Total cash needed
- —
Loan-product check · same deal, 3 products live
Conventional
25% down · 7.5% · 30yr
- Down + closing
- —
- Monthly P&I
- —
- Monthly cashflow
- —
- DSCR
- —
- Eligible?
- —
Personal DTI + credit; lowest rate.
DSCR
20% down · 8.5% · 30yr
- Down + closing
- —
- Monthly P&I
- —
- Monthly cashflow
- —
- DSCR
- —
- Eligible?
- —
No personal income docs; deal must DSCR.
Hard money
10% down · 12.0% · 12mo
- Down + closing
- —
- Monthly P&I
- —
- Monthly cashflow
- —
- DSCR
- —
- Eligible?
- —
Short-term bridge; refi at stabilization.
Rent comps 40 comps
| Address | Beds | Baths | Sqft | Rent | $/sqft | DOM | Units | Dist |
|---|---|---|---|---|---|---|---|---|
| 9233 Cheswick Dr Fort Worth, TX | 4.0 | 3.0 | 2250 | $3,060 | $1.36 | 43d | 1 | 0.06mi |
| 4413 Corner Brook Ln Fort Worth, TX | 4.0 | 2.0 | 1983 | $2,165 | $1.09 | 20d | 1 | 0.26mi |
| 9208 Vineyard Ln Fort Worth, TX | 3.0 | 2.0 | 1792 | $2,300 | $1.28 | 5d | 1 | 0.29mi |
| 4029 Thoroughbred Trl Fort Worth, TX | 3.0 | 2.5 | 2318 | $2,195 | $0.95 | 24d | 1 | 0.29mi |
| 4365 Mill Stream Ln Crowley, TX | 4.0 | 2.0 | 1602 | $2,300 | $1.44 | 24d | 1 | 0.35mi |
| 9505 Cypress Lake Dr Crowley, TX | 3.0 | 2.0 | 2028 | $2,670 | $1.32 | 24d | 1 | 0.37mi |
| 3952 Golden Horn Ln Fort Worth, TX | 4.0 | 2.5 | 2993 | $2,495 | $0.83 | 24d | 1 | 0.41mi |
| 4054 Hunters Creek Dr Fort Worth, TX | 3.0 | 2.0 | 1946 | $1,960 | $1.01 | 24d | 1 | 0.47mi |
| 3832 German Pointer Way Fort Worth, TX | 4.0 | 2.5 | 2532 | $3,299 | $1.30 | 5d | 1 | 0.52mi |
| 8733 Stonebriar Ln Fort Worth, TX | 4.0 | 2.5 | 2803 | $2,325 | $0.83 | 4d | 1 | 0.54mi |
| 8740 Fox Meadow Way Fort Worth, TX | 4.0 | 2.0 | 2583 | $2,985 | $1.16 | 43d | 1 | 0.62mi |
| 9512 Carson Ranch Rd Crowley, TX | 4.0 | 2.0 | 1782 | $2,995 | $1.68 | 22d | 1 | 0.65mi |
| 4021 Busch Gardens Dr Fort Worth, TX | 3.0 | 2.0 | 1748 | $1,875 | $1.07 | 24d | 1 | 0.67mi |
| 4021 Busch Gardens Dr Fort Worth, TX | 3.0 | 2.0 | 1748 | $1,875 | $1.07 | 20d | 1 | 0.67mi |
| 9717 Snowbell Ln Crowley, TX | 4.0 | 2.0 | 1928 | $2,195 | $1.14 | 22d | 1 | 0.71mi |
| 9100 Saint Barts Rd Fort Worth, TX | 4.0 | 2.0 | 1630 | $1,969 | $1.21 | 43d | 1 | 0.79mi |
| 3990 Sarasota Springs Dr Fort Worth, TX | 3.0 | 2.5 | 1766 | $1,995 | $1.13 | 24d | 1 | 0.84mi |
| 3416 Saint Vincent Rd Fort Worth, TX | 3.0 | 3.0 | 2033 | $1,895 | $0.93 | 43d | 1 | 0.85mi |
| 4725 Sassafras Dr Crowley, TX | 4.0 | 2.0 | 2067 | $2,899 | $1.40 | 43d | 1 | 0.94mi |
| 10121 Wyseby Rd Crowley, TX | 3.0 | 2.0 | 1622 | $1,995 | $1.23 | 43d | 1 | 0.96mi |
| 8304 Cornerstone Dr Fort Worth, TX | 3.0 | 2.0 | 1776 | $2,300 | $1.30 | 43d | 1 | 0.96mi |
| 9213 Saint Martin Rd Fort Worth, TX | 4.0 | 2.0 | 2302 | $2,229 | $0.97 | 5d | 1 | 0.99mi |
| 3400 Quiet Valley Rd Fort Worth, TX | 4.0 | 2.0 | 1904 | $2,100 | $1.10 | 43d | 1 | 1.00mi |
| 4353 Mountain Crest Dr Fort Worth, TX | 4.0 | 2.0 | 2432 | $2,595 | $1.07 | 5d | 1 | 1.01mi |
| 4353 Mountain Crest Dr Fort Worth, TX | 4.0 | 2.0 | 2432 | $2,649 | $1.09 | 43d | 1 | 1.01mi |
| 4428 Lodestone Ln Fort Worth, TX | 3.0 | 2.5 | 2082 | $2,300 | $1.10 | 5d | 1 | 1.02mi |
| 8713 Windblow Ct Fort Worth, TX | 4.0 | 2.5 | 2465 | $2,499 | $1.01 | 43d | 1 | 1.02mi |
| 3704 Garden Springs Dr Fort Worth, TX | 3.0 | 2.0 | 1628 | $2,799 | $1.72 | 12d | 1 | 1.04mi |
| 9808 Mescalbean Blvd Crowley, TX | 4.0 | 2.0 | 1729 | $2,150 | $1.24 | 43d | 1 | 1.05mi |
| 9157 Abaco Way Fort Worth, TX | 4.0 | 2.0 | 1705 | $2,149 | $1.26 | 43d | 1 | 1.13mi |
| 9157 Abaco Way Fort Worth, TX | 4.0 | 2.0 | 1705 | $2,089 | $1.23 | 24d | 1 | 1.13mi |
| 4013 Winter Springs Dr Fort Worth, TX | 4.0 | 2.0 | 1764 | $3,000 | $1.70 | 43d | 1 | 1.13mi |
| 4633 Benham Dr Crowley, TX | 4.0 | 2.0 | 1740 | $2,000 | $1.15 | 4d | 1 | 1.15mi |
| 4633 Benham Dr Crowley, TX | 3.0 | 2.0 | 1740 | $2,000 | $1.15 | 43d | 1 | 1.15mi |
| 4004 Arklow St Crowley, TX | 4.0 | 2.0 | 1668 | $2,200 | $1.32 | 24d | 1 | 1.15mi |
| 4004 Arklow St Crowley, TX | 4.0 | 2.0 | 1668 | $2,200 | $1.32 | 5d | 1 | 1.15mi |
| 4224 Old Timber Ln Crowley, TX | 3.0 | 2.0 | 2092 | $2,250 | $1.08 | 43d | 1 | 1.16mi |
| 8217 Miami Springs Dr Fort Worth, TX | 3.0 | 2.0 | 1996 | $1,950 | $0.98 | 24d | 1 | 1.17mi |
| 9720 Buffalo Ridge Rd Crowley, TX | 4.0 | 2.0 | 1838 | $2,400 | $1.31 | 24d | 1 | 1.18mi |
| 9724 Buffalo Ridge Rd Crowley, TX | 4.0 | 2.0 | 2004 | $2,125 | $1.06 | 43d | 1 | 1.18mi |
HOA detail
- Monthly dues
- $23 · $276/yr
Listing history 25 events
-
2026-05-01status Pending
-
2026-04-23historical Active Option Contract
-
2026-04-14price $274,900
-
2026-03-06price $279,900
-
2026-02-02price $285,000
-
2025-11-26$295,000 Active
-
2024-09-19historical $2,045
-
2024-09-17$2,045
-
2024-08-29historical $2,250
-
2024-08-15$2,250
-
2024-07-18historical
-
2024-06-25price $304,500
-
2024-05-31$309,900 Active
-
2024-05-15historical $2,425
-
2024-05-08price $2,425
-
2024-05-01price $2,485
-
2024-04-25price $2,495
-
2024-04-06
-
2023-12-16historical
-
2023-12-14
-
2023-07-25historical
-
2021-10-08soldstatus
-
2021-06-28soldstatus
-
2019-04-17soldstatus
-
2016-10-26soldstatus
ⓘ Source: listings_history table (triggers on properties + properties_extension) + one-shot
backfill from property_details.listing_events for pre-trigger history.
Tax reassessment forecast TX · Resets to sale price
- Current annual tax
- $5,915 · $493/mo
- Projected year-2 tax
- $5,915 · $493/mo
- Expected delta
- $0/yr ($0/mo · 0.0%)
ⓘ Screening estimate from a state-policy table — verify with the county assessor before closing.
Climate risk First Street
- Flood 1/10 Low FEMA zone X (unshaded) · 0% chance over 30 yrs
- Wildfire 5/10 Major
- Heat 7/10 Severe 7 d/yr ≥108°F today · 24 d/yr by 30 yrs out
- Wind 5/10 Major 26% chance of damaging wind over 30 yrs
- Air quality 3/10 Moderate 2 unhealthy d/yr today · 3 by 30 yrs out
Nearby sold comps map
Loading sold comps map…
Walkable amenities ~0.75 mi
Loading nearby amenities…
Taxation est. · year 1
- Rental income
- $29,459
- − Mortgage interest
- −$15,399
- − Property taxes
- −$5,915
- − Insurance
- −$1,374
- − Repairs & maintenance
- −$2,357
- − Management
- −$2,357
- − HOA
- −$276
- − Depreciation
- −$7,997
- Taxable loss
- −$6,215
- Est. tax savings @ 24.0%
- +$1,492
- After-tax cash flow
- $-100/yr
For passive investors: Depreciation is non-cash, so a rental often shows a tax loss while cash-flowing — sheltering income. Rental losses are passive: they offset passive income freely, and up to $25,000/yr can offset ordinary (W-2) income if you actively participate and your MAGI is under $100k (phasing out to $0 by $150k); unused losses carry forward. On sale, claimed depreciation is recaptured at up to 25%, and gains may owe capital-gains tax (a 1031 exchange can defer both). Figures are a year-1 estimate at your 24.0% rate — not tax advice; consult a CPA.
Schools (NCES district)
- District
- Crowley ISD
- NCES district ID
- 4815910
- Math proficiency
- 23% ▼ -15.00%
- Reading proficiency
- 32% ▼ -6.00%
- Median HH income
- $59,810
- Composite
- 25.04/100
- National rank
- #7549
- State rank
- #643 of 826 in TX
Livability — Fort Worth
- Score
- 80/100
- State rank
- #49
- US rank
- #1954
Category grades
Schools grade is shown separately in the Schools card above.
Census & demographics
- Census place
- Fort Worth, TX
- County
- Tarrant County · 2,033,669 people
- City population
- 911,619
- Metro
- Dallas-Fort Worth-Arlington, TX
- Population (ZIP)
- 42,957
- Household income
- $102,768
- Rent vs Own
- Severe rent burden
- 975.0
Population outlook (Tarrant County) Hauer SSP2
- Today (2025)
- 2,380,417 people
- By 2030
- 2,578,900 · +8.3%
- By 2040
- 2,974,995 · +25.0%
- By 2050
- 3,350,489 · +40.8%
- By 2075
- 4,216,909 · +77.2%
- By 2100
- 4,741,527 · +99.2%
Race, ethnicity, and origin ACS 2023
- Neighborhood character
- Highly diverse neighborhood (Simpson 0.73)
- Race & ethnicity
- Black 37% Hispanic / Latino 26% White 24% Two or more races 15% Asian 8%
- Hispanic origin (detail)
- Mexican 22%
- Common ancestry
- Italian 1% Romanian 1% Slovak 1%
- Foreign-born
- 17% · Canada, Vietnam, Jamaica
- Languages at home
- 75% English-only · Spanish 16% Other Indo-European 3% Vietnamese 2%
Political lean MEDSL · Tarrant
- 2024 margin
- Lean R (+5.1) · D 46.7% · R 51.9% · Other 1.4%
- 2008→2024 swing
- +6.6pp toward D · 2008: -11.7pp · 2024: -5.1pp
- All cycles
- 2024: R+5.1 2020: D+0.2 2016: R+8.7 2012: R+15.7 2008: R+11.7
Not yet ingested
- Civics
- —
Market trends
- HPI YoY
- ▼ -50.54%
- Current HPI
- 231.1377
- Rent YoY
- ▲ 1.07%
- Metro
- Dallas-Fort Worth-Arlington, TX
- State GDP YoY
- ▲ 3.95%
- F500 in state
- 110
Industry mix (Fortune 500 HQ in TX)
| Industry | F500 HQs | Revenue |
|---|---|---|
| Energy | 16 | $1,198B |
|
||
| Technology | 5 | $198B |
|
||
| Engineering / Construction | 4 | $72B |
|
||
| Energy Services | 3 | $60B |
|
||
| Utilities | 3 | $41B |
|
||
| Healthcare | 2 | $330B |
|
||
Price history
+10918.0% since first listed25 events — show timeline
- 2026-05-01 Pending — NTREIS
- 2026-04-23 Contingent — NTREIS
- 2026-04-14 Price Changed $274,900 NTREIS
- 2026-03-06 Price Changed $279,900 NTREIS
- 2026-02-02 Price Changed $285,000 NTREIS
- 2025-11-26 Listed $295,000 NTREIS
- 2024-09-19 Rental Removed $2,045 RENTLY
- 2024-09-17 Listed for Rent $2,045 RENTLY
- 2024-08-29 Rental Removed $2,250 RENTLY
- 2024-08-15 Listed for Rent $2,250 RENTLY
- 2024-07-18 Listing Removed — NTREIS
- 2024-06-25 Price Changed $304,500 NTREIS
- 2024-05-31 Listed $309,900 NTREIS
- 2024-05-15 Rental Removed $2,425 RENTLY
- 2024-05-08 Price Changed $2,425 RENTLY
- 2024-05-01 Price Changed $2,485 RENTLY
- 2024-04-25 Price Changed $2,495 RENTLY
- 2024-04-06 Listed for Rent — RENTLY
- 2023-12-16 Rental Removed — RENTLY
- 2023-12-14 Listed for Rent — RENTLY
- 2023-07-25 Rental Removed — RENTLY
- 2021-10-08 Sold (Public Records) — Public Records
- 2021-06-28 Sold (Public Records) — Public Records
- 2019-04-17 Sold (Public Records) — Public Records
- 2016-10-26 Sold (Public Records) — Public Records
Property tax history
+4.3%/yrLatest (2025): $5,915 · -15.9% YoY. Source: county tax records.
Cash-flow waterfall
monthlySold comps — $/sqft
last 12 mo · ≤1 miLoading sold comps…