 🏗️ New Construction
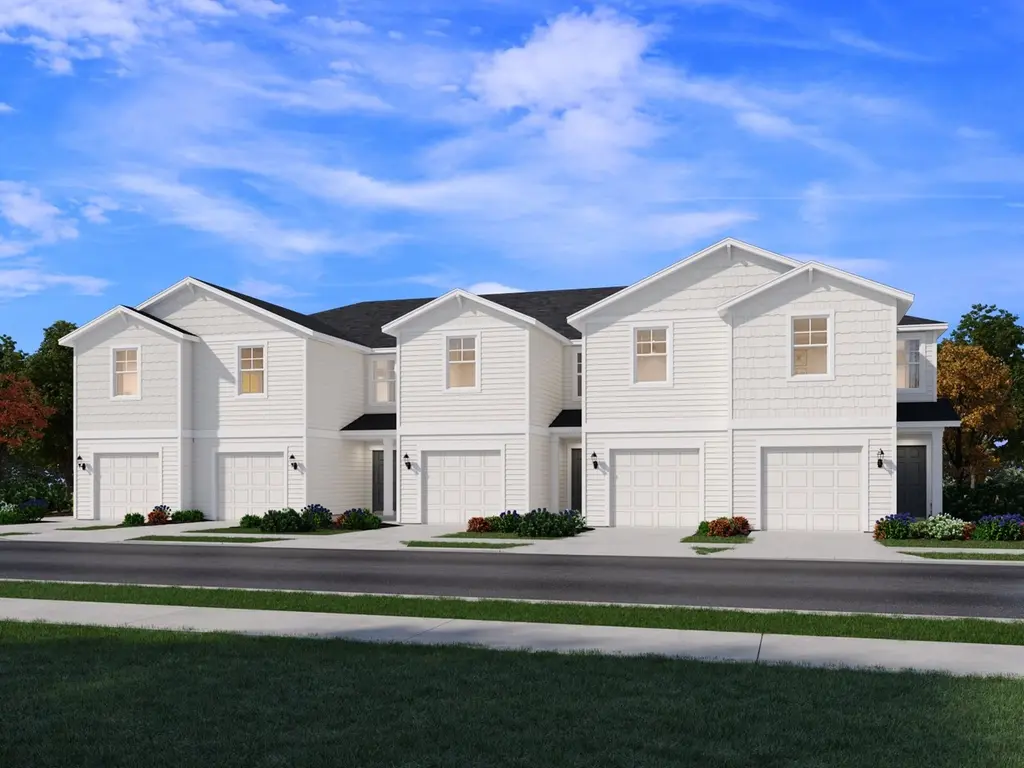
Lennox Plan · Oakleaf Plantation, FL
Flood risk No data
- FEMA flood zone
- —
- Chance of flooding over 30 yrs
- —
- Est. flood insurance / yr
- —
Fire risk No data
- Est. fire insurance / yr
- —
Heat risk No data
- Hot days now (above threshold)
- —
- Hot days in 30 yrs
- —
Wind risk No data
- Chance of severe wind over 30 yrs
- —
Air-quality risk No data
- Unhealthy air days now
- —
- Unhealthy air days in 30 yrs
- —
Risk factors via First Street. Map © Google.
Why this score? — see what drove the D grade
The composite is a weighted blend of 9 inputs, each scored 0–100. Each bar is that input's sub-score; the figure is the points it added to the 100-point composite (weight × sub-score).
- Cash flow +11.6/30.0
- ARV discount +7.5/15.0
- Schools +5.1/10.0
- Condition / age +5.0/5.0
- Livability +3.5/5.0
- 1% rule +3.4/10.0
- DSCR +3.4/10.0
- Rent growth +3.3/5.0
- Appreciation +0.0/10.0
$264,990
🖨 Deal sheet (PDF) 📄 Offer letter ✓ Due diligence
Listing remarks
The Lennox offers 1,482 sq. ft. of modern living with 3 bedrooms and 2.5 baths. Its open layout connects the kitchen, dining, and great room for effortless entertaining, while the upstairs primary suite and laundry add everyday convenience.
Key facts
- Parking
- Listed 93 days
Property features AI
Finance
- Financial info: List price $259,990
Exterior
- Home design: Single-family plan (Lennox); Address: Middleburg, FL
- Construction: New construction
- Exterior features: Living area approximately 1,482
Interior
- Bedrooms: 3 bedrooms
- Bathrooms: 2 full bathrooms and 1 half bathroom (2.5 total)
- Interior features: Plan: Lennox; New construction plan
Neighborhood map
What this means for you Summary
Snapshot
- This is a 3-bed/2.5-bath single-family listed at $265k. Condition is rated excellent.
Deal economics
- At list price, monthly cash flow is $-83 ($-995/yr) — negative.
- To cash-flow at today's rent, offer at most $261k (1.6% below list).
- To meet the 1% rule (rent ≥ 1% of price), the offer needs to be $228k (13.9% below list).
- Recommended offer: $228k (13.9% below list) — sets the bar for 1% rule.
- Cap rate 5.9% vs local median 4.0% in Oakleaf Plantation — top-decile yield for the area; either an underpriced asset or a hidden risk that comps aren't pricing in. Stress-test before assuming the spread holds.
Location & tenants
- Location reads 70/100 on livability (#446 in FL) — a middle-class / working-renter tenant base. Strengths: employment A+, housing A+, crime B+; Watch: amenities F, commute F, health & safety F.
- Clay (suburban): math 58% / reading 59% proficiency, ranked #14 of 73 in FL (top 19%) — acceptable for families but not a draw, mixed tenant base, ~2y average lease.
- Zoned schools: Tynes Elementary School (math 65% / reading 63%, grade B, #552 of 2,144 statewide, top 26%, 1,021 students, 43% FRL); Wilkinson Junior High School (math 54% / reading 49%, grade C, #232 of 571 statewide, top 41%, 752 students, 100% FRL); Oakleaf High School (math 47% / reading 53%, grade D+, #175 of 667 statewide, top 27%, 2,371 students, 36% FRL) — zoned schools average 60% FRL vs 35% district-wide (25 pts higher); higher-poverty schools than district average — tighter screening recommended.
- Market conditions: Rents rising (+3.4%/yr); 610 active listings in the ZIP; 8 comparable units currently listed for rent nearby; rentals leasing fast (median 5d on market — plan ~1-2 weeks tenant-placement turnaround); solid renter incomes; 1,876 units permitted in Clay County in 2024 (14 in 5+ unit buildings).
- This rent runs 32% of the median local income ($84k/yr) — at the standard rent-burdened threshold; future hikes will face affordability resistance.
Forward outlook
- Local home prices are declining (-3.0%/yr); year-one equity from $2k of loan paydown is wiped out by about $8k of value loss. Plan a longer hold.
- Clay County population projected at +19% by 2050 — long-run rental-demand tailwind backs the buy-and-hold thesis.
Negotiation context
- It's been on market 93 days — a 9% lower offer ($241k) is reasonable based on typical stale-listing flexibility.
Questions for the listing agent
- What do current leases actually rent for vs. the listed asking? Can we see a recent rent roll and the last 12 months of T-12 income?
- It's been on market 93 days. Have you received any prior offers? Is the seller open to a 14% concession, seller financing, or rate buy-down credit?
- Why hasn't it sold? Are there any deal-killer items the seller is aware of (foundation, flood, title, zoning, code violations)?
- Is there a deadline driving the sale (1031 exchange, divorce, estate, relocation)? That informs how much negotiation room exists.
- The area grade is low — what's the realistic commute time and amenity access for the typical tenant pool here? Any planned neighborhood developments (good or bad) we should know about?
- What's the average days-on-market for RENTAL listings here right now (not sales)? A rising rental-DOM trend means longer vacancies and softer asking-rent achievability than the comps imply.
- What's the recent tenant-quality profile in this submarket — average credit score on applications, eviction rate, late-payment / NSF rate, and stable-employment percentage? A property-management company in the area should have these aggregated.
- How much new for-sale + rental construction is in the pipeline within 1–3 miles? Heavy new supply typically softens prices + rents 12–24 months out; constrained supply supports both.
Investment metrics
- 1% rule
- 0.84% ✗
- Cap rate
- 5.93%
- Cash-on-cash
- -1.30%
- DSCR
- 0.94
- GRM
- 10.0
CMA / ARV
- ARV (on-the-fly)
- $272,688
- Comps found
- 10
Show comp detail 10 sales within ~0.75 mi
| Address | Dist | Beds/Ba | Sqft | Sold | Price | $/sf | Match |
|---|---|---|---|---|---|---|---|
| 3467 Lynn Ct | 0.32mi | 4/2.0 (+1) | 1,488 (+0%) | 15mo | $262,500 | $176 | 65 |
| 3305 New Beginnings Ln | 0.33mi | 3/2.0 | 1,352 (-9%) | 5mo | $240,000 | $178 | 64 |
| 3548 Grayson Ln | 0.37mi | 3/2.0 | 1,557 (+5%) | 13mo | $287,000 | $184 | 62 |
| 762 Celebration Ln | 0.34mi | 3/2.5 | 1,637 (+10%) | 14mo | $289,000 | $177 | 55 |
| 916 Rooster Hollow Way | 0.51mi | 3/2.0 | 1,590 (+7%) | 10mo | $348,000 | $219 | 54 |
| 3468 Kindlewood Dr | 0.56mi | 3/2.0 | 1,590 (+7%) | 10mo | $362,000 | $228 | 52 |
| 724 Sunny Stroll Dr | 0.43mi | 4/2.0 (+1) | 1,695 (+14%) | 1mo | $291,000 | $172 | 48 |
| 3396 Green Oaks Ln | 0.62mi | 3/2.0 | 1,384 (-7%) | 14mo | $230,000 | $166 | 47 |
| 628 Sunny Stroll Dr | 0.34mi | 3/2.0 | 1,272 (-14%) | 18mo | $265,000 | $208 | 44 |
| 3248 Roundabout Dr | 0.34mi | 3/2.0 | 1,272 (-14%) | 21mo | $268,000 | $211 | 41 |
Match score weights: distance 35% · size 25% · config 20% · recency 20%. Top-matched comps best support the ARV.
Projected returns pro-forma
-3.0% appreciation · 3.35% rent growth · sell at horizon
- IRR
- -18.0%
- Equity multiple
- 0.36×
- Total profit
- $-48,629
- Equity at exit
- $40,659
- IRR
- -9.6%
- Equity multiple
- 0.40×
- Total profit
- $-45,676
- Equity at exit
- $23,577
Cash invested: $76,353 (down + closing). Projections, not guarantees.
Landlord ↔ Tenant lean methodology
- Overall (STATE)
- 87 Strongly Landlord-Friendly
- State Florida
- 87 Strongly Landlord-Friendly · R+3
- County
- — inherits STATE
- City
- — inherits STATE
ZIP-level market 32068
- Home prices YoY
- -27.5%
- Rents YoY
- 3.4%
- Active inventory
- 610
- Price-to-rent
- 9.7×
Monthly cashflow live
- Estimated rent
- $2,280 high interval (Pro) →
- Mortgage (P&I)
- −$1,430
- Tax est. 1.5%
- −$341 /mo · $4,090/yr
- Insurance
- −$114
- HOA
- −$0
- Vacancy / Maint / Mgmt
- −$479
- Net cashflow
- $-83
Break-even live
Sensitivity live
| Price | -10% $106 | -5% $11 | +0% $-83 | +5% $-177 | +10% $-271 |
|---|---|---|---|---|---|
| Rent | -10% $-263 | -5% $-173 | +0% $-83 | +5% $7 | +10% $97 |
| Rate | -1.0pp $54 | -0.5pp $-14 | base $-83 | +0.5pp $-154 | +1.0pp $-225 |
UW: 25.0% down · 7.5% · 30yr · 1.5% tax · 5.0% vac · 8.0% maint · 8.0% mgmt
Financing live
Cash to close
- Down payment
- $68,172
- Closing costs
- $8,181
- Reserves months
- —
- Total cash needed
- —
Loan-product check · same deal, 3 products live
Conventional
25% down · 7.5% · 30yr
- Down + closing
- —
- Monthly P&I
- —
- Monthly cashflow
- —
- DSCR
- —
- Eligible?
- —
Personal DTI + credit; lowest rate.
DSCR
20% down · 8.5% · 30yr
- Down + closing
- —
- Monthly P&I
- —
- Monthly cashflow
- —
- DSCR
- —
- Eligible?
- —
No personal income docs; deal must DSCR.
Hard money
10% down · 12.0% · 12mo
- Down + closing
- —
- Monthly P&I
- —
- Monthly cashflow
- —
- DSCR
- —
- Eligible?
- —
Short-term bridge; refi at stabilization.
Rent comps 8 comps
| Address | Beds | Baths | Sqft | Rent | $/sqft | DOM | Units | Dist |
|---|---|---|---|---|---|---|---|---|
| 3608 York Ln Middleburg, FL | 3.0 | 2.5 | 1624 | $2,299 | $1.42 | 3d | 121 | 0.09mi |
| 728 Sunny Stroll Dr Middleburg, FL | 4.0 | 2.0 | 1860 | $2,200 | $1.18 | 25d | 1 | 0.41mi |
| 903 Rivertree Pl Middleburg, FL | 2.0 | 2.5 | 1160 | $1,665 | $1.44 | 0d | 1 | 0.47mi |
| 824 Integra Park Dr Middleburg, FL | 1.0–3.0 | 1.0–2.0 | 1047 | $2,258 | $2.16 | 4d | 10 | 0.65mi |
| 3938 Bloomfield Ct Middleburg, FL | 3.0 | 2.5 | 1715 | $2,275 | $1.33 | 19d | 1 | 1.18mi |
| 670 Grover Ln Orange Park, FL | 3.0 | 2.5 | 1704 | $2,100 | $1.23 | 25d | 1 | 1.27mi |
| 3764 Athenian Way Middleburg, FL | 3.0 | 2.5 | 1433 | $1,900 | $1.33 | 5d | 1 | 1.40mi |
| 3750 Silver Bluff Blvd Orange Park, FL | 2.0–3.0 | 2.0–3.0 | 1862 | $1,850 | $0.99 | 4d | 2 | 1.46mi |
Listing history 14 events
-
2026-06-21days on market $264,990 Active 93 DOM
-
2026-06-18days on market $264,990 Active 90 DOM
-
2026-06-17days on market $264,990 Active 89 DOM
-
2026-06-16days on market $264,990 Active 88 DOM
-
2026-06-15days on market $264,990 Active 87 DOM
-
2026-06-13days on market $264,990 Active 85 DOM
-
2026-06-13days on market $264,990 Active 84 DOM
-
2026-06-09days on market $264,990 Active 81 DOM
-
2026-06-08days on market $264,990 Active 80 DOM
-
2026-06-07days on market $264,990 Active 79 DOM
-
2026-06-03days on market $264,990 Active 75 DOM
-
2026-06-02days on market $264,990 Active 74 DOM
-
2026-06-01days on market $264,990 Active 73 DOM
-
2026-05-31days on market $264,990 Active 72 DOM
ⓘ Source: listings_history table (triggers on properties + properties_extension) + one-shot
backfill from property_details.listing_events for pre-trigger history.
Nearby sold comps map
Loading sold comps map…
Walkable amenities ~0.75 mi
Loading nearby amenities…
Taxation est. · year 1
- Rental income
- $27,365
- − Mortgage interest
- −$15,275
- − Property taxes
- −$4,090
- − Insurance
- −$1,363
- − Repairs & maintenance
- −$2,189
- − Management
- −$2,189
- − Depreciation
- −$7,933
- Taxable loss
- −$5,674
- Est. tax savings @ 24.0%
- +$1,362
- After-tax cash flow
- $367/yr
For passive investors: Depreciation is non-cash, so a rental often shows a tax loss while cash-flowing — sheltering income. Rental losses are passive: they offset passive income freely, and up to $25,000/yr can offset ordinary (W-2) income if you actively participate and your MAGI is under $100k (phasing out to $0 by $150k); unused losses carry forward. On sale, claimed depreciation is recaptured at up to 25%, and gains may owe capital-gains tax (a 1031 exchange can defer both). Figures are a year-1 estimate at your 24.0% rate — not tax advice; consult a CPA.
Condition & rehab AI · 12 photos
This home is in excellent condition with no visible repairs needed. It offers a modern and well-maintained living space with potential for further value through landscaping and smart home integration.
Value-add opportunities
- Both Landscaping and curb appeal — Enhances curb appeal and can attract more buyers
- Both Add a smart home system — Improves convenience and can be a selling point
Renovation cost estimate screening
Value-add ROI direction
- Both Landscaping and curb appeal — Enhances curb appeal and can attract more buyers ↑
- Both Add a smart home system — Improves convenience and can be a selling point ↑
ⓘ Cost ranges are severity-bucket heuristics (US national rule-of-thumb). Get contractor quotes + a written scope before underwriting a rehab budget.
Schools (NCES district)
- District
- Clay
- NCES district ID
- 1200300
- Math proficiency
- 58% ▼ -8.00%
- Reading proficiency
- 59% ▼ -3.00%
- Median HH income
- $59,379
- Composite
- 50.73/100
- National rank
- #1815
- State rank
- #14 of 73 in FL
Livability — Oakleaf Plantation
- Score
- 70/100
- State rank
- #446
- US rank
- #8083
Category grades
Schools grade is shown separately in the Schools card above.
Census & demographics
- Census place
- Oakleaf Plantation, FL
- County
- Clay County · 208,450 people
- City population
- 40,366
- Metro
- Jacksonville, FL
- Population (ZIP)
- 58,983
- Household income
- $84,431
- Rent vs Own
- Severe rent burden
- 975.0
Population outlook (Clay County) Hauer SSP2
- Today (2025)
- 230,495 people
- By 2030
- 242,427 · +5.2%
- By 2040
- 262,244 · +13.8%
- By 2050
- 275,148 · +19.4%
- By 2075
- 295,397 · +28.2%
- By 2100
- 287,592 · +24.8%
Race, ethnicity, and origin ACS 2023
- Neighborhood character
- Predominantly White (74%)
- Race & ethnicity
- White 74% Hispanic / Latino 13% Two or more races 10% Black 7%
- Hispanic origin (detail)
- Mexican 2% Puerto Rican 5%
- Common ancestry
- Slovak 2% Romanian 2% Lithuanian 2%
- Foreign-born
- 7% · Canada, Jamaica
- Languages at home
- 87% English-only · Spanish 9% Arabic 1% German/W. Germanic 1%
Political lean MEDSL · Clay
- 2024 margin
- Solid R (+39.3) · D 29.9% · R 69.2%
- 2008→2024 swing
- +3.6pp toward D · 2008: -42.8pp · 2024: -39.3pp
- All cycles
- 2024: R+39.3 2020: R+37.1 2016: R+44.3 2012: R+45.8 2008: R+42.8
Not yet ingested
- Civics
- —
Market trends
- HPI YoY
- ▼ -115.99%
- Current HPI
- 305.2531
- Rent YoY
- ▲ 3.35%
- Metro
- Jacksonville, FL
- State GDP YoY
- ▲ 3.28%
- F500 in state
- 36
Industry mix (Fortune 500 HQ in FL)
| Industry | F500 HQs | Revenue |
|---|---|---|
| Industrial Technology | 2 | $29B |
|
||
| Insurance | 2 | $17B |
|
||
| Retail | 1 | $60B |
|
||
| Technology Distribution | 1 | $58B |
|
||
| Homebuilding | 1 | $35B |
|
||
| Technology Manufacturing | 1 | $35B |
|
||
Cash-flow waterfall
monthlySold comps — $/sqft
last 12 mo · ≤1 miLoading sold comps…