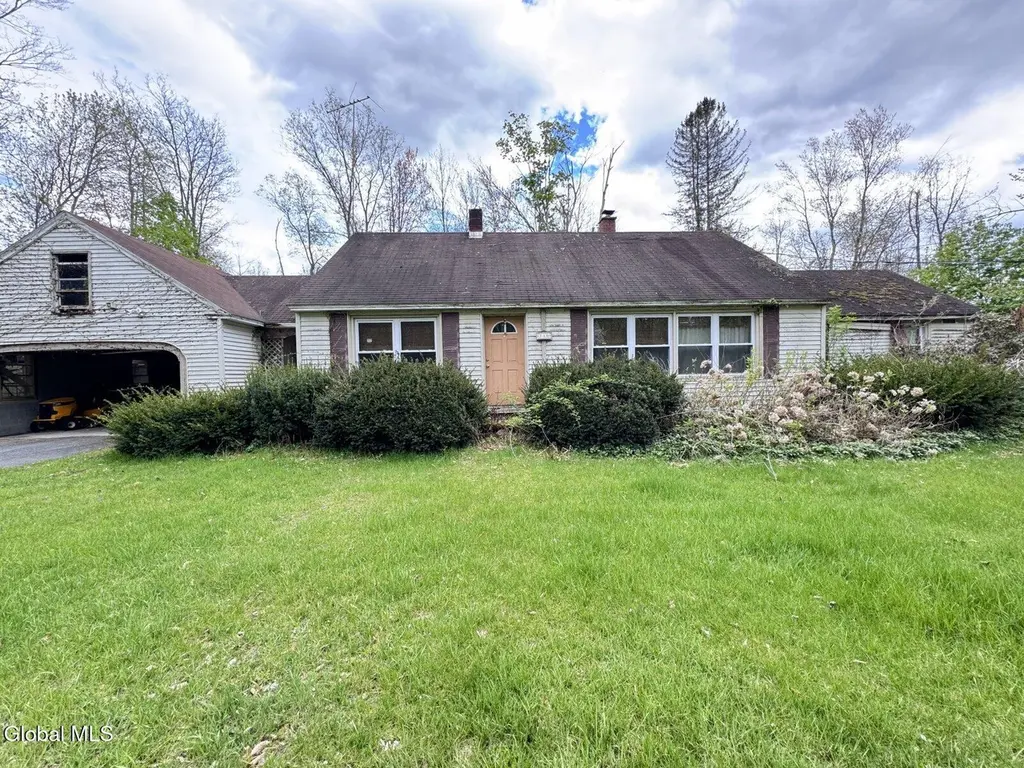
140 Clark Rd · West Glens Falls, NY
Flood risk 1/10 · Minimal
- FEMA flood zone
- X
- Chance of flooding over 30 yrs
- 0.0%
- Est. flood insurance / yr
- $473 – $860
Fire risk 2/10 · Minimal
- Est. fire insurance / yr
- $691 – $1,283
Heat risk 3/10 · Minor
- Hot days now (above 97°F)
- 7 days/yr
- Hot days in 30 yrs
- 16 days/yr
Wind risk 2/10 · Minimal
- Chance of severe wind over 30 yrs
- 3.0%
Air-quality risk 1/10 · Minimal
- Unhealthy air days now
- 0 days/yr
- Unhealthy air days in 30 yrs
- 0 days/yr
Risk factors via First Street. Map © Google.
Why this score? — see what drove the B+ grade
The composite is a weighted blend of 9 inputs, each scored 0–100. Each bar is that input's sub-score; the figure is the points it added to the 100-point composite (weight × sub-score).
- Cash flow +29.5/30.0
- DSCR +10.0/10.0
- Appreciation +8.9/10.0
- 1% rule +8.3/10.0
- ARV discount +7.5/15.0
- Schools +4.7/10.0
- Livability +3.6/5.0
- Rent growth +2.5/5.0
- Condition / age +1.0/5.0
$110,000
🖨 Deal sheet 📄 Offer letter ✓ Due diligence
Listing remarks
Multiple offers received. Highest and best offers are due by 5/14 at 11:00 AM. ATTENTION INVESTORS: 3-bedroom, 1-bath fixer-upper with endless potential! Located in the sought-after South Glens Falls school district, this rehab-ready home features a 2-car attached garage and is conveniently situated just 10 minutes from Interstate 87. With some creative vision and design, the layout offers the potential to transform into a spacious 4-bedroom, 2-bath home. Great opportunity for investors, flippers CASH BUYERS ONLY - ASSIGNMENT OF CONTRACT
Key facts
- Rehab ready home
- Attached garage
- 0.64 acre lot
Tags
Property features AI
Exterior
- Parking: Attached 2-car garage; Two total parking spaces
- Utilities: Septic tank
- Home design: Single family residence
- Construction: Vinyl siding
- Exterior features: Shingle roof; Other exterior features
Interior
- Kitchen: Oven; Range; Refrigerator
- Bedrooms: Three bedrooms on the first floor; One additional room on the second floor (other use)
- Bathrooms: One full bathroom on the first floor
- Heating & cooling: Forced air heating (oil); Cooling present (unspecified type)
- Interior features: Seven total rooms; Full unfinished basement
- Laundry & utility: Laundry in basement
Neighborhood map
What this means for you Summary
Snapshot
- This is a 3-bed/1.0-bath single-family listed at $110k. Condition is rated poor.
Deal economics
- At list price, monthly cash flow is $394 ($5k/yr) — positive.
- The deal already cash-flows at list — no discount required.
- Meets the 1% rule at list price ($1k rent vs $110k).
- Cap rate 10.6% vs local median 2.4% in West Glens Falls — top-decile yield for the area; either an underpriced asset or a hidden risk that comps aren't pricing in. Stress-test before assuming the spread holds.
Location & tenants
- Location reads 71/100 on livability (#388 in NY) — a middle-class / working-renter tenant base. Strengths: employment A+, housing A+, health & safety A+; Watch: crime C-, cost of living C-, amenities F.
- South Glens Falls Central School District (suburban): math 49% / reading 59% proficiency, ranked #307 of 590 in NY (top 52%) — acceptable for families but not a draw, mixed tenant base, ~2y average lease.
- Zoned schools: South Glens Falls Senior High School (math 92% / reading 91%, grade A+, #197 of 1,100 statewide, top 18%, 908 students, 36% FRL).
- Zoned-school proficiency averages 92% at this address vs 54% district-wide (+38 pts) — the actual schools serving this property are materially stronger than the South Glens Falls Central School District average implies; a family-tenant draw the district grade alone would hide.
- Market conditions: 32 active listings in the ZIP; 1,132 units permitted in Saratoga County in 2024 (378 in 5+ unit buildings).
Forward outlook
- In year one you build about $9k of equity ($761 loan paydown + $9k appreciation (7.9% local appreciation)).
- Saratoga County population projected at +4% by 2050 — modest demand growth; plan on rents tracking national, not racing it.
- At projected returns (7.9% appreciation + 3.0% rent growth), your $31k cash investment doubles in ~3 years — after that, you're playing with house money.
- By year 4, paydown + projected appreciation supports a ~$33k cash-out refi (75% LTV) — recoverable capital for the next deal without selling this one.
Negotiation context
- Only 3 days on market — expect competitive offers; lowballing is unlikely to land.
Questions for the listing agent
- Have any recent inspections been done? Can we get a copy of the seller's disclosures and any deferred-maintenance estimates?
- Built in 1963 — when were the roof, HVAC, electrical panel, plumbing, and water heater last replaced?
- Is there a deadline driving the sale (1031 exchange, divorce, estate, relocation)? That informs how much negotiation room exists.
- Schools are F-rated, which usually means shorter tenancies and higher turnover. Who's the typical renter profile here, and what's been the actual vacancy rate?
- What's the average days-on-market for RENTAL listings here right now (not sales)? A rising rental-DOM trend means longer vacancies and softer asking-rent achievability than the comps imply.
- What's the recent tenant-quality profile in this submarket — average credit score on applications, eviction rate, late-payment / NSF rate, and stable-employment percentage? A property-management company in the area should have these aggregated.
- How much new for-sale + rental construction is in the pipeline within 1–3 miles? Heavy new supply typically softens prices + rents 12–24 months out; constrained supply supports both.
Investment metrics
- 1% rule
- 1.33% ✓
- Cap rate
- 10.60%
- Cash-on-cash
- 15.37%
- DSCR
- 1.68
- GRM
- 6.3
CMA / ARV
No comps found within radius.
Projected returns pro-forma
7.89% appreciation · 3.0% rent growth · sell at horizon
- IRR
- 31.8%
- Equity multiple
- 3.26×
- Total profit
- $69,646
- Equity at exit
- $82,711
- IRR
- 28.4%
- Equity multiple
- 6.96×
- Total profit
- $183,429
- Equity at exit
- $163,368
Cash invested: $30,800 (down + closing). Projections, not guarantees.
Landlord ↔ Tenant lean methodology
- Overall (STATE)
- 15 Strongly Tenant-Friendly
- State New York
- 15 Strongly Tenant-Friendly · D+10
- County
- — inherits STATE
- City
- — inherits STATE
ZIP-level market 12803
- Home prices YoY
- 2.3%
- Active inventory
- 32
- Price-to-rent
- 6.3×
Monthly cashflow live
- Estimated rent
- $1,461 medium interval (Pro) →
- Mortgage (P&I)
- −$577
- Tax est. 1.5%
- −$138 /mo · $1,650/yr
- Insurance
- −$46
- HOA
- −$0
- Vacancy / Maint / Mgmt
- −$307
- Net cashflow
- $394
Break-even live
UW: 25.0% down · 7.5% · 30yr · 1.5% tax · 5.0% vac · 8.0% maint · 8.0% mgmt
Financing live
Cash to close
- Down payment
- $27,500
- Closing costs
- $3,300
- Reserves months
- —
- Total cash needed
- —
Loan-product check · same deal, 3 products live
Conventional
25% down · 7.5% · 30yr
- Down + closing
- —
- Monthly P&I
- —
- Monthly cashflow
- —
- DSCR
- —
- Eligible?
- —
Personal DTI + credit; lowest rate.
DSCR
20% down · 8.5% · 30yr
- Down + closing
- —
- Monthly P&I
- —
- Monthly cashflow
- —
- DSCR
- —
- Eligible?
- —
No personal income docs; deal must DSCR.
Hard money
10% down · 12.0% · 12mo
- Down + closing
- —
- Monthly P&I
- —
- Monthly cashflow
- —
- DSCR
- —
- Eligible?
- —
Short-term bridge; refi at stabilization.
Listing history 2 events
-
2026-05-14status Pending
-
2026-05-11$110,000 Active
ⓘ Source: listings_history table (triggers on properties + properties_extension) + one-shot
backfill from property_details.listing_events for pre-trigger history.
Climate risk First Street
- Flood 1/10 Low FEMA zone X · 0% chance over 30 yrs
- Wildfire 2/10 Low
- Heat 3/10 Moderate 7 d/yr ≥97°F today · 16 d/yr by 30 yrs out
- Wind 2/10 Low 3% chance of damaging wind over 30 yrs
- Air quality 1/10 Low 0 unhealthy d/yr today · 0 by 30 yrs out
Nearby sold comps map
Loading sold comps map…
Walkable amenities ~0.75 mi
Loading nearby amenities…
Taxation est. · year 1
- Rental income
- $17,538
- − Mortgage interest
- −$6,162
- − Property taxes
- −$1,650
- − Insurance
- −$550
- − Repairs & maintenance
- −$1,403
- − Management
- −$1,403
- − Depreciation
- −$3,200
- Taxable income
- $3,170
- Est. tax owed @ 24.0%
- −$761
- After-tax cash flow
- $3,972/yr
For passive investors: Depreciation is non-cash, so a rental often shows a tax loss while cash-flowing — sheltering income. Rental losses are passive: they offset passive income freely, and up to $25,000/yr can offset ordinary (W-2) income if you actively participate and your MAGI is under $100k (phasing out to $0 by $150k); unused losses carry forward. On sale, claimed depreciation is recaptured at up to 25%, and gains may owe capital-gains tax (a 1031 exchange can defer both). Figures are a year-1 estimate at your 24.0% rate — not tax advice; consult a CPA.
Condition & rehab AI · 13 photos
This fixer-upper home requires extensive repairs and maintenance, including a new roof, exterior siding, flooring, and HVAC system. Improvements to the exterior and interior will significantly increase its resale and rental value.
Repairs flagged
- Major roof — The roof appears to have significant damage.
- Major exterior siding — The exterior siding is peeling and in poor condition.
- Major flooring — The flooring in the kitchen and living room appears worn and in need of replacement.
- Major interior walls/paint — The interior walls and paint appear to be in poor condition, with peeling paint and discoloration.
- Major HVAC system — The HVAC system appears to be in poor condition, with visible wear and tear on the electrical panel and components.
- Major landscaping — The landscaping is overgrown and in poor condition, with weeds and debris visible.
- Major foundation — The foundation appears to be in poor condition, with visible cracks and settling.
Value-add opportunities
- Both landscaping and curb appeal — A well-maintained and attractive exterior can increase both resale and rental value.
- Both HVAC system — A functional and energy-efficient HVAC system can improve comfort and reduce energy costs.
- Both interior walls and paint — Fresh paint and a clean interior can make the home more appealing and increase its value.
- Both roof and exterior siding — A new roof and siding can improve the home's appearance and increase its value.
- Both flooring — New flooring can improve the home's appearance and increase its value.
- Both foundation — A stable and well-maintained foundation can improve the home's structural integrity and increase its value.
Renovation cost estimate screening
| Repair item | Severity | Est. cost |
|---|---|---|
| roof · The roof appears to have significant damage. | Major | $15,000–50,000 |
| exterior siding · The exterior siding is peeling and in poor condition. | Major | $15,000–50,000 |
| flooring · The flooring in the kitchen and living room appears worn and in need of replacement. | Major | $15,000–50,000 |
| interior walls/paint · The interior walls and paint appear to be in poor condition, with peeling paint and discoloration. | Major | $15,000–50,000 |
| HVAC system · The HVAC system appears to be in poor condition, with visible wear and tear on the electrical panel and components. | Major | $15,000–50,000 |
| landscaping · The landscaping is overgrown and in poor condition, with weeds and debris visible. | Major | $15,000–50,000 |
| foundation · The foundation appears to be in poor condition, with visible cracks and settling. | Major | $15,000–50,000 |
| Total estimated repair cost · 7 items | $105,000–350,000 |
Value-add ROI direction
- Both landscaping and curb appeal — A well-maintained and attractive exterior can increase both resale and rental value. ↑
- Both HVAC system — A functional and energy-efficient HVAC system can improve comfort and reduce energy costs. ↑
- Both interior walls and paint — Fresh paint and a clean interior can make the home more appealing and increase its value. ↑
- Both roof and exterior siding — A new roof and siding can improve the home's appearance and increase its value. ↑
- Both flooring — New flooring can improve the home's appearance and increase its value. ↑
- Both foundation — A stable and well-maintained foundation can improve the home's structural integrity and increase its value. ↑
ⓘ Cost ranges are severity-bucket heuristics (US national rule-of-thumb). Get contractor quotes + a written scope before underwriting a rehab budget.
Schools (NCES district)
- District
- South Glens Falls Central School District
- NCES district ID
- 3627240
- Math proficiency
- 49% ▼ -9.00%
- Reading proficiency
- 59% ▲ 12.00%
- Median HH income
- $59,015
- Composite
- 46.93/100
- National rank
- #2363
- State rank
- #307 of 590 in NY
Livability — West Glens Falls
- Score
- 71/100
- State rank
- #388
- US rank
- #6663
Category grades
Schools grade is shown separately in the Schools card above.
Census & demographics
- Population (ZIP)
- 8,915
Population outlook (Saratoga County) Hauer SSP2
- Today (2025)
- 238,889 people
- By 2030
- 243,681 · +2.0%
- By 2040
- 249,118 · +4.3%
- By 2050
- 248,638 · +4.1%
- By 2075
- 241,675 · +1.2%
- By 2100
- 213,150 · -10.8%
Race, ethnicity, and origin ACS 2023
- Neighborhood character
- Predominantly White (91%)
- Race & ethnicity
- White 91% Two or more races 4% Hispanic / Latino 3% Black 2%
- Common ancestry
- Lithuanian 8% Slovak 2% Romanian 2%
- Foreign-born
- 1% · South Korea
- Languages at home
- 97% English-only · Spanish 2% German/W. Germanic 0%
Political lean MEDSL · Saratoga
- 2024 margin
- Toss-up / Even · D 50.9% · R 49.1%
- 2008→2024 swing
- -1.6pp toward R · 2008: 3.4pp · 2024: 1.8pp
- All cycles
- 2024: D+1.8 2020: D+5.4 2016: R+4.4 2012: D+2.1 2008: D+3.4
Not yet ingested
- Civics
- —
Market trends
- HPI YoY
- ▲ 7.89%
- Current HPI
- 349.2844
- Rent YoY
- —
- Metro
- —
- State GDP YoY
- ▲ 2.60%
- F500 in state
- 92
Industry mix (Fortune 500 HQ in NY)
| Industry | F500 HQs | Revenue |
|---|---|---|
| Financial Services | 10 | $950B |
|
||
| Consumer Goods | 9 | $162B |
|
||
| Insurance | 4 | $225B |
|
||
| Telecommunications | 2 | $144B |
|
||
| Pharmaceuticals | 2 | $112B |
|
||
| Media / Entertainment | 2 | $69B |
|
||
Price history
2 events — show timeline
- 2026-05-14 Pending — Global MLS
- 2026-05-11 Listed $110,000 Global MLS
Cash-flow waterfall
monthlySold comps — $/sqft
last 12 mo · ≤1 miLoading sold comps…