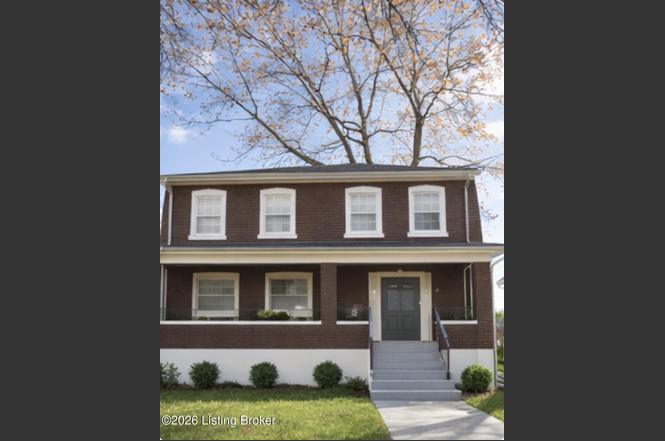
311 Shawnee Dr · Louisville, KY
Flood risk 1/10 · Minimal
- FEMA flood zone
- X (shaded)
- Chance of flooding over 30 yrs
- 0.0%
- Est. flood insurance / yr
- $473 – $860
Fire risk 1/10 · Minimal
- Est. fire insurance / yr
- $839 – $1,559
Heat risk 5/10 · Moderate
- Hot days now (above 104°F)
- 7 days/yr
- Hot days in 30 yrs
- 20 days/yr
Wind risk 2/10 · Minimal
- Chance of severe wind over 30 yrs
- 2.0%
Air-quality risk 2/10 · Minimal
- Unhealthy air days now
- 1 days/yr
- Unhealthy air days in 30 yrs
- 2 days/yr
Risk factors via First Street. Map © Google.
Why this score? — see what drove the D grade
The composite is a weighted blend of 9 inputs, each scored 0–100. Each bar is that input's sub-score; the figure is the points it added to the 100-point composite (weight × sub-score).
- Cash flow +11.1/30.0
- Appreciation +10.0/10.0
- ARV discount +5.1/15.0
- DSCR +3.2/10.0
- Livability +3.2/5.0
- Rent growth +2.6/5.0
- 1% rule +2.5/10.0
- Condition / age +2.5/5.0
- Schools +2.3/10.0
$184,900
🖨 Deal sheet (PDF) 📄 Offer letter ✓ Due diligence
Listing remarks
2000sq ft of living space and an additional 1000 sq ft in the bsmt, providing ample room to roam, relax and entertain. Seller highlights that many neighbors have lived on the block over 50yrs. Full porch is perfect for sunny days. Owner has meticulously renovated the house including house and garage roof, gutters, ac unit, paint throughout, whole bathroom, appliances and much more. If eligible, don't miss the chance to personalize the space with the REVERT program ($50,000). Don't delay make your appt today!
Key facts
- Full porch
- Whole bathroom
- Appliances
Tags
Property features AI
Finance
- Other: Subdivision: HOMELAWN TERRACE
- HOA & community: No association fee
Exterior
- Parking: Detached 2-car garage
- Utilities: Electricity connected
- Home design: Traditional single-family residence; Two-story
- Construction: Brick construction; Shingle roof; Concrete block foundation; Built in 1922; 2,016 above-grade finished area (listed by agent); 1,008 below-grade unfinished
- Exterior features: Privacy and chain-link fencing; Sidewalks
Interior
- Kitchen: Kitchen on the first floor; Dining room on the first floor
- Bedrooms: Three bedrooms located on the second floor
- Bathrooms: One full bathroom on the second floor
- Interior features: Unfinished basement; Six closets; Six rooms (additional total listed as seven rooms)
- Laundry & utility: No first-floor laundry
Neighborhood map
What this means for you Summary
Snapshot
- This is a 3-bed/1.0-bath single-family listed at $185k.
Deal economics
- At list price, monthly cash flow is $-73 ($-881/yr) — negative.
- To cash-flow at today's rent, offer at most $172k (7.0% below list).
- To meet the 1% rule (rent ≥ 1% of price), the offer needs to be $138k (25.4% below list).
- Recommended offer: $138k (25.4% below list) — sets the bar for 1% rule.
Location & tenants
- Location reads 63/100 on livability (#333 in KY) — a middle-class / working-renter tenant base. Strengths: cost of living A+, housing A+; Watch: employment C-, health & safety D+, crime F.
- Jefferson County (urban): math 19% / reading 35% proficiency, ranked #121 of 165 in KY (top 73%) — low school quality limits family demand, transient renter base, plan for 1-2y turnover.
- Zoned schools: King Elementary (math 2% / reading 8%, grade F, #670 of 676 statewide, top 100%, 299 students, 90% FRL); Kammerer Middle (math 21% / reading 42%, grade F, #125 of 217 statewide, top 63%, 720 students, 52% FRL); Doss High (math 8% / reading 17%, grade F, #228 of 254 statewide, top 91%, 939 students, 70% FRL).
- Market conditions: Rents flat; 141 active listings in the ZIP; 7 comparable units currently listed for rent nearby; rentals leasing fast (median 14d on market — plan ~1-2 weeks tenant-placement turnaround); lower-income renter base — watch delinquency; 2,836 units permitted in Jefferson County in 2024 (1,558 in 5+ unit buildings).
Forward outlook
- In year one you build about $20k of equity ($1k loan paydown + $18k appreciation (10.0% local appreciation)).
- Jefferson County population projected at +13% by 2050 — modest demand growth; plan on rents tracking national, not racing it.
- At projected returns (10.0% appreciation + 0.5% rent growth), your $52k cash investment doubles in ~3 years — after that, you're playing with house money.
- By year 2, paydown + projected appreciation supports a ~$32k cash-out refi (75% LTV) — recoverable capital for the next deal without selling this one.
Negotiation context
- It's been on market 159 days — a 12% lower offer ($163k) is reasonable based on typical stale-listing flexibility.
- 4 sale attempts since 25y ago with the ask held roughly flat each time — persistent listings suggest the price (not the market) is what's stuck; bring a comps-based counter.
- Current owner paid $87k; list at $185k implies a 113% gain — meaningful room to come down on a strong offer.
Risks & watch-outs
- Watch-outs: built in 1922 — expect roof / HVAC / electrical / plumbing capex.
- Climate carrying-cost: extreme-heat days projected 7→20/yr by 2055 (HVAC capex compounding) — expect insurance premiums to compound above CPI over the hold.
Questions for the listing agent
- What do current leases actually rent for vs. the listed asking? Can we see a recent rent roll and the last 12 months of T-12 income?
- It's been on market 159 days. Have you received any prior offers? Is the seller open to a 25% concession, seller financing, or rate buy-down credit?
- Built in 1922 — when were the roof, HVAC, electrical panel, plumbing, and water heater last replaced?
- Why hasn't it sold? Are there any deal-killer items the seller is aware of (foundation, flood, title, zoning, code violations)?
- Is there a deadline driving the sale (1031 exchange, divorce, estate, relocation)? That informs how much negotiation room exists.
- Schools are D-rated, which usually means shorter tenancies and higher turnover. Who's the typical renter profile here, and what's been the actual vacancy rate?
- Crime grade is F in this area — have there been break-ins, vandalism, or insurance claims at this property in the last 3 years? What carrier currently insures it and at what premium?
- The area grade is low — what's the realistic commute time and amenity access for the typical tenant pool here? Any planned neighborhood developments (good or bad) we should know about?
- What's the average days-on-market for RENTAL listings here right now (not sales)? A rising rental-DOM trend means longer vacancies and softer asking-rent achievability than the comps imply.
- What's the recent tenant-quality profile in this submarket — average credit score on applications, eviction rate, late-payment / NSF rate, and stable-employment percentage? A property-management company in the area should have these aggregated.
- How much new for-sale + rental construction is in the pipeline within 1–3 miles? Heavy new supply typically softens prices + rents 12–24 months out; constrained supply supports both.
Investment metrics
- 1% rule
- 0.75% ✗
- Cap rate
- 5.82%
- Cash-on-cash
- -1.70%
- DSCR
- 0.92
- GRM
- 11.2
CMA / ARV
- ARV (on-the-fly)
- $175,392
- Comps found
- 12
Show comp detail 12 sales within ~0.75 mi
| Address | Dist | Beds/Ba | Sqft | Sold | Price | $/sf | Match |
|---|---|---|---|---|---|---|---|
| 4557 Southwestern Pkwy | 0.12mi | 3/1.0 | 2,051 (+2%) | 4mo | $145,000 | $71 | 88 |
| 315 Shawnee Dr | 0.02mi | 3/1.0 | 1,821 (-10%) | 5mo | $105,000 | $58 | 79 |
| 240 S 42nd St | 0.25mi | 4/1.0 (+1) | 2,136 (+6%) | 15mo | $185,000 | $87 | 61 |
| 4007 Vermont Ave | 0.53mi | 4/2.5 (+1) | 2,052 (+2%) | 4mo | $197,500 | $96 | 58 |
| 107 S 43rd St | 0.37mi | 3/1.0 | 1,807 (-10%) | 13mo | $100,000 | $55 | 54 |
| 233 S 41st St | 0.40mi | 4/2.0 (+1) | 1,765 (-12%) | 2mo | $110,000 | $62 | 50 |
| 666 S 41st St | 0.73mi | 4/2.5 (+1) | 2,000 (-1%) | 5mo | $225,000 | $113 | 49 |
| 123 S 39th St | 0.61mi | 4/2.5 (+1) | 2,159 (+7%) | 6mo | $215,000 | $100 | 43 |
| 636 S 40th St | 0.67mi | 3/1.0 | 1,735 (-14%) | 7mo | $140,000 | $81 | 39 |
| 653 Cecil Ave | 0.67mi | 4/2.5 (+1) | 1,808 (-10%) | 10mo | $109,000 | $60 | 32 |
| 307 S 38th St | 0.71mi | 3/3.0 | 1,822 (-10%) | 14mo | $190,000 | $104 | 32 |
| 212 N 38th St | 0.75mi | 4/2.0 (+1) | 1,747 (-13%) | 12mo | $189,900 | $109 | 24 |
Match score weights: distance 35% · size 25% · config 20% · recency 20%. Top-matched comps best support the ARV.
Projected returns pro-forma
10.0% appreciation · 0.51% rent growth · sell at horizon
- IRR
- 22.3%
- Equity multiple
- 2.79×
- Total profit
- $92,606
- Equity at exit
- $166,573
- IRR
- 19.5%
- Equity multiple
- 6.22×
- Total profit
- $270,116
- Equity at exit
- $359,220
Cash invested: $51,772 (down + closing). Projections, not guarantees.
Landlord ↔ Tenant lean methodology
- Overall (STATE)
- 83 Strongly Landlord-Friendly
- State Kentucky
- 83 Strongly Landlord-Friendly · R+16
- County
- — inherits STATE
- City
- — inherits STATE
ZIP-level market 40212
- Home prices YoY
- 11.0%
- Rents YoY
- 0.5%
- Active inventory
- 141
- Price-to-rent
- 11.2×
Monthly cashflow live
- Estimated rent
- $1,379 high interval (Pro) →
- Mortgage (P&I)
- −$970
- Tax from tax record
- −$116 /mo · $1,397/yr
- Insurance
- −$77
- HOA
- −$0
- Vacancy / Maint / Mgmt
- −$290
- Net cashflow
- $-73
Break-even live
Sensitivity live
| Price | -10% $31 | -5% $-21 | +0% $-73 | +5% $-126 | +10% $-178 |
|---|---|---|---|---|---|
| Rent | -10% $-182 | -5% $-128 | +0% $-73 | +5% $-19 | +10% $36 |
| Rate | -1.0pp $20 | -0.5pp $-26 | base $-73 | +0.5pp $-121 | +1.0pp $-170 |
UW: 25.0% down · 7.5% · 30yr · 1.5% tax · 5.0% vac · 8.0% maint · 8.0% mgmt
Financing live
Cash to close
- Down payment
- $46,225
- Closing costs
- $5,547
- Reserves months
- —
- Total cash needed
- —
Loan-product check · same deal, 3 products live
Conventional
25% down · 7.5% · 30yr
- Down + closing
- —
- Monthly P&I
- —
- Monthly cashflow
- —
- DSCR
- —
- Eligible?
- —
Personal DTI + credit; lowest rate.
DSCR
20% down · 8.5% · 30yr
- Down + closing
- —
- Monthly P&I
- —
- Monthly cashflow
- —
- DSCR
- —
- Eligible?
- —
No personal income docs; deal must DSCR.
Hard money
10% down · 12.0% · 12mo
- Down + closing
- —
- Monthly P&I
- —
- Monthly cashflow
- —
- DSCR
- —
- Eligible?
- —
Short-term bridge; refi at stabilization.
Rent comps 7 comps
| Address | Beds | Baths | Sqft | Rent | $/sqft | DOM | Units | Dist |
|---|---|---|---|---|---|---|---|---|
| 127 N 40th St Louisville, KY | 3.0 | 2.0 | 1500 | $1,570 | $1.05 | 5d | 1 | 0.57mi |
| 3922 River Park Dr Louisville, KY | 2.0 | 2.0 | 1800 | $1,195 | $0.66 | 13d | 1 | 0.59mi |
| 663 S 43rd St Louisville, KY | 2.0 | 2.0 | 1736 | $1,250 | $0.72 | 25d | 1 | 0.66mi |
| 628 S 39th St Louisville, KY | 3.0 | 1.0 | 1448 | $1,220 | $0.84 | 18d | 1 | 0.70mi |
| 722 S 40th St Unit NA Louisville, KY | 4.0 | 2.5 | 1556 | $1,700 | $1.09 | 5d | 1 | 0.94mi |
| 803 S 35th St Louisville, KY | 3.0 | 1.0 | 1486 | $1,350 | $0.91 | 25d | 1 | 1.25mi |
| 820 Hazel St Louisville, KY | 4.0 | 2.0 | 1872 | $1,395 | $0.75 | 5d | 1 | 1.49mi |
Listing history 27 events
-
2026-06-21days on market $184,900 Active 159 DOM
-
2026-06-18days on market $184,900 Active 156 DOM
-
2026-06-17days on market $184,900 Active 155 DOM
-
2026-06-16days on market $184,900 Active 154 DOM
-
2026-06-15days on market $184,900 Active 153 DOM
-
2026-06-13days on market $184,900 Active 151 DOM
-
2026-06-10days on market $184,900 Active 148 DOM
-
2026-06-09days on market $184,900 Active 147 DOM
-
2026-06-08days on market $184,900 Active 146 DOM
-
2026-06-07days on market $184,900 Active 145 DOM
-
2026-06-03days on market $184,900 Active 141 DOM
-
2026-06-02days on market $184,900 Active 140 DOM
-
2026-06-01days on market $184,900 Active 139 DOM
-
2026-05-31days on market $184,900 Active 138 DOM
-
2026-01-13$184,900 Active
-
2025-12-31historical
-
2025-12-01price $184,900
-
2025-10-09price $194,900
-
2025-08-09price $195,000
-
2025-07-12$199,900 Active
-
2025-05-22historical
-
2025-04-11price $205,000
-
2025-02-12price $215,000
-
2024-11-27$220,000 Active
-
2008-01-14soldstatus $86,980
-
2001-09-30historical
-
2001-03-01$105,900
ⓘ Source: listings_history table (triggers on properties + properties_extension) + one-shot
backfill from property_details.listing_events for pre-trigger history.
Tax reassessment forecast KY · Resets to sale price
- Current annual tax
- $1,397 · $116/mo
- Projected year-2 tax
- $1,590 · $133/mo
- Expected delta
- +$193/yr (+$16/mo · 13.8%)
ⓘ Screening estimate from a state-policy table — verify with the county assessor before closing.
Climate risk First Street
- Flood 1/10 Low FEMA zone X (shaded) · 0% chance over 30 yrs
- Wildfire 1/10 Low
- Heat 5/10 Major 7 d/yr ≥104°F today · 20 d/yr by 30 yrs out
- Wind 2/10 Low 2% chance of damaging wind over 30 yrs
- Air quality 2/10 Low 1 unhealthy d/yr today · 2 by 30 yrs out
Nearby sold comps map
Loading sold comps map…
Walkable amenities ~0.75 mi
Loading nearby amenities…
Taxation est. · year 1
- Rental income
- $16,552
- − Mortgage interest
- −$10,357
- − Property taxes
- −$1,397
- − Insurance
- −$924
- − Repairs & maintenance
- −$1,324
- − Management
- −$1,324
- − Depreciation
- −$5,379
- Taxable loss
- −$4,154
- Est. tax savings @ 24.0%
- +$997
- After-tax cash flow
- $116/yr
For passive investors: Depreciation is non-cash, so a rental often shows a tax loss while cash-flowing — sheltering income. Rental losses are passive: they offset passive income freely, and up to $25,000/yr can offset ordinary (W-2) income if you actively participate and your MAGI is under $100k (phasing out to $0 by $150k); unused losses carry forward. On sale, claimed depreciation is recaptured at up to 25%, and gains may owe capital-gains tax (a 1031 exchange can defer both). Figures are a year-1 estimate at your 24.0% rate — not tax advice; consult a CPA.
Schools (NCES district)
- District
- Jefferson County
- NCES district ID
- 2102990
- Math proficiency
- 19% ▼ -17.00%
- Reading proficiency
- 35% ▼ -11.00%
- Median HH income
- $47,885
- Composite
- 23.45/100
- National rank
- #7884
- State rank
- #121 of 165 in KY
Livability — Louisville
- Score
- 63/100
- State rank
- #333
- US rank
- #15887
Category grades
Schools grade is shown separately in the Schools card above.
Census & demographics
- Census place
- Louisville, KY
- County
- Jefferson County · 790,184 people
- City population
- 769,292
- Metro
- Louisville/Jefferson County, KY-IN
- Population (ZIP)
- 14,661
- Household income
- $35,753
- Rent vs Own
- Severe rent burden
- 1148.0
Population outlook (Jefferson County) Hauer SSP2
- Today (2025)
- 823,112 people
- By 2030
- 849,343 · +3.2%
- By 2040
- 895,696 · +8.8%
- By 2050
- 933,630 · +13.4%
- By 2075
- 1,028,262 · +24.9%
- By 2100
- 1,072,675 · +30.3%
Race, ethnicity, and origin ACS 2023
- Neighborhood character
- Majority Black (60%)
- Race & ethnicity
- Black 60% White 37% Two or more races 2% Hispanic / Latino 1%
- Common ancestry
- Slovak 1% Lithuanian 1% Iranian 1%
- Foreign-born
- 1% · Canada
- Languages at home
- 98% English-only · Spanish 1%
Political lean MEDSL · Jefferson
- 2024 margin
- D (+16.6) · D 57.4% · R 40.9% · Other 1.7%
- 2008→2024 swing
- +4.5pp toward D · 2008: 12.0pp · 2024: 16.6pp
- All cycles
- 2024: D+16.6 2020: D+20.1 2016: D+13.3 2012: D+11.1 2008: D+12.0
Not yet ingested
- Civics
- —
Market trends
- HPI YoY
- ▲ 29.02%
- Current HPI
- 293.2624
- Rent YoY
- ▲ 0.51%
- Metro
- Louisville/Jefferson County, KY-IN
- State GDP YoY
- ▲ 1.81%
- F500 in state
- 4
Industry mix (Fortune 500 HQ in KY)
| Industry | F500 HQs | Revenue |
|---|---|---|
| Healthcare | 1 | $118B |
|
||
| Food / Beverage | 1 | $7B |
|
||
Price history
+74.6% since first listed13 events — show timeline
- 2026-01-13 Listed $184,900 Metro Search MLS
- 2025-12-31 Listing Removed — Metro Search MLS
- 2025-12-01 Price Changed $184,900 Metro Search MLS
- 2025-10-09 Price Changed $194,900 Metro Search MLS
- 2025-08-09 Price Changed $195,000 Metro Search MLS
- 2025-07-12 Listed $199,900 Metro Search MLS
- 2025-05-22 Listing Removed — Metro Search MLS
- 2025-04-11 Price Changed $205,000 Metro Search MLS
- 2025-02-12 Price Changed $215,000 Metro Search MLS
- 2024-11-27 Listed $220,000 Metro Search MLS
- 2008-01-14 Sold (Public Records) $86,980 Public Records
- 2001-09-30 Listing Removed — Metro Search MLS
- 2001-03-01 Listed $105,900 Metro Search MLS
Property tax history
+1.0%/yrLatest (2025): $1,397 · -1.9% YoY. Source: county tax records.
Cash-flow waterfall
monthlySold comps — $/sqft
last 12 mo · ≤1 miLoading sold comps…