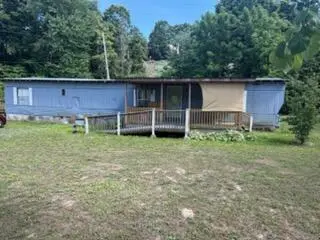
904 High Point Rd · Spring City, TN
Flood risk 9/10 · Severe
- FEMA flood zone
- X (unshaded)
- Chance of flooding over 30 yrs
- 0.99%
- Est. flood insurance / yr
- $507 – $1,088
Fire risk 4/10 · Minor
- Est. fire insurance / yr
- $949 – $1,763
Heat risk 5/10 · Moderate
- Hot days now (above 108°F)
- 7 days/yr
- Hot days in 30 yrs
- 18 days/yr
Wind risk 3/10 · Minor
- Chance of severe wind over 30 yrs
- 6.0%
Air-quality risk 3/10 · Minor
- Unhealthy air days now
- 2 days/yr
- Unhealthy air days in 30 yrs
- 2 days/yr
Risk factors via First Street. Map © Google.
Why this score? — see what drove the B grade
The composite is a weighted blend of 9 inputs, each scored 0–100. Each bar is that input's sub-score; the figure is the points it added to the 100-point composite (weight × sub-score).
- Cash flow +30.0/30.0
- DSCR +10.0/10.0
- 1% rule +7.5/10.0
- ARV discount +7.5/15.0
- Appreciation +7.1/10.0
- Livability +3.5/5.0
- Schools +2.8/10.0
- Rent growth +2.5/5.0
- Condition / age +2.5/5.0
$108,500
🖨 Deal sheet 📄 Offer letter ✓ Due diligence
Listing remarks
2 Bed, 1.5 Bath home with a bonus room, sitting on . 71 acres in a quiet country setting. Features include a fenced in yard, two outbuildings, a front and side porch. Plenty of space to enjoy peaceful living with room for storage, hobbies, or outdoor entertaining.
Key facts
- Front and side porch
- Two outbuildings
- Fenced in yard
Tags
Property features AI
Finance
- HOA & community: No community features listed
Exterior
- Parking: Driveway
- Utilities: Public water; Septic tank; Electricity connected; Water connected
- Home design: Single wide mobile home; One level; Aluminum siding
- Construction: Metal roof; Block foundation; Aluminum skirt
- Exterior features: Front porch; Side porch; Fire pit; Fenced yard; Workshop and outbuilding
Interior
- Kitchen: Electric oven; Refrigerator
- Flooring: Vinyl flooring
- Bathrooms: 1 full bathroom; 1 half bathroom
- Heating & cooling: Has heating (other); Ceiling fan cooling; Window air conditioning units
- Interior features: Ceiling fans
- Laundry & utility: Laundry on main level; Electric water heater
Neighborhood map
What this means for you Summary
Snapshot
- This is a 2-bed/1.5-bath manufactured listed at $108k.
Deal economics
- At list price, monthly cash flow is $363 ($4k/yr) — positive.
- The deal already cash-flows at list — no discount required.
- Meets the 1% rule at list price ($1k rent vs $108k).
- Cap rate 11.0% vs local median 1.8% in Spring City — top-decile yield for the area; either an underpriced asset or a hidden risk that comps aren't pricing in. Stress-test before assuming the spread holds.
Location & tenants
- Location reads 70/100 on livability (#50 in TN) — a middle-class / working-renter tenant base. Strengths: crime A+, cost of living A+, housing A+; Watch: health & safety C-, amenities F, commute F.
- Rhea County (rural): math 35% / reading 31% proficiency, ranked #38 of 139 in TN (top 27%) — families likely to look elsewhere, expect single-tenant / working-renter base with shorter leases.
- Zoned schools: Rhea Middle School (math 39% / reading 26%, grade F, #81 of 333 statewide, top 26%, 556 students, 0% FRL); Rhea County High School (math 24% / reading 35%, grade F, #86 of 332 statewide, top 27%, 1,500 students, 0% FRL) — zoned schools average 0% FRL vs 60% district-wide (60 pts lower); this property's tenant base skews higher-income than the district average.
- Market conditions: 67 active listings in the ZIP; 198 units permitted in Rhea County in 2024 (40 in 5+ unit buildings).
Forward outlook
- In year one you build about $5k of equity ($750 loan paydown + $5k appreciation (4.3% local appreciation)).
- At projected returns (4.3% appreciation + 3.0% rent growth), your $30k cash investment doubles in ~3 years — after that, you're playing with house money.
- By year 7, paydown + projected appreciation supports a ~$34k cash-out refi (75% LTV) — recoverable capital for the next deal without selling this one.
Negotiation context
- Only 13 days on market — expect competitive offers; lowballing is unlikely to land.
- Current owner paid $5k; list at $108k implies a 2070% gain — meaningful room to come down on a strong offer.
Risks & watch-outs
- Watch-outs: flood insurance adds $66/mo.
- Climate carrying-cost: severe flood risk; extreme-heat days projected 7→18/yr by 2055 (HVAC capex compounding) — expect insurance premiums to compound above CPI over the hold.
Questions for the listing agent
- What's the actual annual flood-insurance premium (NFIP or private), and is the property in a SFHA with mandatory coverage?
- Is there a deadline driving the sale (1031 exchange, divorce, estate, relocation)? That informs how much negotiation room exists.
- Schools are F-rated, which usually means shorter tenancies and higher turnover. Who's the typical renter profile here, and what's been the actual vacancy rate?
- What's the average days-on-market for RENTAL listings here right now (not sales)? A rising rental-DOM trend means longer vacancies and softer asking-rent achievability than the comps imply.
- What's the recent tenant-quality profile in this submarket — average credit score on applications, eviction rate, late-payment / NSF rate, and stable-employment percentage? A property-management company in the area should have these aggregated.
- How much new for-sale + rental construction is in the pipeline within 1–3 miles? Heavy new supply typically softens prices + rents 12–24 months out; constrained supply supports both.
Investment metrics
- 1% rule
- 1.25% ✓
- Cap rate
- 11.04%
- Cash-on-cash
- 16.95%
- DSCR
- 1.75
- GRM
- 6.7
CMA / ARV
No comps found within radius.
Projected returns pro-forma
4.26% appreciation · 3.0% rent growth · sell at horizon
- IRR
- 23.7%
- Equity multiple
- 2.43×
- Total profit
- $43,561
- Equity at exit
- $56,649
- IRR
- 23.5%
- Equity multiple
- 4.75×
- Total profit
- $114,062
- Equity at exit
- $93,986
Cash invested: $30,380 (down + closing). Projections, not guarantees.
Landlord ↔ Tenant lean methodology
- Overall (STATE)
- 87 Strongly Landlord-Friendly
- State Tennessee
- 87 Strongly Landlord-Friendly · R+13
- County
- — inherits STATE
- City
- — inherits STATE
ZIP-level market 37332
- Home prices YoY
- 1.1%
- Active inventory
- 67
- Price-to-rent
- 6.7×
Monthly cashflow live
- Estimated rent
- $1,355 medium interval (Pro) →
- Mortgage (P&I)
- −$569
- Tax from tax record
- −$27 /mo · $329/yr
- Insurance
- −$45
- Flood insurance flood zone
- −$66 /mo · $798/yr
- HOA
- −$0
- Vacancy / Maint / Mgmt
- −$285
- Net cashflow
- $363
Break-even live
UW: 25.0% down · 7.5% · 30yr · 1.5% tax · 5.0% vac · 8.0% maint · 8.0% mgmt
Financing live
Cash to close
- Down payment
- $27,125
- Closing costs
- $3,255
- Reserves months
- —
- Total cash needed
- —
Loan-product check · same deal, 3 products live
Conventional
25% down · 7.5% · 30yr
- Down + closing
- —
- Monthly P&I
- —
- Monthly cashflow
- —
- DSCR
- —
- Eligible?
- —
Personal DTI + credit; lowest rate.
DSCR
20% down · 8.5% · 30yr
- Down + closing
- —
- Monthly P&I
- —
- Monthly cashflow
- —
- DSCR
- —
- Eligible?
- —
No personal income docs; deal must DSCR.
Hard money
10% down · 12.0% · 12mo
- Down + closing
- —
- Monthly P&I
- —
- Monthly cashflow
- —
- DSCR
- —
- Eligible?
- —
Short-term bridge; refi at stabilization.
Listing history 17 events
-
2026-06-18days on market $108,500 Active 13 DOM
-
2026-06-17days on market $108,500 Active 12 DOM
-
2026-06-16days on market $108,500 Active 11 DOM
-
2026-06-15days on market $108,500 Active 10 DOM
-
2026-06-13days on market $108,500 Active 8 DOM
-
2026-06-12days on market $108,500 Active 7 DOM
-
2026-06-09days on market $108,500 Active 4 DOM
-
2026-06-08days on market $108,500 Active 3 DOM
-
2026-06-08days on market $108,500 Active 2 DOM
-
2026-06-07pricedays on market $108,500 Active 1 DOM
-
2026-06-03days on market $115,000 Active 16 DOM
-
2026-06-02days on market $115,000 Active 15 DOM
-
2026-06-01days on market $115,000 Active 14 DOM
-
2026-05-31days on market $115,000 Active 13 DOM
-
2026-05-18$122,500 Active
-
2014-06-25soldstatus $5,000
-
2004-08-13soldstatus $29,500
ⓘ Source: listings_history table (triggers on properties + properties_extension) + one-shot
backfill from property_details.listing_events for pre-trigger history.
Tax reassessment forecast TN · Resets to sale price
- Current annual tax
- $329 · $27/mo
- Projected year-2 tax
- $770 · $64/mo
- Expected delta
- +$441/yr (+$37/mo · 134.1%)
ⓘ Screening estimate from a state-policy table — verify with the county assessor before closing.
Climate risk First Street
- Flood 9/10 Extreme FEMA zone X (unshaded) · 99% chance over 30 yrs
- Wildfire 4/10 Moderate
- Heat 5/10 Major 7 d/yr ≥108°F today · 18 d/yr by 30 yrs out
- Wind 3/10 Moderate 6% chance of damaging wind over 30 yrs
- Air quality 3/10 Moderate 2 unhealthy d/yr today · 2 by 30 yrs out
Nearby sold comps map
Loading sold comps map…
Walkable amenities ~0.75 mi
Loading nearby amenities…
Taxation est. · year 1
- Rental income
- $16,266
- − Mortgage interest
- −$6,078
- − Property taxes
- −$329
- − Insurance
- −$1,340
- − Repairs & maintenance
- −$1,301
- − Management
- −$1,301
- − Depreciation
- −$3,156
- Taxable income
- $2,760
- Est. tax owed @ 24.0%
- −$662
- After-tax cash flow
- $3,691/yr
For passive investors: Depreciation is non-cash, so a rental often shows a tax loss while cash-flowing — sheltering income. Rental losses are passive: they offset passive income freely, and up to $25,000/yr can offset ordinary (W-2) income if you actively participate and your MAGI is under $100k (phasing out to $0 by $150k); unused losses carry forward. On sale, claimed depreciation is recaptured at up to 25%, and gains may owe capital-gains tax (a 1031 exchange can defer both). Figures are a year-1 estimate at your 24.0% rate — not tax advice; consult a CPA.
Schools (NCES district)
- District
- Rhea County
- NCES district ID
- 4703510
- Math proficiency
- 35% ▼ -7.00%
- Reading proficiency
- 31% ▼ -5.00%
- Median HH income
- $39,059
- Composite
- 27.67/100
- National rank
- #6917
- State rank
- #38 of 139 in TN
Livability — Spring City
- Score
- 70/100
- State rank
- #50
- US rank
- #7492
Category grades
Schools grade is shown separately in the Schools card above.
Census & demographics
- Population (ZIP)
- 2,123
Population outlook (Rhea County) Hauer SSP2
- Today (2025)
- 33,187 people
- By 2030
- 33,482 · +0.9%
- By 2040
- 33,786 · +1.8%
- By 2050
- 33,730 · +1.6%
- By 2075
- 33,603 · +1.3%
- By 2100
- 33,312 · +0.4%
Race, ethnicity, and origin ACS 2023
- Neighborhood character
- Predominantly White (92%)
- Race & ethnicity
- White 92% Two or more races 6% Black 2%
- Common ancestry
- Serbian 7% Slovak 4% Scottish 1%
Political lean MEDSL · Rhea
- 2024 margin
- Solid R (+66.9) · D 16.0% · R 82.9% · Other 1.1%
- 2008→2024 swing
- -20.7pp toward R · 2008: -46.2pp · 2024: -66.9pp
- All cycles
- 2024: R+66.9 2020: R+63.7 2016: R+61.3 2012: R+48.9 2008: R+46.2
Not yet ingested
- Civics
- —
Market trends
- HPI YoY
- ▲ 4.26%
- Current HPI
- 398.9351
- Rent YoY
- —
- Metro
- —
- State GDP YoY
- ▲ 2.78%
- F500 in state
- 22
Industry mix (Fortune 500 HQ in TN)
| Industry | F500 HQs | Revenue |
|---|---|---|
| Healthcare | 3 | $91B |
|
||
| Retail | 3 | $72B |
|
||
| Transportation / Logistics | 1 | $88B |
|
||
| Paper / Packaging | 1 | $19B |
|
||
| Insurance | 1 | $13B |
|
||
| Energy | 1 | $12B |
|
||
Price history
+315.3% since first listed3 events — show timeline
- 2026-05-18 Listed $122,500 RCAOR
- 2014-06-25 Sold (Public Records) $5,000 Public Records
- 2004-08-13 Sold (Public Records) $29,500 Public Records
Property tax history
+20.8%/yrLatest (2025): $329 · +0.0% YoY. Source: county tax records.
Cash-flow waterfall
monthlySold comps — $/sqft
last 12 mo · ≤1 miLoading sold comps…