461 Paris St · San Marcos, TX
Flood risk No data
- FEMA flood zone
- —
- Chance of flooding over 30 yrs
- —
- Est. flood insurance / yr
- —
Fire risk No data
- Est. fire insurance / yr
- —
Heat risk No data
- Hot days now (above threshold)
- —
- Hot days in 30 yrs
- —
Wind risk No data
- Chance of severe wind over 30 yrs
- —
Air-quality risk No data
- Unhealthy air days now
- —
- Unhealthy air days in 30 yrs
- —
Risk factors via First Street. Map © Google.
Why this score? — see what drove the D grade
The composite is a weighted blend of 9 inputs, each scored 0–100. Each bar is that input's sub-score; the figure is the points it added to the 100-point composite (weight × sub-score).
- Cash flow +12.4/30.0
- ARV discount +7.5/15.0
- Appreciation +4.5/10.0
- Livability +4.0/5.0
- 1% rule +3.8/10.0
- DSCR +3.7/10.0
- Condition / age +2.5/5.0
- Schools +2.4/10.0
- Rent growth +1.2/5.0
$214,990
🖨 Deal sheet (PDF) 📄 Offer letter ✓ Due diligence
Listing remarks
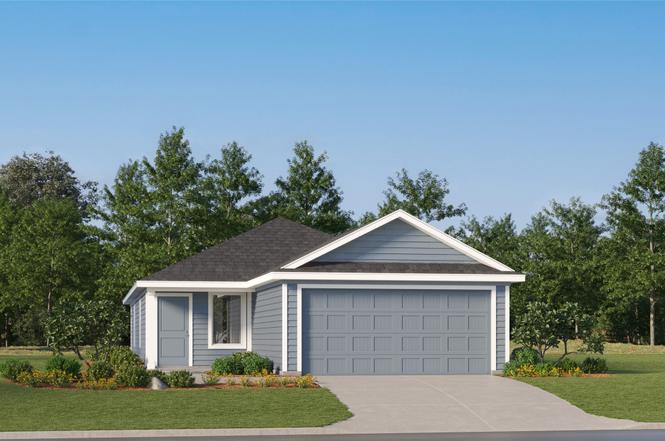
The Idlewood - This single-level home showcases a spacious open floorplan shared between the kitchen, dining area and family room for easy entertaining, along with access to an outdoor space. An owner’s suite enjoys a private location in a rear corner of the home, complemented by an en-suite bathroom and walk-in closet. There are two secondary bedrooms at the front of the home, ideal for household members and overnight guests. Photos are for illustrative purposes only. Estimated Completion May 2026. The completion date, prices and features may vary and are subject to change. Please verify with Lennar directly.
Key facts
- Walk-in closet
- Open floorplan
- Secondary bedrooms
Tags
Neighborhood map
What this means for you Summary
Snapshot
- This is a 3-bed/2.0-bath land listed at $215k.
Deal economics
- At list price, monthly cash flow is $-37 ($-438/yr) — negative.
- To cash-flow at today's rent, offer at most $210k (2.5% below list).
- To meet the 1% rule (rent ≥ 1% of price), the offer needs to be $189k (12.0% below list).
- Recommended offer: $189k (12.0% below list) — sets the bar for 1% rule.
- Cap rate 6.1% vs local median 3.2% in San Marcos — top-decile yield for the area; either an underpriced asset or a hidden risk that comps aren't pricing in. Stress-test before assuming the spread holds.
Location & tenants
- Location reads 81/100 on livability (#30 in TX, #1,601 nationally) — a professional / high-income tenant draw. Strengths: amenities A+, cost of living A+, health & safety A+; Watch: crime D+, employment F.
- Lockhart ISD (town): math 27% / reading 29% proficiency, ranked #657 of 826 in TX (top 80%) — low school quality limits family demand, transient renter base, plan for 1-2y turnover; 62% free/reduced lunch — lower-income household profile, screen leases tightly.
- Zoned schools: Navarro El (math 27% / reading 30%, grade F, #2,706 of 4,322 statewide, top 63%, 580 students, 72% FRL); Lockhart J H (math 22% / reading 26%, grade F, #1,301 of 1,662 statewide, top 79%, 1,433 students, 74% FRL); Lockhart H S (math 21% / reading 33%, grade F, #1,204 of 1,632 statewide, top 75%, 1,968 students, 69% FRL).
- Market conditions: Rents falling (-5.4%/yr); 325 active listings in the ZIP; 33 comparable units currently listed for rent nearby; rentals at typical pace (median 18d on market — plan ~3-4 weeks tenant-placement turnaround); solid renter incomes; 529 units permitted in Caldwell County in 2024 (6 in 5+ unit buildings).
Forward outlook
- Local home prices are declining (-1.0%/yr); year-one equity from $1k of loan paydown is wiped out by about $2k of value loss. Plan a longer hold.
- Caldwell County population projected at +33% by 2050 — long-run rental-demand tailwind backs the buy-and-hold thesis.
Negotiation context
- It's been on market 55 days — a 3% lower offer ($209k) is reasonable based on typical stale-listing flexibility.
Questions for the listing agent
- What do current leases actually rent for vs. the listed asking? Can we see a recent rent roll and the last 12 months of T-12 income?
- It's been on market 55 days. Have you received any prior offers? Is the seller open to a 12% concession, seller financing, or rate buy-down credit?
- What does the HOA fee cover, when was the last increase, and are there any pending special assessments or reserve-fund shortfalls?
- Is there a deadline driving the sale (1031 exchange, divorce, estate, relocation)? That informs how much negotiation room exists.
- Schools are F-rated, which usually means shorter tenancies and higher turnover. Who's the typical renter profile here, and what's been the actual vacancy rate?
- Crime grade is D in this area — have there been break-ins, vandalism, or insurance claims at this property in the last 3 years? What carrier currently insures it and at what premium?
- The area grade is low — what's the realistic commute time and amenity access for the typical tenant pool here? Any planned neighborhood developments (good or bad) we should know about?
- What's the average days-on-market for RENTAL listings here right now (not sales)? A rising rental-DOM trend means longer vacancies and softer asking-rent achievability than the comps imply.
- What's the recent tenant-quality profile in this submarket — average credit score on applications, eviction rate, late-payment / NSF rate, and stable-employment percentage? A property-management company in the area should have these aggregated.
- How much new for-sale + rental construction is in the pipeline within 1–3 miles? Heavy new supply typically softens prices + rents 12–24 months out; constrained supply supports both.
Investment metrics
- 1% rule
- 0.88% ✗
- Cap rate
- 6.09%
- Cash-on-cash
- -0.73%
- DSCR
- 0.97
- GRM
- 9.5
CMA / ARV
No comps found within radius.
Projected returns pro-forma
-1.02% appreciation · 0.0% rent growth · sell at horizon
- IRR
- -9.5%
- Equity multiple
- 0.60×
- Total profit
- $-24,239
- Equity at exit
- $51,641
- IRR
- -5.6%
- Equity multiple
- 0.53×
- Total profit
- $-28,029
- Equity at exit
- $54,010
Cash invested: $60,197 (down + closing). Projections, not guarantees.
Landlord ↔ Tenant lean methodology
- Overall (STATE)
- 87 Strongly Landlord-Friendly
- State Texas
- 87 Strongly Landlord-Friendly · R+5
- County
- — inherits STATE
- City
- — inherits STATE
ZIP-level market 78656
- Home prices YoY
- -0.5%
- Rents YoY
- -5.4%
- Active inventory
- 325
- Price-to-rent
- 9.5×
Monthly cashflow live
- Estimated rent
- $1,891 high interval (Pro) →
- Mortgage (P&I)
- −$1,127
- Tax est. 1.5%
- −$269 /mo · $3,225/yr
- Insurance
- −$90
- HOA
- −$45
- Vacancy / Maint / Mgmt
- −$397
- Net cashflow
- $-37
Break-even live
Sensitivity live
| Price | -10% $112 | -5% $38 | +0% $-37 | +5% $-111 | +10% $-185 |
|---|---|---|---|---|---|
| Rent | -10% $-186 | -5% $-111 | +0% $-37 | +5% $38 | +10% $113 |
| Rate | -1.0pp $72 | -0.5pp $18 | base $-37 | +0.5pp $-92 | +1.0pp $-149 |
UW: 25.0% down · 7.5% · 30yr · 1.5% tax · 5.0% vac · 8.0% maint · 8.0% mgmt
Financing live
Cash to close
- Down payment
- $53,748
- Closing costs
- $6,450
- Reserves months
- —
- Total cash needed
- —
Loan-product check · same deal, 3 products live
Conventional
25% down · 7.5% · 30yr
- Down + closing
- —
- Monthly P&I
- —
- Monthly cashflow
- —
- DSCR
- —
- Eligible?
- —
Personal DTI + credit; lowest rate.
DSCR
20% down · 8.5% · 30yr
- Down + closing
- —
- Monthly P&I
- —
- Monthly cashflow
- —
- DSCR
- —
- Eligible?
- —
No personal income docs; deal must DSCR.
Hard money
10% down · 12.0% · 12mo
- Down + closing
- —
- Monthly P&I
- —
- Monthly cashflow
- —
- DSCR
- —
- Eligible?
- —
Short-term bridge; refi at stabilization.
Rent comps 33 comps
| Address | Beds | Baths | Sqft | Rent | $/sqft | DOM | Units | Dist |
|---|---|---|---|---|---|---|---|---|
| 531 Paris St Maxwell, TX | 4.0 | 2.0 | 1667 | $1,950 | $1.17 | 0d | 1 | 0.12mi |
| 205 E Lima Dr Maxwell, TX | 4.0 | 2.0 | 1700 | $1,899 | $1.12 | 0d | 1 | 0.18mi |
| 351 Cobb Branch Dr Maxwell, TX | 3.0–4.0 | 2.0–3.0 | 1616 | $1,750 | $1.08 | 0d | 4 | 0.70mi |
| 275 Aplite Pass Maxwell, TX | 2.0–5.0 | 2.0–3.5 | 1733 | $2,160 | $1.25 | 0d | 1 | 0.74mi |
| 283 Soapstone Pass Maxwell, TX | 3.0 | 2.0 | 1440 | $1,609 | $1.12 | 18d | 1 | 0.90mi |
| 171 Haywood Mnr Maxwell, TX | 3.0 | 2.0 | 1533 | $1,850 | $1.21 | 6d | 1 | 0.91mi |
| 312 Soapstone Pass Maxwell, TX | 3.0 | 2.0 | 1450 | $1,600 | $1.10 | 45d | 1 | 0.93mi |
| 124 Hidden Branch Cv Maxwell, TX | 3.0 | 2.5 | 1698 | $1,800 | $1.06 | 0d | 1 | 0.99mi |
| 566 Gabbro Gdns Maxwell, TX | 4.0 | 2.5 | 1837 | $1,850 | $1.01 | 18d | 1 | 1.00mi |
| 328 Mica Trl Maxwell, TX | 4.0 | 2.0 | 1627 | $1,595 | $0.98 | 45d | 1 | 1.00mi |
| 108 White Dunes Dr Maxwell, TX | 3.0 | 2.0 | 1514 | $1,800 | $1.19 | 19d | 1 | 1.01mi |
| 108 White Dunes Dr Maxwell, TX | 3.0 | 2.0 | 1514 | $1,800 | $1.19 | 6d | 1 | 1.01mi |
| 108 White Dunes Dr Maxwell, TX | 3.0 | 2.0 | 1514 | $1,800 | $1.19 | 25d | 1 | 1.02mi |
| 300 Geode Gln Maxwell, TX | 4.0 | 2.5 | 1712 | $1,795 | $1.05 | 45d | 1 | 1.02mi |
| 543 Gabbro Gdns Maxwell, TX | 4.0 | 2.0 | 1627 | $1,695 | $1.04 | 23d | 1 | 1.03mi |
| 146 White Dunes Dr Maxwell, TX | 3.0 | 2.5 | 1698 | $1,850 | $1.09 | 14d | 1 | 1.03mi |
| 146 White Dunes Dr Maxwell, TX | 3.0 | 2.0 | 1698 | $1,850 | $1.09 | 45d | 1 | 1.03mi |
| 192 Gabbro Gdns Maxwell, TX | 4.0 | 2.5 | 1610 | $1,699 | $1.06 | 45d | 1 | 1.05mi |
| 230 Gabbro Gdns Maxwell, TX | 3.0 | 2.0 | 1440 | $1,500 | $1.04 | 19d | 1 | 1.06mi |
| 147 Gabbro Gdns Maxwell, TX | 3.0 | 2.0 | 1450 | $1,441 | $0.99 | 45d | 1 | 1.07mi |
| 444 Delta Crst Maxwell, TX | 3.0 | 2.5 | 1830 | $1,850 | $1.01 | 6d | 1 | 1.09mi |
| 251 Tempest Trl Maxwell, TX | 3.0 | 2.0 | 1553 | $1,650 | $1.06 | 19d | 1 | 1.11mi |
| 151 Living Reef Dr Maxwell, TX | 3.0 | 2.5 | 1782 | $1,895 | $1.06 | 6d | 1 | 1.13mi |
| 274 Jade St Maxwell, TX | 4.0 | 2.0 | 1468 | $1,795 | $1.22 | 45d | 1 | 1.14mi |
| 293 Tempest Trl Maxwell, TX | 3.0 | 2.5 | 1698 | $1,825 | $1.07 | 6d | 1 | 1.15mi |
| 195 Living Reef Dr Maxwell, TX | 3.0 | 2.5 | 1782 | $1,900 | $1.07 | 6d | 1 | 1.15mi |
| 211 Living Reef Dr Maxwell, TX | 3.0 | 2.5 | 1782 | $1,840 | $1.03 | 19d | 1 | 1.16mi |
| 170 Living Reef Dr Maxwell, TX | 3.0 | 2.0 | 1500 | $1,850 | $1.23 | 45d | 1 | 1.17mi |
| 296 Agate Cliff Dr Maxwell, TX | 3.0 | 2.0 | 1421 | $1,675 | $1.18 | 0d | 1 | 1.23mi |
| 839 Gully St Maxwell, TX | 2.0–4.0 | 2.0 | 1105 | $1,528 | $1.38 | 0d | 306 | 1.25mi |
| 704 Delta Crst Maxwell, TX | 3.0–5.0 | 2.0–3.0 | 1904 | $1,694 | $0.89 | 0d | 19 | 1.35mi |
| 214 Kyanite Dr Maxwell, TX | 4.0 | 2.5 | 1535 | $1,650 | $1.07 | 45d | 1 | 1.41mi |
| 1259 Delta Crst Maxwell, TX | 4.0 | 2.0 | 1522 | $1,695 | $1.11 | 19d | 1 | 1.45mi |
HOA detail
- Monthly dues
- $45 · $540/yr
Listing history 13 events
-
2026-04-13status Pending
-
2026-04-10price $214,990
-
2026-04-06price $217,990
-
2026-04-03price $213,990
-
2026-03-30price $212,990
-
2026-03-27price $214,990
-
2026-03-23price $216,990
-
2026-03-20price $215,990
-
2026-03-16price $217,990
-
2026-03-11price $215,990
-
2026-03-04price $220,990
-
2026-03-02price $223,990
-
2026-02-17$221,990 Active
ⓘ Source: listings_history table (triggers on properties + properties_extension) + one-shot
backfill from property_details.listing_events for pre-trigger history.
Nearby sold comps map
Loading sold comps map…
Walkable amenities ~0.75 mi
Loading nearby amenities…
Taxation est. · year 1
- Rental income
- $22,697
- − Mortgage interest
- −$12,043
- − Property taxes
- −$3,225
- − Insurance
- −$1,075
- − Repairs & maintenance
- −$1,816
- − Management
- −$1,816
- − HOA
- −$540
- − Depreciation
- −$6,254
- Taxable loss
- −$4,071
- Est. tax savings @ 24.0%
- +$977
- After-tax cash flow
- $539/yr
For passive investors: Depreciation is non-cash, so a rental often shows a tax loss while cash-flowing — sheltering income. Rental losses are passive: they offset passive income freely, and up to $25,000/yr can offset ordinary (W-2) income if you actively participate and your MAGI is under $100k (phasing out to $0 by $150k); unused losses carry forward. On sale, claimed depreciation is recaptured at up to 25%, and gains may owe capital-gains tax (a 1031 exchange can defer both). Figures are a year-1 estimate at your 24.0% rate — not tax advice; consult a CPA.
Schools (NCES district)
- District
- Lockhart ISD
- NCES district ID
- 4827870
- Math proficiency
- 27% ▼ -12.00%
- Reading proficiency
- 29% ▼ -2.00%
- Median HH income
- $48,868
- Composite
- 24.44/100
- National rank
- #7674
- State rank
- #657 of 826 in TX
Livability — San Marcos
- Score
- 81/100
- State rank
- #30
- US rank
- #1601
Category grades
Schools grade is shown separately in the Schools card above.
Census & demographics
- County
- Caldwell County · 25,195 people
- City population
- 88,583
- Metro
- Austin-Round Rock-Georgetown, TX
- Population (ZIP)
- 2,847
- Household income
- $81,346
- Rent vs Own
- Severe rent burden
- 89.0
Population outlook (Caldwell County) Hauer SSP2
- Today (2025)
- 46,557 people
- By 2030
- 49,673 · +6.7%
- By 2040
- 55,827 · +19.9%
- By 2050
- 61,832 · +32.8%
- By 2075
- 77,212 · +65.8%
- By 2100
- 89,225 · +91.6%
Race, ethnicity, and origin ACS 2023
- Neighborhood character
- Predominantly Hispanic (76%)
- Race & ethnicity
- Hispanic / Latino 76% Two or more races 21% White 20% Black 4%
- Hispanic origin (detail)
- Mexican 72%
- Common ancestry
- Romanian 4% Slovak 2% Lithuanian 1%
- Foreign-born
- 18% · Canada
- Languages at home
- 45% English-only · Spanish 55%
Political lean MEDSL · Caldwell
- 2024 margin
- R (+14.4) · D 42.2% · R 56.6% · Other 1.2%
- 2008→2024 swing
- -8.4pp toward R · 2008: -6.0pp · 2024: -14.4pp
- All cycles
- 2024: R+14.4 2020: R+9.1 2016: R+15.8 2012: R+11.1 2008: R+6.0
Not yet ingested
- Civics
- —
Market trends
- HPI YoY
- ▼ -1.02%
- Current HPI
- 228.3622
- Rent YoY
- ▼ -5.36%
- Metro
- Austin-Round Rock-Georgetown, TX
- State GDP YoY
- ▲ 3.95%
- F500 in state
- 110
Industry mix (Fortune 500 HQ in TX)
| Industry | F500 HQs | Revenue |
|---|---|---|
| Energy | 16 | $1,198B |
|
||
| Technology | 5 | $198B |
|
||
| Engineering / Construction | 4 | $72B |
|
||
| Energy Services | 3 | $60B |
|
||
| Utilities | 3 | $41B |
|
||
| Healthcare | 2 | $330B |
|
||
Price history
-3.2% since first listed13 events — show timeline
- 2026-04-13 Pending — Unlock MLS
- 2026-04-10 Price Changed $214,990 Unlock MLS
- 2026-04-06 Price Changed $217,990 Unlock MLS
- 2026-04-03 Price Changed $213,990 Unlock MLS
- 2026-03-30 Price Changed $212,990 Unlock MLS
- 2026-03-27 Price Changed $214,990 Unlock MLS
- 2026-03-23 Price Changed $216,990 Unlock MLS
- 2026-03-20 Price Changed $215,990 Unlock MLS
- 2026-03-16 Price Changed $217,990 Unlock MLS
- 2026-03-11 Price Changed $215,990 Unlock MLS
- 2026-03-04 Price Changed $220,990 Unlock MLS
- 2026-03-02 Price Changed $223,990 Unlock MLS
- 2026-02-17 Listed $221,990 Unlock MLS
Cash-flow waterfall
monthlySold comps — $/sqft
last 12 mo · ≤1 miLoading sold comps…