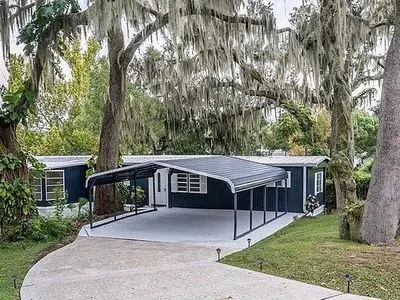
17336 Palm Dr · Montverde, FL
Flood risk 1/10 · Minimal
- FEMA flood zone
- X (unshaded)
- Chance of flooding over 30 yrs
- 0.0%
- Est. flood insurance / yr
- $507 – $1,088
Fire risk 3/10 · Minor
- Est. fire insurance / yr
- $947 – $1,759
Heat risk 8/10 · Major
- Hot days now (above 108°F)
- 7 days/yr
- Hot days in 30 yrs
- 23 days/yr
Wind risk 9/10 · Severe
- Chance of severe wind over 30 yrs
- 99.0%
Air-quality risk 1/10 · Minimal
- Unhealthy air days now
- 0 days/yr
- Unhealthy air days in 30 yrs
- 0 days/yr
Risk factors via First Street. Map © Google.
Why this score? — see what drove the B+ grade
The composite is a weighted blend of 9 inputs, each scored 0–100. Each bar is that input's sub-score; the figure is the points it added to the 100-point composite (weight × sub-score).
- Cash flow +30.0/30.0
- ARV discount +11.1/15.0
- 1% rule +10.0/10.0
- DSCR +10.0/10.0
- Schools +4.2/10.0
- Livability +3.3/5.0
- Rent growth +2.5/5.0
- Condition / age +2.5/5.0
- Appreciation +2.3/10.0
$230,000
🖨 Deal sheet 📄 Offer letter ✓ Due diligence
Listing remarks MLS
Buyers financing fell through!! Home and Engineering inspections plus Appraisal have been completed with no issues!! Walk right into this home with confidence. Welcome to the Town of Montverde! We have a freshly renovated waterfront home, 2 bedroom and 2 bathroom on a canal that leads out to Lake Apopka. Bring your boat and jet ski as it has a covered dock with two slips. When you pull up to the house there is a large carport with covered parking. Entering the home, the living room is in front of you and the large open kitchen is to the left. As you go past the kitchen down the hall it takes you to the master bedroom. On the other side of the hallway is an addition that features a long wide hallway with many windows that gives you a beautiful view of the canal and out to lake Apopka. At the end of the hall, around the corner is a set of double doors that leads out to a very big and spacious family room which also overlooks the canal and lets in a lot of natural light. This room would be a perfect work-out area or a possible third bedroom. On the other end of the house is the spare bathroom and spare bedroom. There are several doors that gives access to the backyard where you will be able to enjoy the newly painted dock for your preferred watercraft. Located just a short distance down the canal from Lake Apopka makes it very convenient for a quick fishing trip or a sunset ride on the water. The right half of the backyard is fenced in. There is also a well kept shed in the backyard which would be great for storing all your tackle and outdoor equipment!! This home was just completely renovated from top to bottom including the underside!! Come take a look and check it out for yourself! Call today to set up a private showing.
Key facts
- Waterfront views
- Waterfront home
- Private dock
Tags
Neighborhood map
What this means for you Summary
Snapshot
- This is a 3-bed/2.0-bath manufactured listed at $230k.
Deal economics
- At list price, monthly cash flow is $1k ($15k/yr) — positive.
- The deal already cash-flows at list — no discount required.
- Meets the 1% rule at list price ($4k rent vs $230k).
- Cap rate 12.9% vs local median 2.2% in Montverde — top-decile yield for the area; either an underpriced asset or a hidden risk that comps aren't pricing in. Stress-test before assuming the spread holds.
Location & tenants
- Location reads 66/100 on livability (#598 in FL) — a middle-class / working-renter tenant base. Strengths: crime A+, employment A+, housing A+; Watch: cost of living D, amenities F, commute F.
- Lake (suburban): math 49% / reading 50% proficiency, ranked #37 of 73 in FL (top 51%) — families likely to look elsewhere, expect single-tenant / working-renter base with shorter leases.
- Market conditions: 199 active listings in the ZIP; 2 comparable units currently listed for rent nearby; solid renter incomes; 4,799 units permitted in Lake County in 2024 (814 in 5+ unit buildings).
- This rent runs 40% of the median local income ($108k/yr) — at the standard rent-burdened threshold; future hikes will face affordability resistance.
Forward outlook
- Local home prices are declining (-3.0%/yr); year-one equity from $2k of loan paydown is wiped out by about $7k of value loss. Plan a longer hold.
- Lake County population projected at +37% by 2050 — long-run rental-demand tailwind backs the buy-and-hold thesis.
- At projected returns (-3.0% appreciation + 3.0% rent growth), your $64k cash investment doubles in ~6 years — after that, you're playing with house money.
Negotiation context
- Only 9 days on market — expect competitive offers; lowballing is unlikely to land.
- 8 sale attempts since 20y ago with the ask held roughly flat each time — persistent listings suggest the price (not the market) is what's stuck; bring a comps-based counter.
Risks & watch-outs
- Climate carrying-cost: severe wind risk, 99% chance of damaging wind over 30y; extreme-heat days projected 7→23/yr by 2055 (HVAC capex compounding) — expect insurance premiums to compound above CPI over the hold.
Questions for the listing agent
- Is there a deadline driving the sale (1031 exchange, divorce, estate, relocation)? That informs how much negotiation room exists.
- What's the average days-on-market for RENTAL listings here right now (not sales)? A rising rental-DOM trend means longer vacancies and softer asking-rent achievability than the comps imply.
- What's the recent tenant-quality profile in this submarket — average credit score on applications, eviction rate, late-payment / NSF rate, and stable-employment percentage? A property-management company in the area should have these aggregated.
- How much new for-sale + rental construction is in the pipeline within 1–3 miles? Heavy new supply typically softens prices + rents 12–24 months out; constrained supply supports both.
Investment metrics
- 1% rule
- 1.55% ✓
- Cap rate
- 12.86%
- Cash-on-cash
- 23.46%
- DSCR
- 2.04
- GRM
- 5.4
CMA / ARV
- ARV (on-the-fly)
- $249,996
- Comps found
- 2
Show comp detail 2 sales within ~0.75 mi
| Address | Dist | Beds/Ba | Sqft | Sold | Price | $/sf | Match |
|---|---|---|---|---|---|---|---|
| 17502 Eve Dr | 0.22mi | 3/2.0 | 1,600 (+6%) | 6mo | $265,000 | $166 | 74 |
| 17551 Temple St | 0.60mi | 3/2.0 | 1,701 (+13%) | 2mo | $280,000 | $165 | 49 |
Match score weights: distance 35% · size 25% · config 20% · recency 20%. Top-matched comps best support the ARV.
Projected returns pro-forma
-3.0% appreciation · 3.0% rent growth · sell at horizon
- IRR
- 16.6%
- Equity multiple
- 1.67×
- Total profit
- $42,966
- Equity at exit
- $34,294
- IRR
- 25.1%
- Equity multiple
- 3.19×
- Total profit
- $140,839
- Equity at exit
- $19,886
Cash invested: $64,400 (down + closing). Projections, not guarantees.
Landlord ↔ Tenant lean methodology
- Overall (STATE)
- 87 Strongly Landlord-Friendly
- State Florida
- 87 Strongly Landlord-Friendly · R+3
- County
- — inherits STATE
- City
- — inherits STATE
ZIP-level market 34756
- Home prices YoY
- -1.3%
- Active inventory
- 199
- Price-to-rent
- 5.4×
Monthly cashflow live
- Estimated rent
- $3,576 medium interval (Pro) →
- Mortgage (P&I)
- −$1,206
- Tax from tax record
- −$264 /mo · $3,164/yr
- Insurance
- −$96
- HOA
- −$0
- Vacancy / Maint / Mgmt
- −$751
- Net cashflow
- $1,259
Break-even live
UW: 25.0% down · 7.5% · 30yr · 1.5% tax · 5.0% vac · 8.0% maint · 8.0% mgmt
Financing live
Cash to close
- Down payment
- $57,500
- Closing costs
- $6,900
- Reserves months
- —
- Total cash needed
- —
Loan-product check · same deal, 3 products live
Conventional
25% down · 7.5% · 30yr
- Down + closing
- —
- Monthly P&I
- —
- Monthly cashflow
- —
- DSCR
- —
- Eligible?
- —
Personal DTI + credit; lowest rate.
DSCR
20% down · 8.5% · 30yr
- Down + closing
- —
- Monthly P&I
- —
- Monthly cashflow
- —
- DSCR
- —
- Eligible?
- —
No personal income docs; deal must DSCR.
Hard money
10% down · 12.0% · 12mo
- Down + closing
- —
- Monthly P&I
- —
- Monthly cashflow
- —
- DSCR
- —
- Eligible?
- —
Short-term bridge; refi at stabilization.
Rent comps 2 comps
| Address | Beds | Baths | Sqft | Rent | $/sqft | DOM | Units | Dist |
|---|---|---|---|---|---|---|---|---|
| 17530 County Road 455 Montverde, FL | 3.0 | 2.0 | 1724 | $2,400 | $1.39 | 20d | 1 | 0.89mi |
| 16300 County Road 455 #401 Montverde, FL | 3.0 | 3.0 | 1568 | $3,750 | $2.39 | 21d | 1 | 1.03mi |
Listing history 15 events
-
2026-06-18days on market $230,000 Active 9 DOM
-
2026-06-17days on market $230,000 Active 8 DOM
-
2026-06-16days on market $230,000 Active 7 DOM
-
2026-06-15days on market $230,000 Active 6 DOM
-
2026-06-13days on market $230,000 Active 4 DOM
-
2026-06-10pricedays on market $230,000 Active 1 DOM
-
2026-06-09days on market $240,000 Active 10 DOM
-
2026-06-08days on market $240,000 Active 9 DOM
-
2026-06-07days on market $240,000 Active 8 DOM
-
2026-06-04days on market $240,000 Active 5 DOM
-
2026-06-03days on market $240,000 Active 4 DOM
-
2026-06-02days on market $240,000 Active 3 DOM
-
2026-06-02days on market $240,000 Active 2 DOM
-
2026-05-31remarks 699-char remark
-
2026-05-31$240,000 Active 1 DOM
ⓘ Source: listings_history table (triggers on properties + properties_extension) + one-shot
backfill from property_details.listing_events for pre-trigger history.
Tax reassessment forecast FL · Resets to sale price
- Current annual tax
- $3,164 · $264/mo
- Projected year-2 tax
- $3,164 · $264/mo
- Expected delta
- $0/yr ($0/mo · 0.0%)
ⓘ Screening estimate from a state-policy table — verify with the county assessor before closing.
Climate risk First Street
- Flood 1/10 Low FEMA zone X (unshaded) · 0% chance over 30 yrs
- Wildfire 3/10 Moderate
- Heat 8/10 Severe 7 d/yr ≥108°F today · 23 d/yr by 30 yrs out
- Wind 9/10 Extreme 99% chance of damaging wind over 30 yrs
- Air quality 1/10 Low 0 unhealthy d/yr today · 0 by 30 yrs out
Nearby sold comps map
Loading sold comps map…
Walkable amenities ~0.75 mi
Loading nearby amenities…
Taxation est. · year 1
- Rental income
- $42,909
- − Mortgage interest
- −$12,884
- − Property taxes
- −$3,164
- − Insurance
- −$1,150
- − Repairs & maintenance
- −$3,433
- − Management
- −$3,433
- − Depreciation
- −$6,691
- Taxable income
- $12,155
- Est. tax owed @ 24.0%
- −$2,917
- After-tax cash flow
- $12,193/yr
For passive investors: Depreciation is non-cash, so a rental often shows a tax loss while cash-flowing — sheltering income. Rental losses are passive: they offset passive income freely, and up to $25,000/yr can offset ordinary (W-2) income if you actively participate and your MAGI is under $100k (phasing out to $0 by $150k); unused losses carry forward. On sale, claimed depreciation is recaptured at up to 25%, and gains may owe capital-gains tax (a 1031 exchange can defer both). Figures are a year-1 estimate at your 24.0% rate — not tax advice; consult a CPA.
Schools (NCES district)
- District
- Lake
- NCES district ID
- 1201050
- Math proficiency
- 49% ▼ -7.00%
- Reading proficiency
- 50% ▼ -4.00%
- Median HH income
- $46,632
- Composite
- 42.05/100
- National rank
- #3327
- State rank
- #37 of 73 in FL
Livability — Montverde
- Score
- 66/100
- State rank
- #598
- US rank
- #11453
Category grades
Schools grade is shown separately in the Schools card above.
Census & demographics
- County
- Lake County · 364,602 people
- City population
- 4,876
- Metro
- Orlando-Kissimmee-Sanford, FL
- Population (ZIP)
- 4,876
- Household income
- $108,500
- Rent vs Own
- Severe rent burden
- 24.0
Population outlook (Lake County) Hauer SSP2
- Today (2025)
- 386,640 people
- By 2030
- 417,107 · +7.9%
- By 2040
- 476,676 · +23.3%
- By 2050
- 531,296 · +37.4%
- By 2075
- 648,303 · +67.7%
- By 2100
- 698,530 · +80.7%
Race, ethnicity, and origin ACS 2023
- Neighborhood character
- Predominantly White (74%)
- Race & ethnicity
- White 74% Hispanic / Latino 17% Two or more races 6% Black 5%
- Hispanic origin (detail)
- Mexican 6% Puerto Rican 4% Cuban 6%
- Common ancestry
- Romanian 4% Italian 2% Lithuanian 1%
- Foreign-born
- 6% · Canada, Mexico, Jamaica
- Languages at home
- 84% English-only · Spanish 14% Arabic 2% Other Indo-European 1%
Political lean MEDSL · Lake
- 2024 margin
- Strong R (+24.7) · D 37.3% · R 62.0%
- 2008→2024 swing
- -11.2pp toward R · 2008: -13.5pp · 2024: -24.7pp
- All cycles
- 2024: R+24.7 2020: R+20.0 2016: R+23.1 2012: R+17.1 2008: R+13.5
Not yet ingested
- Civics
- —
Market trends
- HPI YoY
- ▼ -5.42%
- Current HPI
- 410.9213
- Rent YoY
- —
- Metro
- Orlando-Kissimmee-Sanford, FL
- State GDP YoY
- ▲ 3.28%
- F500 in state
- 36
Industry mix (Fortune 500 HQ in FL)
| Industry | F500 HQs | Revenue |
|---|---|---|
| Industrial Technology | 2 | $29B |
|
||
| Insurance | 2 | $17B |
|
||
| Retail | 1 | $60B |
|
||
| Technology Distribution | 1 | $58B |
|
||
| Homebuilding | 1 | $35B |
|
||
| Technology Manufacturing | 1 | $35B |
|
||
Price history
+1500.0% since first listed26 events — show timeline
- 2026-05-31 Listed $240,000 FSBO.com
- 2024-05-08 Sold (Public Records) $215,000 Public Records
- 2024-05-03 Sold (MLS) $215,000 Stellar MLS as Distributed by MLS Grid
- 2024-03-22 Pending — Stellar MLS as Distributed by MLS Grid
- 2024-03-19 Relisted — Stellar MLS as Distributed by MLS Grid
- 2024-02-16 Pending — Stellar MLS as Distributed by MLS Grid
- 2024-02-13 Price Changed $229,000 Stellar MLS as Distributed by MLS Grid
- 2024-01-18 Relisted — Stellar MLS as Distributed by MLS Grid
- 2024-01-14 Pending — Stellar MLS as Distributed by MLS Grid
- 2024-01-02 Price Changed $239,000 Stellar MLS as Distributed by MLS Grid
- 2023-11-13 Price Changed $259,000 Stellar MLS as Distributed by MLS Grid
- 2023-10-24 Relisted — Stellar MLS as Distributed by MLS Grid
- 2023-10-17 Pending — Stellar MLS as Distributed by MLS Grid
- 2023-09-23 Price Changed $269,000 Stellar MLS as Distributed by MLS Grid
- 2023-09-01 Listed $289,000 Stellar MLS as Distributed by MLS Grid
- 2023-05-15 Listed $65,000 Stellar MLS as Distributed by MLS Grid
- 2023-05-15 Sold (MLS) $65,000 Stellar MLS as Distributed by MLS Grid
- 2016-12-22 Sold (Public Records) $103,000 Public Records
- 2016-12-12 Sold (MLS) $103,000 Stellar MLS as Distributed by MLS Grid
- 2016-10-07 Pending — Stellar MLS as Distributed by MLS Grid
- 2016-09-08 Listed $109,000 Stellar MLS as Distributed by MLS Grid
- 2007-03-02 Sold (MLS) $109,000 Stellar MLS as Distributed by MLS Grid
- 2006-04-10 Listed $129,900 Stellar MLS as Distributed by MLS Grid
- 2000-12-07 Sold (Public Records) $142,142 Public Records
- 1990-12-01 Sold (Public Records) $30,100 Public Records
- 1982-10-01 Sold (Public Records) $15,000 Public Records
Property tax history
+9.7%/yrLatest (2025): $3,164 · +17.5% YoY. Source: county tax records.
Cash-flow waterfall
monthlySold comps — $/sqft
last 12 mo · ≤1 miLoading sold comps…