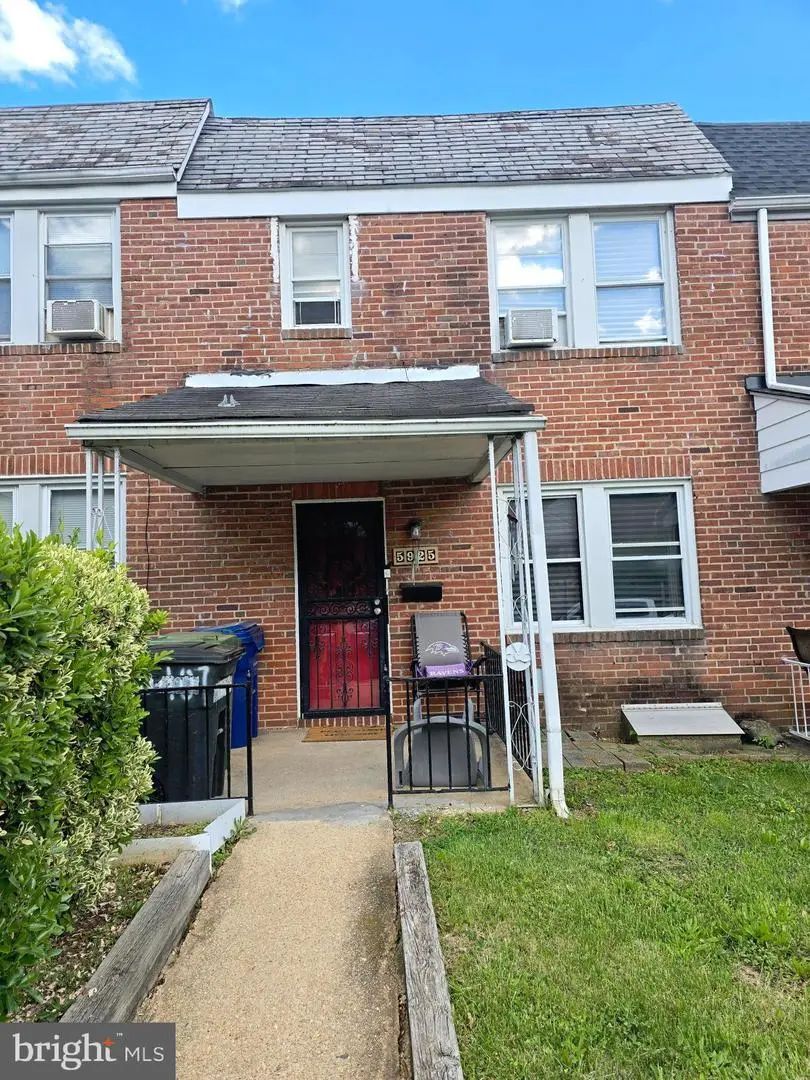
5925 Benton Heights Ave · Baltimore, MD
Flood risk 1/10 · Minimal
- FEMA flood zone
- X (unshaded)
- Chance of flooding over 30 yrs
- 0.0%
- Est. flood insurance / yr
- $473 – $860
Fire risk 1/10 · Minimal
- Est. fire insurance / yr
- $755 – $1,403
Heat risk 7/10 · Major
- Hot days now (above 103°F)
- 7 days/yr
- Hot days in 30 yrs
- 15 days/yr
Wind risk 6/10 · Moderate
- Chance of severe wind over 30 yrs
- 27.0%
Air-quality risk 5/10 · Moderate
- Unhealthy air days now
- 6 days/yr
- Unhealthy air days in 30 yrs
- 8 days/yr
Risk factors via First Street. Map © Google.
Why this score? — see what drove the C+ grade
The composite is a weighted blend of 9 inputs, each scored 0–100. Each bar is that input's sub-score; the figure is the points it added to the 100-point composite (weight × sub-score).
- Cash flow +24.7/30.0
- ARV discount +10.7/15.0
- DSCR +8.0/10.0
- 1% rule +6.5/10.0
- Livability +3.8/5.0
- Rent growth +3.6/5.0
- Condition / age +2.5/5.0
- Schools +1.0/10.0
- Appreciation +0.0/10.0
$165,000
🖨 Deal sheet 📄 Offer letter ✓ Due diligence
Listing remarks MLS
Great opportunity in this 3 bedroom 2 bath home! Covered front porch, hardwood floors, partially finished basement, separate dining room, covered rear porch and more! This is a Fannie Mae Homepath Property. This property is approved for Homepath Renovation Mortgage Financing.
Key facts
- Built 1948
- Listed 43 days
Property features AI
Finance
- Other: Ownership: Ground Rent
- HOA & community: Ground rent $90 annually
Exterior
- Parking: On-street parking
- Utilities: Public water; Public sewer; Natural gas service
- Home design: End of Row/Townhouse
- Construction: Brick construction; Other foundation type; Built (year source: Assessor)
- Exterior features: End of row townhouse; Above-grade and below-grade structures noted
Interior
- Kitchen: Stove; Refrigerator
- Bedrooms: Three bedrooms on the upper level
- Bathrooms: Two full bathrooms (one on upper level, one on lower level)
- Heating & cooling: Radiator heating with natural gas; Central air conditioning (natural gas)
- Interior features: Fully finished basement
- Laundry & utility: Washer; Dryer; Radiator heating; Natural gas hot water
Neighborhood map
What this means for you Summary
Snapshot
- This is a 3-bed/2.0-bath townhouse listed at $165k.
Deal economics
- At list price, monthly cash flow is $344 ($4k/yr) — positive.
- The deal already cash-flows at list — no discount required.
- Meets the 1% rule at list price ($2k rent vs $165k).
- Recommended offer: $160k (3.0% below list) — sets the bar for market timing.
- Cap rate 8.8% vs local median 6.0% in Baltimore — top-decile yield for the area; either an underpriced asset or a hidden risk that comps aren't pricing in. Stress-test before assuming the spread holds.
Location & tenants
- Location reads 76/100 on livability (#90 in MD, #3,396 nationally) — a middle-class / working-renter tenant base. Strengths: amenities A+, commute A+, housing A+; Watch: schools D, crime F.
- Baltimore City Public Schools (urban): math 7% / reading 16% proficiency, ranked #24 of 24 in MD (top 100%) — low school quality limits family demand, transient renter base, plan for 1-2y turnover; 79% free/reduced lunch — lower-income household profile, screen leases tightly.
- Market conditions: Rents rising fast (+4.4%/yr); 173 active listings in the ZIP; 39 comparable units currently listed for rent nearby; rentals at typical pace (median 24d on market — plan ~3-4 weeks tenant-placement turnaround); 1,273 units permitted in Baltimore city in 2024 (1,104 in 5+ unit buildings).
- This rent runs 35% of the median local income ($65k/yr) — at the standard rent-burdened threshold; future hikes will face affordability resistance.
Forward outlook
- Local home prices are declining (-3.0%/yr); year-one equity from $1k of loan paydown is wiped out by about $5k of value loss. Plan a longer hold.
- Baltimore County population projected to shrink 4% by 2050 — rents likely to lag national; underwrite the cash flow, not the appreciation.
- At projected returns (-3.0% appreciation + 4.4% rent growth), your $46k cash investment doubles in ~10 years — after that, you're playing with house money.
Negotiation context
- It's been on market 43 days — a 3% lower offer ($160k) is reasonable based on typical stale-listing flexibility.
- 14 sale attempts since 30y ago with the ask held roughly flat each time — persistent listings suggest the price (not the market) is what's stuck; bring a comps-based counter.
- Current owner paid $46k; list at $165k implies a 259% gain — meaningful room to come down on a strong offer.
Risks & watch-outs
- Watch-outs: built in 1948 — expect roof / HVAC / electrical / plumbing capex.
- Climate carrying-cost: major wind risk, 27% chance of damaging wind over 30y; extreme-heat days projected 7→15/yr by 2055 (HVAC capex compounding) — expect insurance premiums to compound above CPI over the hold.
Questions for the listing agent
- It's been on market 43 days. Have you received any prior offers? Is the seller open to a 3% concession, seller financing, or rate buy-down credit?
- Built in 1948 — when were the roof, HVAC, electrical panel, plumbing, and water heater last replaced?
- Is there a deadline driving the sale (1031 exchange, divorce, estate, relocation)? That informs how much negotiation room exists.
- Schools are D-rated, which usually means shorter tenancies and higher turnover. Who's the typical renter profile here, and what's been the actual vacancy rate?
- Crime grade is F in this area — have there been break-ins, vandalism, or insurance claims at this property in the last 3 years? What carrier currently insures it and at what premium?
- What's the average days-on-market for RENTAL listings here right now (not sales)? A rising rental-DOM trend means longer vacancies and softer asking-rent achievability than the comps imply.
- What's the recent tenant-quality profile in this submarket — average credit score on applications, eviction rate, late-payment / NSF rate, and stable-employment percentage? A property-management company in the area should have these aggregated.
- How much new for-sale + rental construction is in the pipeline within 1–3 miles? Heavy new supply typically softens prices + rents 12–24 months out; constrained supply supports both.
Investment metrics
- 1% rule
- 1.15% ✓
- Cap rate
- 8.80%
- Cash-on-cash
- 8.95%
- DSCR
- 1.40
- GRM
- 7.3
CMA / ARV
- ARV (median comp)
- $177,749
- List price
- $165,000
- Delta
- -7.17%
- Verdict
- FAIR
- Comps
- 20 within 1.0 mi
Show comp detail 12 sales within ~0.75 mi
| Address | Dist | Beds/Ba | Sqft | Sold | Price | $/sf | Match |
|---|---|---|---|---|---|---|---|
| 4108 White Ave | 0.19mi | 3/2.0 | 1,152 (0%) | 5mo | $108,500 | $94 | 87 |
| 3723 Bayonne Ave | 0.34mi | 3/1.5 | 1,200 (+4%) | 0mo | $230,000 | $192 | 75 |
| 3828 Bayonne Ave | 0.25mi | 4/3.0 (+1) | 1,152 (0%) | 5mo | $233,000 | $202 | 75 |
| 3710 Raspe Ave | 0.28mi | 3/1.0 | 1,152 (0%) | 10mo | $175,000 | $152 | 75 |
| 5903 Lillyan Ave | 0.14mi | 3/2.0 | 1,024 (-11%) | 7mo | $200,000 | $195 | 69 |
| 3706 Springwood Ave | 0.24mi | 3/1.5 | 1,024 (-11%) | 0mo | $155,000 | $151 | 68 |
| 4217 Berger Ave | 0.55mi | 3/2.5 | 1,168 (+1%) | 7mo | $185,000 | $158 | 64 |
| 5876 Belair Rd | 0.12mi | 2/1.5 (-1) | 1,044 (-9%) | 9mo | $149,000 | $143 | 64 |
| 4332 Berger Ave | 0.56mi | 3/2.0 | 1,212 (+5%) | 8mo | $175,000 | $144 | 58 |
| 5904 Willet Ave | 0.48mi | 2/1.0 (-1) | 1,258 (+9%) | 5mo | $180,000 | $143 | 49 |
| 5421 Belle Vista Ave | 0.60mi | 3/2.0 | 1,320 (+15%) | 8mo | $235,000 | $178 | 41 |
| 6421 Cedonia Ave | 0.68mi | 3/1.0 | 1,320 (+15%) | 0mo | $170,000 | $129 | 40 |
Match score weights: distance 35% · size 25% · config 20% · recency 20%. Top-matched comps best support the ARV.
Projected returns pro-forma
-3.0% appreciation · 4.43% rent growth · sell at horizon
- IRR
- -1.1%
- Equity multiple
- 0.96×
- Total profit
- $-2,001
- Equity at exit
- $24,602
- IRR
- 10.0%
- Equity multiple
- 1.83×
- Total profit
- $38,315
- Equity at exit
- $14,266
Cash invested: $46,200 (down + closing). Projections, not guarantees.
Landlord ↔ Tenant lean methodology
- Overall (CITY)
- 12 Strongly Tenant-Friendly
- State Maryland
- 27 Tenant-Leaning · D+14
- County
- — inherits STATE
- City Baltimore
- 12 Strongly Tenant-Friendly · D+58
ZIP-level market 21206
- Rents YoY
- 4.4%
- Active inventory
- 173
- Price-to-rent
- 7.3×
Monthly cashflow live
- Estimated rent
- $1,892 high interval (Pro) →
- Mortgage (P&I)
- −$865
- Tax from tax record
- −$216 /mo · $2,593/yr
- Insurance
- −$69
- HOA
- −$0
- Vacancy / Maint / Mgmt
- −$397
- Net cashflow
- $344
Break-even live
UW: 25.0% down · 7.5% · 30yr · 1.5% tax · 5.0% vac · 8.0% maint · 8.0% mgmt
Financing live
Cash to close
- Down payment
- $41,250
- Closing costs
- $4,950
- Reserves months
- —
- Total cash needed
- —
Loan-product check · same deal, 3 products live
Conventional
25% down · 7.5% · 30yr
- Down + closing
- —
- Monthly P&I
- —
- Monthly cashflow
- —
- DSCR
- —
- Eligible?
- —
Personal DTI + credit; lowest rate.
DSCR
20% down · 8.5% · 30yr
- Down + closing
- —
- Monthly P&I
- —
- Monthly cashflow
- —
- DSCR
- —
- Eligible?
- —
No personal income docs; deal must DSCR.
Hard money
10% down · 12.0% · 12mo
- Down + closing
- —
- Monthly P&I
- —
- Monthly cashflow
- —
- DSCR
- —
- Eligible?
- —
Short-term bridge; refi at stabilization.
Rent comps 39 comps
| Address | Beds | Baths | Sqft | Rent | $/sqft | DOM | Units | Dist |
|---|---|---|---|---|---|---|---|---|
| 5906 Benton Heights Ave Baltimore, MD | 2.0 | 1.0 | 780 | $1,350 | $1.73 | 43d | 1 | 0.04mi |
| 4111 Century Rd Baltimore, MD | 3.0 | 1.5 | 1432 | $2,500 | $1.75 | 43d | 1 | 0.11mi |
| 5632 Belair Rd Baltimore, MD | 3.0 | 1.5 | 1260 | $2,100 | $1.67 | 23d | 1 | 0.41mi |
| 4308 Hamilton Ave Baltimore, MD | 2.0 | 1.0 | 1110 | $1,416 | $1.28 | 23d | 1 | 0.42mi |
| 3607 Bayonne Ave Unit 2 Baltimore, MD | 2.0 | 1.0 | 900 | $1,300 | $1.44 | 23d | 1 | 0.47mi |
| 5424 Belle Vista Ave Baltimore, MD | 2.0 | 1.0 | 932 | $1,300 | $1.39 | 43d | 1 | 0.56mi |
| 6410 Walther Ave Baltimore, MD | 2.0 | 1.0–2.0 | 1195 | $1,995 | $1.67 | 43d | 7 | 0.67mi |
| 5738 Cedonia Ave Baltimore, MD | 2.0 | 1.0 | 797 | $1,385 | $1.74 | 2d | 3 | 0.77mi |
| 3807 Fleetwood Ave Unit 1 Baltimore, MD | 2.0 | 1.0 | 969 | $1,490 | $1.54 | 4d | 1 | 0.79mi |
| 3807 Fleetwood Ave Unit 2 Baltimore, MD | 3.0 | 1.0 | 937 | $1,550 | $1.65 | 4d | 1 | 0.79mi |
| 4903 1/2 Hamilton Ave Apt B Baltimore, MD | 3.0 | 2.0 | 925 | $1,550 | $1.68 | 23d | 1 | 0.81mi |
| 4903 1/2 Hamilton Ave Unit A Baltimore, MD | 2.0 | 2.0 | 800 | $1,450 | $1.81 | 23d | 1 | 0.81mi |
| 4905 Hamilton Ave Apt B Baltimore, MD | 3.0 | 2.0 | 925 | $1,550 | $1.68 | 23d | 1 | 0.81mi |
| 4907 Hamilton Ave Unit B Baltimore, MD | 3.0 | 2.0 | 925 | $1,699 | $1.84 | 43d | 1 | 0.82mi |
| 3802 Biddison Ln Baltimore, MD | 4.0 | 1.5 | 1443 | $2,024 | $1.40 | 11d | 1 | 0.84mi |
| 4909 Hamilton Ave Baltimore, MD | 2.0–3.0 | 2.0 | 862 | $1,550 | $1.80 | 2d | 5 | 0.85mi |
| 5904 Arizona Ave Unit B Baltimore, MD | 3.0 | 2.0 | 925 | $1,550 | $1.68 | 23d | 1 | 0.87mi |
| 4007 Biddison Ln Apt 1 Baltimore, MD | 2.0 | 1.0 | 1000 | $1,279 | $1.28 | 17d | 1 | 0.88mi |
| 4023 Belwood Ave Baltimore, MD | 3.0 | 1.0 | 1080 | $1,995 | $1.85 | 43d | 1 | 0.93mi |
| 3014 Hamilton Ave Unit 1 Baltimore, MD | 2.0 | 1.0 | 850 | $1,575 | $1.85 | 23d | 1 | 0.97mi |
| 3033 Hamilton Ave Unit 1R Baltimore, MD | 2.0 | 1.0 | 720 | $1,195 | $1.66 | 4d | 1 | 0.97mi |
| 4104 Parkwood Ave Baltimore, MD | 3.0 | 1.0 | 1224 | $2,800 | $2.29 | 23d | 1 | 1.00mi |
| 5938 Clayton Ave Baltimore, MD | 4.0 | 2.0 | 1296 | $2,872 | $2.22 | 16d | 1 | 1.02mi |
| 3021 Echodale Ave Unit 2 Baltimore, MD | 2.0 | 1.0 | 750 | $999 | $1.33 | 43d | 1 | 1.04mi |
| 3158 Woodring Ave Parkville, MD | 3.0 | 1.5 | 1500 | $1,950 | $1.30 | 23d | 1 | 1.10mi |
| 4924 Frankford Ave Baltimore, MD | 4.0 | 2.0 | 1176 | $2,600 | $2.21 | 23d | 1 | 1.16mi |
| 3309 Southern Ave Unit 2 Baltimore, MD | 2.0 | 1.0 | 1200 | $1,600 | $1.33 | 12d | 1 | 1.17mi |
| 2805 Hamilton Ave Baltimore, MD | 4.0 | 2.0 | 1416 | $2,300 | $1.62 | 43d | 1 | 1.20mi |
| 4517 Woodlea Ave Baltimore, MD | 2.0 | 2.0 | 1326 | $1,900 | $1.43 | 2d | 1 | 1.24mi |
| 3010 Woodring Ave Unit 2 Baltimore, MD | 2.0 | 1.0 | 900 | $1,600 | $1.78 | 43d | 1 | 1.26mi |
| 2900 Ailsa Ave Apt 2 Baltimore, MD | 3.0 | 1.0 | 1300 | $1,750 | $1.35 | 4d | 1 | 1.29mi |
| 2604 Hamilton Ave Apt 2 Baltimore, MD | 2.0 | 1.0 | 850 | $1,195 | $1.41 | 43d | 1 | 1.30mi |
| 5313 Todd Ave Baltimore, MD | 3.0 | 1.5 | 1280 | $1,800 | $1.41 | 16d | 1 | 1.31mi |
| 2804 Christopher Ave Baltimore, MD | 3.0 | 2.5 | 1280 | $2,200 | $1.72 | 23d | 1 | 1.31mi |
| 5600 Birchwood Ave Unit 2 Baltimore, MD | 2.0 | 1.0 | 850 | $1,600 | $1.88 | 43d | 1 | 1.37mi |
| 2807 Shirey Ave Baltimore, MD | 4.0 | 3.0 | 1190 | $2,500 | $2.10 | 14d | 1 | 1.39mi |
| 6042 Barstow Rd Baltimore, MD | 1.0–3.0 | 1.0 | 736 | $1,527 | $2.07 | 2d | 1 | 1.39mi |
| 35-C Mopec Cir Nottingham, MD | 2.0 | 1.0 | 1100 | $1,445 | $1.31 | 2d | 10 | 1.40mi |
| 5253 Cedgate Rd Unit 1 Baltimore, MD | 3.0 | 1.5 | 1152 | $2,200 | $1.91 | 43d | 1 | 1.42mi |
Listing history 48 events
-
2026-06-18days on market $165,000 Active 43 DOM
-
2026-06-17days on market $165,000 Active 42 DOM
-
2026-06-16days on market $165,000 Active 41 DOM
-
2026-06-15days on market $165,000 Active 40 DOM
-
2026-06-13days on market $165,000 Active 38 DOM
-
2026-06-09days on market $165,000 Active 34 DOM
-
2026-06-08pricedays on market $165,000 Active 33 DOM
-
2026-06-07days on market $170,000 Active 32 DOM
-
2026-06-04days on market $170,000 Active 29 DOM
-
2026-06-03days on market $170,000 Active 28 DOM
-
2026-06-02days on market $170,000 Active 27 DOM
-
2026-06-01days on market $170,000 Active 26 DOM
-
2026-05-31days on market $170,000 Active 25 DOM
-
2026-05-06$170,000 Active 1006-char remark
-
2022-06-22price $1,400
-
2014-06-23historical 276-char remark
Show marketing remark (276 chars)
Great opportunity in this 3 bedroom 2 bath home! Covered front porch, hardwood floors, partially finished basement, separate dining room, covered rear porch and more! This is a Fannie Mae Homepath Property. This property is approved for Homepath Renovation Mortgage Financing.
-
2014-06-20soldstatus $46,000 Sold 276-char remark
Show marketing remark (276 chars)
Great opportunity in this 3 bedroom 2 bath home! Covered front porch, hardwood floors, partially finished basement, separate dining room, covered rear porch and more! This is a Fannie Mae Homepath Property. This property is approved for Homepath Renovation Mortgage Financing.
-
2014-06-20soldstatus $46,000
Show marketing remark (276 chars)
Great opportunity in this 3 bedroom 2 bath home! Covered front porch, hardwood floors, partially finished basement, separate dining room, covered rear porch and more! This is a Fannie Mae Homepath Property. This property is approved for Homepath Renovation Mortgage Financing.
-
2014-05-22status Contract 276-char remark
Show marketing remark (276 chars)
Great opportunity in this 3 bedroom 2 bath home! Covered front porch, hardwood floors, partially finished basement, separate dining room, covered rear porch and more! This is a Fannie Mae Homepath Property. This property is approved for Homepath Renovation Mortgage Financing.
-
2014-05-20historical
Show marketing remark (276 chars)
Great opportunity in this 3 bedroom 2 bath home! Covered front porch, hardwood floors, partially finished basement, separate dining room, covered rear porch and more! This is a Fannie Mae Homepath Property. This property is approved for Homepath Renovation Mortgage Financing.
-
2014-04-25$46,500 Active 276-char remark
Show marketing remark (276 chars)
Great opportunity in this 3 bedroom 2 bath home! Covered front porch, hardwood floors, partially finished basement, separate dining room, covered rear porch and more! This is a Fannie Mae Homepath Property. This property is approved for Homepath Renovation Mortgage Financing.
-
2014-04-25$46,500
Show marketing remark (276 chars)
Great opportunity in this 3 bedroom 2 bath home! Covered front porch, hardwood floors, partially finished basement, separate dining room, covered rear porch and more! This is a Fannie Mae Homepath Property. This property is approved for Homepath Renovation Mortgage Financing.
-
2010-08-31historical Withdrawn
-
2010-08-31historical
-
2010-03-22status Active
-
2010-03-03status Contract
-
2009-12-09Active
-
2009-12-09$115,000
-
2009-06-24historical
-
2009-06-24historical
-
2009-03-12
-
2009-03-12$124,900
-
2006-03-24historical
-
2006-02-06
-
2001-04-11soldstatus $62,000
-
2001-03-30soldstatus $62,000
-
2001-02-20historical
-
2001-02-08$67,900
-
2001-02-01historical
-
2000-12-11
-
1997-03-24soldstatus $49,900
-
1997-01-21soldstatus $49,900
-
1996-12-21historical
-
1996-12-08historical
-
1996-10-14historical
-
1996-08-28$49,900
-
1996-08-28
-
1996-08-28
ⓘ Source: listings_history table (triggers on properties + properties_extension) + one-shot
backfill from property_details.listing_events for pre-trigger history.
Tax reassessment forecast MD · Partial reset (capped growth)
- Current annual tax
- $2,593 · $216/mo
- Projected year-2 tax
- $2,593 · $216/mo
- Expected delta
- $0/yr ($0/mo · 0.0%)
ⓘ Screening estimate from a state-policy table — verify with the county assessor before closing.
Climate risk First Street
- Flood 1/10 Low FEMA zone X (unshaded) · 0% chance over 30 yrs
- Wildfire 1/10 Low
- Heat 7/10 Severe 7 d/yr ≥103°F today · 15 d/yr by 30 yrs out
- Wind 6/10 Major 27% chance of damaging wind over 30 yrs
- Air quality 5/10 Major 6 unhealthy d/yr today · 8 by 30 yrs out
Nearby sold comps map
Loading sold comps map…
Walkable amenities ~0.75 mi
Loading nearby amenities…
Taxation est. · year 1
- Rental income
- $22,703
- − Mortgage interest
- −$9,243
- − Property taxes
- −$2,593
- − Insurance
- −$825
- − Repairs & maintenance
- −$1,816
- − Management
- −$1,816
- − Depreciation
- −$4,800
- Taxable income
- $1,610
- Est. tax owed @ 24.0%
- −$386
- After-tax cash flow
- $3,748/yr
For passive investors: Depreciation is non-cash, so a rental often shows a tax loss while cash-flowing — sheltering income. Rental losses are passive: they offset passive income freely, and up to $25,000/yr can offset ordinary (W-2) income if you actively participate and your MAGI is under $100k (phasing out to $0 by $150k); unused losses carry forward. On sale, claimed depreciation is recaptured at up to 25%, and gains may owe capital-gains tax (a 1031 exchange can defer both). Figures are a year-1 estimate at your 24.0% rate — not tax advice; consult a CPA.
Schools (NCES district)
- District
- Baltimore City Public Schools
- NCES district ID
- 2400090
- Math proficiency
- 7% ▼ -9.00%
- Reading proficiency
- 16% ▼ -5.00%
- Median HH income
- $42,108
- Composite
- 10.08/100
- National rank
- #9805
- State rank
- #24 of 24 in MD
Livability — Baltimore
- Score
- 76/100
- State rank
- #90
- US rank
- #3396
Category grades
Schools grade is shown separately in the Schools card above.
Census & demographics
- Census place
- Baltimore, MD
- County
- Baltimore City · 558,601 people
- City population
- 588,727
- Metro
- Baltimore-Columbia-Towson, MD
- Population (ZIP)
- 48,902
- Household income
- $64,531
- Rent vs Own
- Severe rent burden
- 2317.0
Population outlook (Baltimore County) Hauer SSP2
- Today (2025)
- 624,249 people
- By 2030
- 621,541 · -0.4%
- By 2040
- 609,756 · -2.3%
- By 2050
- 597,249 · -4.3%
- By 2075
- 552,236 · -11.5%
- By 2100
- 513,934 · -17.7%
Race, ethnicity, and origin ACS 2023
- Neighborhood character
- Predominantly Black (73%)
- Race & ethnicity
- Black 73% White 20% Two or more races 3% Hispanic / Latino 3% Asian 2%
- Common ancestry
- Romanian 3% Ukrainian 1%
- Foreign-born
- 8% · Canada
- Languages at home
- 92% English-only · Spanish 2% Arabic 2% Other Indo-European 1%
Political lean MEDSL · Baltimore
- 2024 margin
- Solid D (+73.0) · D 85.2% · R 12.2% · Other 2.6%
- 2008→2024 swing
- -2.5pp toward R · 2008: 75.5pp · 2024: 73.0pp
- All cycles
- 2024: D+73.0 2020: D+76.6 2016: D+74.6 2012: D+76.4 2008: D+75.5
Not yet ingested
- Civics
- —
Market trends
- HPI YoY
- ▼ -191.83%
- Current HPI
- 284.5645
- Rent YoY
- ▲ 4.43%
- Metro
- Baltimore-Columbia-Towson, MD
- State GDP YoY
- ▲ 2.97%
- F500 in state
- 12
Industry mix (Fortune 500 HQ in MD)
| Industry | F500 HQs | Revenue |
|---|---|---|
| Aerospace / Defense | 1 | $71B |
|
||
| Utilities | 1 | $25B |
|
||
| Hotels | 1 | $24B |
|
||
| Consumer Goods | 1 | $7B |
|
||
| Real Estate | 1 | $6B |
|
||
| Chemicals | 1 | $2B |
|
||
Price history
+230.7% since first listed36 events — show timeline
- 2026-06-08 Price Changed $165,000 BRIGHT MLS
- 2026-05-06 Listed $170,000 BRIGHT MLS
- 2022-06-22 Price Changed $1,400 RENT.
- 2014-06-23 Delisted — MRIS
- 2014-06-20 Sold (MLS) $46,000 BRIGHT MLS
- 2014-06-20 Sold (MLS) $46,000 MRIS
- 2014-05-22 Pending — MRIS
- 2014-05-20 Listing Removed — BRIGHT MLS
- 2014-04-25 Listed $46,500 MRIS
- 2014-04-25 Listed $46,500 BRIGHT MLS
- 2010-08-31 Delisted — MRIS
- 2010-08-31 Listing Removed — BRIGHT MLS
- 2010-03-22 Relisted — MRIS
- 2010-03-03 Pending — MRIS
- 2009-12-09 Listed — MRIS
- 2009-12-09 Listed $115,000 BRIGHT MLS
- 2009-06-24 Delisted — MRIS
- 2009-06-24 Listing Removed — BRIGHT MLS
- 2009-03-12 Listed — MRIS
- 2009-03-12 Listed $124,900 BRIGHT MLS
- 2006-03-24 Delisted — MRIS
- 2006-02-06 Listed — MRIS
- 2001-04-11 Sold (Public Records) $62,000 Public Records
- 2001-03-30 Sold (MLS) $62,000 MRIS
- 2001-02-20 Delisted — MRIS
- 2001-02-08 Listed $67,900 MRIS
- 2001-02-01 Delisted — MRIS
- 2000-12-11 Listed — MRIS
- 1997-03-24 Sold (Public Records) $49,900 Public Records
- 1997-01-21 Sold (MLS) $49,900 MRIS
- 1996-12-21 Delisted — MRIS
- 1996-12-08 Delisted — MRIS
- 1996-10-14 Delisted — MRIS
- 1996-08-28 Listed — MRIS
- 1996-08-28 Listed — MRIS
- 1996-08-28 Listed $49,900 MRIS
Property tax history
-1.0%/yrLatest (2025): $2,593 · -4.3% YoY. Source: county tax records.
Cash-flow waterfall
monthlySold comps — $/sqft
last 12 mo · ≤1 miLoading sold comps…