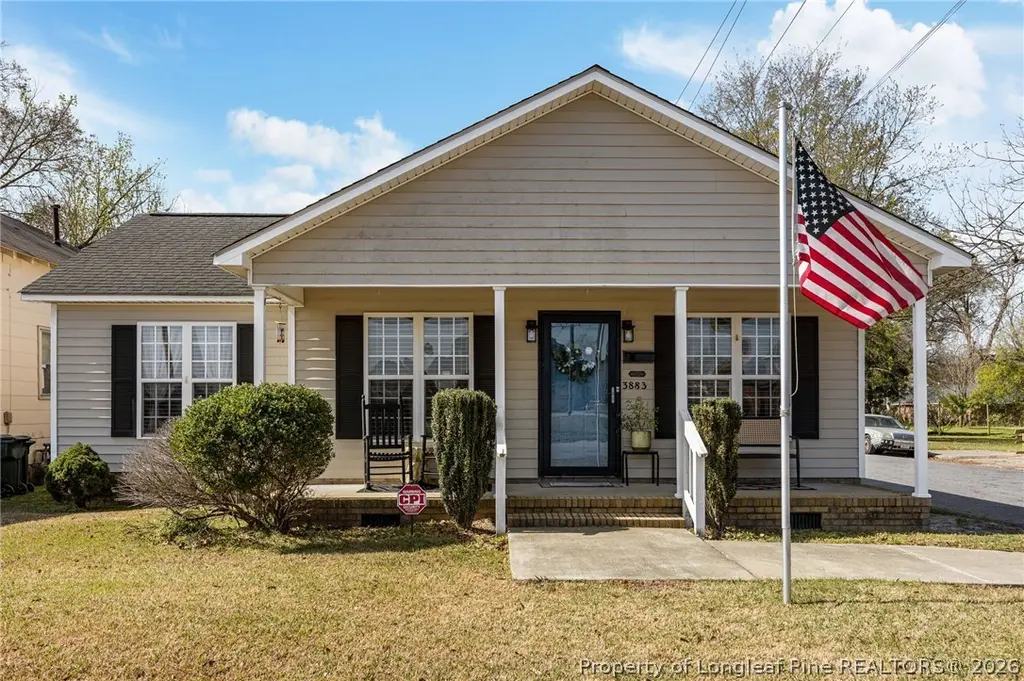
3883 W Wilson St · Farmville, NC
Flood risk 1/10 · Minimal
- FEMA flood zone
- X (unshaded)
- Chance of flooding over 30 yrs
- 0.0%
- Est. flood insurance / yr
- $507 – $1,088
Fire risk 3/10 · Minor
- Est. fire insurance / yr
- $906 – $1,684
Heat risk 7/10 · Major
- Hot days now (above 107°F)
- 7 days/yr
- Hot days in 30 yrs
- 18 days/yr
Wind risk 8/10 · Major
- Chance of severe wind over 30 yrs
- 80.0%
Air-quality risk 3/10 · Minor
- Unhealthy air days now
- 3 days/yr
- Unhealthy air days in 30 yrs
- 3 days/yr
Risk factors via First Street. Map © Google.
Why this score? — see what drove the C grade
The composite is a weighted blend of 9 inputs, each scored 0–100. Each bar is that input's sub-score; the figure is the points it added to the 100-point composite (weight × sub-score).
- Cash flow +25.6/30.0
- DSCR +8.5/10.0
- ARV discount +7.8/15.0
- 1% rule +6.2/10.0
- Schools +3.6/10.0
- Livability +3.3/5.0
- Rent growth +2.5/5.0
- Condition / age +2.5/5.0
- Appreciation +0.0/10.0
$200,000
🖨 Deal sheet (PDF) 📄 Offer letter ✓ Due diligence
Listing remarks
Looking for a low maintenance, cozy, and well priced home with easy access to Greenville? This is it! Enjoy small town living at its finest. Easy access to I-587 and HWY 264. Just 20 min to ECU campus, ECU medical center and Pitt Greenville Airport.
Key facts
- Built 2003
- Listed 13 days
Property features AI
Exterior
- Utilities: Public water; Public sewer
- Home design: Single-family residence; One-level (single story)
- Construction: Vinyl siding; Home warranty included
- Exterior features: Zoned R5 (Residential District)
Interior
- Bathrooms: 2 full bathrooms
- Heating & cooling: Heat pump heating; Central electric air conditioning
- Interior features: No fireplace; 7 total rooms
Neighborhood map
What this means for you Summary
Snapshot
- This is a 3-bed/2.0-bath single-family listed at $200k.
Deal economics
- At list price, monthly cash flow is $471 ($6k/yr) — positive.
- The deal already cash-flows at list — no discount required.
- Meets the 1% rule at list price ($2k rent vs $200k).
- Cap rate 9.1% vs local median 4.1% in Farmville — top-decile yield for the area; either an underpriced asset or a hidden risk that comps aren't pricing in. Stress-test before assuming the spread holds.
Location & tenants
- Location reads 66/100 on livability (#272 in NC) — a middle-class / working-renter tenant base. Strengths: cost of living A+, health & safety A+, housing A; Watch: amenities C-, employment C-, crime F.
- Pitt County Schools (rural): math 41% / reading 44% proficiency, ranked #100 of 178 in NC (top 56%) — families likely to look elsewhere, expect single-tenant / working-renter base with shorter leases.
- Zoned schools: Sam D Bundy Elementary (math 23% / reading 33%, grade F, #1,022 of 1,410 statewide, top 73%, 378 students, 99% FRL); Farmville Middle (math 31% / reading 35%, grade F, #305 of 475 statewide, top 65%, 611 students, 100% FRL); Farmville Central High (math 42% / reading 47%, grade F, #352 of 535 statewide, top 68%, 789 students, 99% FRL) — zoned schools average 99% FRL vs 56% district-wide (43 pts higher); higher-poverty schools than district average — tighter screening recommended.
- Market conditions: 87 active listings in the ZIP; 1 comparable units currently listed for rent nearby; 1,300 units permitted in Pitt County in 2024 (204 in 5+ unit buildings).
Forward outlook
- Local home prices are declining (-3.0%/yr); year-one equity from $1k of loan paydown is wiped out by about $6k of value loss. Plan a longer hold.
- Pitt County population projected at +22% by 2050 — long-run rental-demand tailwind backs the buy-and-hold thesis.
Negotiation context
- Only 13 days on market — expect competitive offers; lowballing is unlikely to land.
- Current owner paid $155k; 29% above their basis — modest negotiation headroom, anchor on the comps not their cost.
Risks & watch-outs
- Climate carrying-cost: severe wind risk, 80% chance of damaging wind over 30y; extreme-heat days projected 7→18/yr by 2055 (HVAC capex compounding) — expect insurance premiums to compound above CPI over the hold.
Questions for the listing agent
- Is there a deadline driving the sale (1031 exchange, divorce, estate, relocation)? That informs how much negotiation room exists.
- Schools are F-rated, which usually means shorter tenancies and higher turnover. Who's the typical renter profile here, and what's been the actual vacancy rate?
- Crime grade is F in this area — have there been break-ins, vandalism, or insurance claims at this property in the last 3 years? What carrier currently insures it and at what premium?
- What's the average days-on-market for RENTAL listings here right now (not sales)? A rising rental-DOM trend means longer vacancies and softer asking-rent achievability than the comps imply.
- What's the recent tenant-quality profile in this submarket — average credit score on applications, eviction rate, late-payment / NSF rate, and stable-employment percentage? A property-management company in the area should have these aggregated.
- How much new for-sale + rental construction is in the pipeline within 1–3 miles? Heavy new supply typically softens prices + rents 12–24 months out; constrained supply supports both.
Investment metrics
- 1% rule
- 1.12% ✓
- Cap rate
- 9.12%
- Cash-on-cash
- 10.09%
- DSCR
- 1.45
- GRM
- 7.4
CMA / ARV
- ARV (on-the-fly)
- $201,150
- Comps found
- 11
Show comp detail 11 sales within ~0.75 mi
| Address | Dist | Beds/Ba | Sqft | Sold | Price | $/sf | Match |
|---|---|---|---|---|---|---|---|
| 3351 North Barrett St | 0.16mi | 3/1.0 | 1,349 (-0%) | 14mo | $201,000 | $149 | 76 |
| 185 Lang Farm Rd | 0.42mi | 3/2.5 | 1,404 (+4%) | 3mo | $214,991 | $153 | 70 |
| 3346 Clubview Dr | 0.45mi | 3/2.0 | 1,350 (0%) | 14mo | $235,000 | $174 | 67 |
| 4146 East Pine St | 0.64mi | 3/2.0 | 1,430 (+6%) | 1mo | $140,000 | $98 | 60 |
| 3242 N Contentnea St | 0.57mi | 3/1.0 | 1,393 (+3%) | 8mo | $210,000 | $151 | 57 |
| 3400 Bynum Dr | 0.44mi | 3/2.5 | 1,444 (+7%) | 11mo | $238,000 | $165 | 57 |
| 3178 N Contentnea St | 0.68mi | 3/2.0 | 1,295 (-4%) | 14mo | $180,000 | $139 | 50 |
| 3354 Clubview Dr | 0.43mi | 2/2.0 (-1) | 1,515 (+12%) | 12mo | $250,000 | $165 | 45 |
| 4320 Wallace St | 0.54mi | 4/1.5 (+1) | 1,436 (+6%) | 16mo | $59,230 | $41 | 44 |
| 3222 North Contentnea St | 0.60mi | 4/2.0 (+1) | 1,520 (+13%) | 5mo | $127,500 | $84 | 42 |
| 4396 West Hines St | 0.60mi | 3/1.0 | 1,149 (-15%) | 3mo | $55,000 | $48 | 40 |
Match score weights: distance 35% · size 25% · config 20% · recency 20%. Top-matched comps best support the ARV.
Projected returns pro-forma
-3.0% appreciation · 3.0% rent growth · sell at horizon
- IRR
- -1.1%
- Equity multiple
- 0.96×
- Total profit
- $-2,424
- Equity at exit
- $29,821
- IRR
- 8.5%
- Equity multiple
- 1.65×
- Total profit
- $36,464
- Equity at exit
- $17,292
Cash invested: $56,000 (down + closing). Projections, not guarantees.
Landlord ↔ Tenant lean methodology
- Overall (STATE)
- 85 Strongly Landlord-Friendly
- State North Carolina
- 85 Strongly Landlord-Friendly · R+3
- County
- — inherits STATE
- City
- — inherits STATE
ZIP-level market 27828
- Home prices YoY
- -20.9%
- Active inventory
- 87
- Price-to-rent
- 7.4×
Monthly cashflow live
- Estimated rent
- $2,250 medium interval (Pro) →
- Mortgage (P&I)
- −$1,049
- Tax from tax record
- −$174 /mo · $2,092/yr
- Insurance
- −$83
- HOA
- −$0
- Vacancy / Maint / Mgmt
- −$472
- Net cashflow
- $471
Break-even live
Sensitivity live
| Price | -10% $584 | -5% $528 | +0% $471 | +5% $414 | +10% $358 |
|---|---|---|---|---|---|
| Rent | -10% $293 | -5% $382 | +0% $471 | +5% $560 | +10% $649 |
| Rate | -1.0pp $572 | -0.5pp $522 | base $471 | +0.5pp $419 | +1.0pp $366 |
UW: 25.0% down · 7.5% · 30yr · 1.5% tax · 5.0% vac · 8.0% maint · 8.0% mgmt
Financing live
Cash to close
- Down payment
- $50,000
- Closing costs
- $6,000
- Reserves months
- —
- Total cash needed
- —
Loan-product check · same deal, 3 products live
Conventional
25% down · 7.5% · 30yr
- Down + closing
- —
- Monthly P&I
- —
- Monthly cashflow
- —
- DSCR
- —
- Eligible?
- —
Personal DTI + credit; lowest rate.
DSCR
20% down · 8.5% · 30yr
- Down + closing
- —
- Monthly P&I
- —
- Monthly cashflow
- —
- DSCR
- —
- Eligible?
- —
No personal income docs; deal must DSCR.
Hard money
10% down · 12.0% · 12mo
- Down + closing
- —
- Monthly P&I
- —
- Monthly cashflow
- —
- DSCR
- —
- Eligible?
- —
Short-term bridge; refi at stabilization.
Rent comps 1 comps
| Address | Beds | Baths | Sqft | Rent | $/sqft | DOM | Units | Dist |
|---|---|---|---|---|---|---|---|---|
| 4022 East Horne Ave Farmville, NC | 3.0 | 2.0 | 1700 | $2,250 | $1.32 | 23d | 1 | 0.80mi |
Listing history 5 events
-
2026-04-22status Pending
-
2026-04-10$200,000 Active
-
2026-04-06historical $200,000
-
2022-05-12soldstatus $155,000
-
2006-08-01soldstatus $85,000
ⓘ Source: listings_history table (triggers on properties + properties_extension) + one-shot
backfill from property_details.listing_events for pre-trigger history.
Tax reassessment forecast NC · Resets to sale price
- Current annual tax
- $2,092 · $174/mo
- Projected year-2 tax
- $2,092 · $174/mo
- Expected delta
- $0/yr ($0/mo · 0.0%)
ⓘ Screening estimate from a state-policy table — verify with the county assessor before closing.
Climate risk First Street
- Flood 1/10 Low FEMA zone X (unshaded) · 0% chance over 30 yrs
- Wildfire 3/10 Moderate
- Heat 7/10 Severe 7 d/yr ≥107°F today · 18 d/yr by 30 yrs out
- Wind 8/10 Severe 80% chance of damaging wind over 30 yrs
- Air quality 3/10 Moderate 3 unhealthy d/yr today · 3 by 30 yrs out
Nearby sold comps map
Loading sold comps map…
Walkable amenities ~0.75 mi
Loading nearby amenities…
Taxation est. · year 1
- Rental income
- $27,000
- − Mortgage interest
- −$11,203
- − Property taxes
- −$2,092
- − Insurance
- −$1,000
- − Repairs & maintenance
- −$2,160
- − Management
- −$2,160
- − Depreciation
- −$5,818
- Taxable income
- $2,566
- Est. tax owed @ 24.0%
- −$616
- After-tax cash flow
- $5,036/yr
For passive investors: Depreciation is non-cash, so a rental often shows a tax loss while cash-flowing — sheltering income. Rental losses are passive: they offset passive income freely, and up to $25,000/yr can offset ordinary (W-2) income if you actively participate and your MAGI is under $100k (phasing out to $0 by $150k); unused losses carry forward. On sale, claimed depreciation is recaptured at up to 25%, and gains may owe capital-gains tax (a 1031 exchange can defer both). Figures are a year-1 estimate at your 24.0% rate — not tax advice; consult a CPA.
Schools (NCES district)
- District
- Pitt County Schools
- NCES district ID
- 3700012
- Math proficiency
- 41% ▬ 0.00%
- Reading proficiency
- 44% ▲ 2.00%
- Median HH income
- $40,631
- Composite
- 35.67/100
- National rank
- #4877
- State rank
- #100 of 178 in NC
Livability — Farmville
- Score
- 66/100
- State rank
- #272
- US rank
- #11852
Category grades
Schools grade is shown separately in the Schools card above.
Census & demographics
- Census place
- Farmville, NC
- Population (ZIP)
- 8,155
Population outlook (Pitt County) Hauer SSP2
- Today (2025)
- 194,585 people
- By 2030
- 203,756 · +4.7%
- By 2040
- 220,807 · +13.5%
- By 2050
- 236,614 · +21.6%
- By 2075
- 275,940 · +41.8%
- By 2100
- 300,058 · +54.2%
Race, ethnicity, and origin ACS 2023
- Neighborhood character
- Diverse neighborhood (Simpson 0.60)
- Race & ethnicity
- White 50% Black 37% Two or more races 6% Hispanic / Latino 6%
- Hispanic origin (detail)
- Mexican 3% Puerto Rican 3%
- Common ancestry
- Subsaharan African 2% Slovak 1% Italian 1%
- Foreign-born
- 3% · Canada
- Languages at home
- 95% English-only · Spanish 3% Russian/Polish/Slavic 1%
Political lean MEDSL · Pitt
- 2024 margin
- Lean D (+6.0) · D 52.5% · R 46.5% · Other 1.1%
- 2008→2024 swing
- -2.8pp toward R · 2008: 8.8pp · 2024: 6.0pp
- All cycles
- 2024: D+6.0 2020: D+9.4 2016: D+7.4 2012: D+6.7 2008: D+8.8
Not yet ingested
- Civics
- —
Market trends
- HPI YoY
- ▼ -51.30%
- Current HPI
- 193.5248
- Rent YoY
- —
- Metro
- —
- State GDP YoY
- ▲ 3.28%
- F500 in state
- 26
Industry mix (Fortune 500 HQ in NC)
| Industry | F500 HQs | Revenue |
|---|---|---|
| Financial Services | 2 | $213B |
|
||
| Retail | 2 | $95B |
|
||
| Industrial Conglomerate | 1 | $38B |
|
||
| Metals / Steel | 1 | $35B |
|
||
| Utilities | 1 | $30B |
|
||
| Industrial Machinery | 1 | $19B |
|
||
Price history
+135.3% since first listed5 events — show timeline
- 2026-04-22 Pending — LPRMLS
- 2026-04-10 Listed $200,000 LPRMLS
- 2026-04-06 Coming Soon $200,000 LPRMLS
- 2022-05-12 Sold (Public Records) $155,000 Public Records
- 2006-08-01 Sold (Public Records) $85,000 Public Records
Property tax history
+13.1%/yrLatest (2025): $2,092 · +0.6% YoY. Source: county tax records.
Cash-flow waterfall
monthlySold comps — $/sqft
last 12 mo · ≤1 miLoading sold comps…