201 Lake Frances Dr · West Palm Beach, FL
Flood risk No data
- FEMA flood zone
- —
- Chance of flooding over 30 yrs
- %
- Est. flood insurance / yr
- —
Fire risk No data
- Est. fire insurance / yr
- —
Heat risk No data
- Hot days now (above °F)
- days/yr
- Hot days in 30 yrs
- days/yr
Wind risk No data
- Chance of severe wind over 30 yrs
- %
Air-quality risk No data
- Unhealthy air days now
- days/yr
- Unhealthy air days in 30 yrs
- days/yr
Risk factors via First Street. Map © Google.
Why this score? — see what drove the C- grade
The composite is a weighted blend of 9 inputs, each scored 0–100. Each bar is that input's sub-score; the figure is the points it added to the 100-point composite (weight × sub-score).
- Cash flow +11.1/30.0
- Appreciation +10.0/10.0
- 1% rule +8.0/10.0
- ARV discount +7.5/15.0
- Schools +4.3/10.0
- Livability +4.1/5.0
- DSCR +3.2/10.0
- Rent growth +2.7/5.0
- Condition / age +2.5/5.0
$123,000
🖨 Deal sheet 📄 Offer letter ✓ Due diligence
Listing remarks
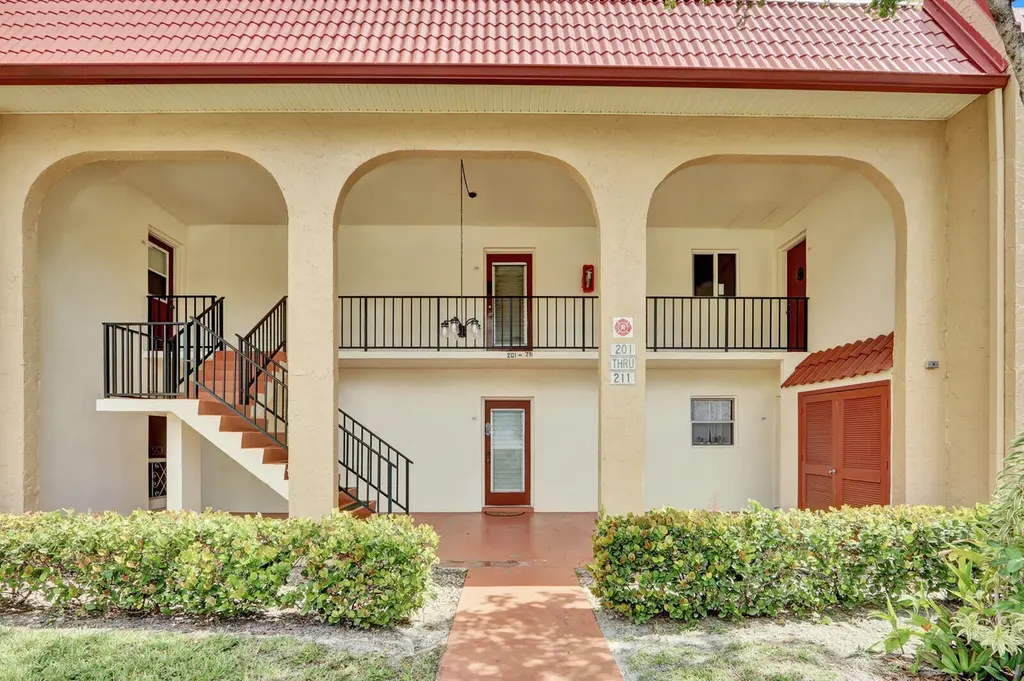
Welcome to this very nice one-bedroom, one-and-a-half-bath condominium located in Golden Lakes Village in West Palm Beach. This first-story unit provides comfortable accommodations with a view of the lake and features tile floors throughout, as well as a new water heater and range. The thoughtful layout maximizes the utility of each room, while the waterfront location adds a distinctive appeal to the property. Situated within the established Golden Lakes Village community, this condo presents an excellent opportunity to reside in an adult community with great amenities and activities. Golden Lakes is conveniently situated near fine dining, shopping, cultural centers, local beaches, and the
Key facts
- $461 HOA
- Parking
- Community pool
Neighborhood map
What this means for you Summary
Snapshot
- This is a 1-bed/1.5-bath townhouse listed at $123k.
Deal economics
- At list price, monthly cash flow is $-50 ($-600/yr) — negative.
- To cash-flow at today's rent, offer at most $116k (5.9% below list).
- Meets the 1% rule at list price ($2k rent vs $123k).
- Recommended offer: $116k (5.9% below list) — sets the bar for cash-flow.
- Cap rate 5.8% vs local median 3.8% in West Palm Beach — top-decile yield for the area; either an underpriced asset or a hidden risk that comps aren't pricing in. Stress-test before assuming the spread holds.
Location & tenants
- Location reads 82/100 on livability (#75 in FL, #1,255 nationally) — a professional / high-income tenant draw. Strengths: commute A+, housing A+, health & safety A+; Watch: employment C-, crime F.
- Palm Beach (suburban): math 46% / reading 53% proficiency, ranked #34 of 73 in FL (top 47%) — families likely to look elsewhere, expect single-tenant / working-renter base with shorter leases.
- Market conditions: Rents flat; 574 active listings in the ZIP; 20 comparable units currently listed for rent nearby; rentals at typical pace (median 24d on market — plan ~3-4 weeks tenant-placement turnaround); solid renter incomes; 3,974 units permitted in Palm Beach County in 2024 (1,012 in 5+ unit buildings).
Forward outlook
- In year one you build about $13k of equity ($850 loan paydown + $12k appreciation (10.0% local appreciation)).
- Palm Beach County population projected at +30% by 2050 — long-run rental-demand tailwind backs the buy-and-hold thesis.
- At projected returns (10.0% appreciation + 0.8% rent growth), your $34k cash investment doubles in ~3 years — after that, you're playing with house money.
- By year 3, paydown + projected appreciation supports a ~$33k cash-out refi (75% LTV) — recoverable capital for the next deal without selling this one.
Negotiation context
- Only 5 days on market — expect competitive offers; lowballing is unlikely to land.
Risks & watch-outs
- Watch-outs: HOA is 29% of rent.
Questions for the listing agent
- What do current leases actually rent for vs. the listed asking? Can we see a recent rent roll and the last 12 months of T-12 income?
- Built in 1978 — when were the roof, HVAC, electrical panel, plumbing, and water heater last replaced?
- What does the HOA fee cover, when was the last increase, and are there any pending special assessments or reserve-fund shortfalls?
- Is there a deadline driving the sale (1031 exchange, divorce, estate, relocation)? That informs how much negotiation room exists.
- Crime grade is F in this area — have there been break-ins, vandalism, or insurance claims at this property in the last 3 years? What carrier currently insures it and at what premium?
- What's the average days-on-market for RENTAL listings here right now (not sales)? A rising rental-DOM trend means longer vacancies and softer asking-rent achievability than the comps imply.
- What's the recent tenant-quality profile in this submarket — average credit score on applications, eviction rate, late-payment / NSF rate, and stable-employment percentage? A property-management company in the area should have these aggregated.
- How much new for-sale + rental construction is in the pipeline within 1–3 miles? Heavy new supply typically softens prices + rents 12–24 months out; constrained supply supports both.
Investment metrics
- 1% rule
- 1.30% ✓
- Cap rate
- 5.81%
- Cash-on-cash
- -1.74%
- DSCR
- 0.92
- GRM
- 6.4
CMA / ARV
No comps found within radius.
Projected returns pro-forma
10.0% appreciation · 0.85% rent growth · sell at horizon
- IRR
- 22.1%
- Equity multiple
- 2.76×
- Total profit
- $60,733
- Equity at exit
- $110,808
- IRR
- 19.2%
- Equity multiple
- 6.10×
- Total profit
- $175,687
- Equity at exit
- $238,962
Cash invested: $34,440 (down + closing). Projections, not guarantees.
Landlord ↔ Tenant lean methodology
- Overall (STATE)
- 87 Strongly Landlord-Friendly
- State Florida
- 87 Strongly Landlord-Friendly · R+3
- County
- — inherits STATE
- City
- — inherits STATE
ZIP-level market 33411
- Home prices YoY
- 1.9%
- Rents YoY
- 0.8%
- Active inventory
- 574
- Price-to-rent
- 6.4×
Monthly cashflow live
- Estimated rent
- $1,596 high interval (Pro) →
- Mortgage (P&I)
- −$645
- Tax est. 1.5%
- −$154 /mo · $1,845/yr
- Insurance
- −$51
- HOA
- −$461
- Vacancy / Maint / Mgmt
- −$335
- Net cashflow
- $-50
Break-even live
UW: 25.0% down · 7.5% · 30yr · 1.5% tax · 5.0% vac · 8.0% maint · 8.0% mgmt
Financing live
Cash to close
- Down payment
- $30,750
- Closing costs
- $3,690
- Reserves months
- —
- Total cash needed
- —
Loan-product check · same deal, 3 products live
Conventional
25% down · 7.5% · 30yr
- Down + closing
- —
- Monthly P&I
- —
- Monthly cashflow
- —
- DSCR
- —
- Eligible?
- —
Personal DTI + credit; lowest rate.
DSCR
20% down · 8.5% · 30yr
- Down + closing
- —
- Monthly P&I
- —
- Monthly cashflow
- —
- DSCR
- —
- Eligible?
- —
No personal income docs; deal must DSCR.
Hard money
10% down · 12.0% · 12mo
- Down + closing
- —
- Monthly P&I
- —
- Monthly cashflow
- —
- DSCR
- —
- Eligible?
- —
Short-term bridge; refi at stabilization.
Rent comps 20 comps
| Address | Beds | Baths | Sqft | Rent | $/sqft | DOM | Units | Dist |
|---|---|---|---|---|---|---|---|---|
| 161 Lake Frances Dr Unit 161 West Palm Beach, FL | 1.0 | 1.5 | 704 | $1,430 | $2.03 | 7d | 1 | 0.07mi |
| 175 Lake Carol Dr #175 West Palm Beach, FL | 1.0 | 1.0 | 600 | $1,300 | $2.17 | 24d | 1 | 0.38mi |
| 129 Lake Carol Dr #129 West Palm Beach, FL | 1.0 | 1.0 | 600 | $1,500 | $2.50 | 24d | 1 | 0.38mi |
| 228 Lake Dora Dr West Palm Beach, FL | 1.0 | 1.5 | 704 | $1,500 | $2.13 | 24d | 1 | 0.38mi |
| 173 Lake Dora Dr #173 West Palm Beach, FL | 1.0 | 1.5 | 704 | $1,400 | $1.99 | 24d | 1 | 0.38mi |
| 228 Lake Dora Dr West Palm Beach, FL | 1.0 | 1.5 | 704 | $1,500 | $2.13 | 22d | 1 | 0.38mi |
| 203 Lake Carol Dr West Palm Beach, FL | 1.0 | 1.0 | 600 | $1,500 | $2.50 | 24d | 1 | 0.38mi |
| 1545 Lake Crystal Dr Unit D West Palm Beach, FL | 1.0 | 1.0 | 700 | $1,675 | $2.39 | 13d | 1 | 0.39mi |
| 1153 Lake Victoria Dr Royal Palm Beach, FL | 2.0 | 1.0 | 708 | $1,725 | $2.44 | 24d | 1 | 0.57mi |
| 1215 N Benoist Farms Rd #203 West Palm Beach, FL | 2.0 | 1.0 | 708 | $1,750 | $2.47 | 24d | 1 | 0.67mi |
| 1990 Augustine Rd West Palm Beach, FL | 1.0–2.0 | 1.0–2.0 | 1019 | $2,051 | $2.01 | 2d | 14 | 0.68mi |
| 1203 N Benoist Farms Rd #107 West Palm Beach, FL | 1.0 | 1.0 | 530 | $1,480 | $2.79 | 18d | 1 | 0.69mi |
| 1203 N Benoist Farms Rd #107 West Palm Beach, FL | 1.0 | 1.0 | 530 | $1,480 | $2.79 | 24d | 1 | 0.69mi |
| 1101 N Benoist Farms Rd #106 West Palm Beach, FL | 2.0 | 1.0 | 708 | $1,700 | $2.40 | 24d | 1 | 0.79mi |
| 1080 N Benoist Farms Rd #204 West Palm Beach, FL | 2.0 | 1.0 | 708 | $1,500 | $2.12 | 16d | 1 | 0.81mi |
| 1089 N Benoist Farms Rd #301 West Palm Beach, FL | 1.0 | 1.0 | 540 | $1,550 | $2.87 | 20d | 1 | 0.84mi |
| 1068 N Benoist Farms Rd #205 West Palm Beach, FL | 2.0 | 1.0 | 708 | $1,800 | $2.54 | 24d | 1 | 0.85mi |
| 7080 Banyan Leaf Rd West Palm Beach, FL | 1.0–2.0 | 1.0–2.0 | 742 | $1,862 | $2.51 | 1d | 14 | 0.95mi |
| 6559 Emerald Dunes Dr Royal Palm Beach, FL | 1.0–3.0 | 1.0–2.0 | 1060 | $1,925 | $1.82 | 24d | 2 | 1.37mi |
| 6482 Emerald Dunes Dr Unit 215 Royal Palm Beach, FL | 1.0 | 1.0 | 745 | $1,700 | $2.28 | 24d | 1 | 1.38mi |
HOA detail
- Monthly dues
- $461 · $5,532/yr
- Likely covers
- water
Listing history 3 events
-
2026-06-18days on market $123,000 Active 5 DOM
-
2026-06-17remarks 699-char remark
-
2026-06-17$123,000 Active 4 DOM
ⓘ Source: listings_history table (triggers on properties + properties_extension) + one-shot
backfill from property_details.listing_events for pre-trigger history.
Nearby sold comps map
Loading sold comps map…
Walkable amenities ~0.75 mi
Loading nearby amenities…
Taxation est. · year 1
- Rental income
- $19,155
- − Mortgage interest
- −$6,890
- − Property taxes
- −$1,845
- − Insurance
- −$615
- − Repairs & maintenance
- −$1,532
- − Management
- −$1,532
- − HOA
- −$5,532
- − Depreciation
- −$3,578
- Taxable loss
- −$2,370
- Est. tax savings @ 24.0%
- +$569
- After-tax cash flow
- $-31/yr
For passive investors: Depreciation is non-cash, so a rental often shows a tax loss while cash-flowing — sheltering income. Rental losses are passive: they offset passive income freely, and up to $25,000/yr can offset ordinary (W-2) income if you actively participate and your MAGI is under $100k (phasing out to $0 by $150k); unused losses carry forward. On sale, claimed depreciation is recaptured at up to 25%, and gains may owe capital-gains tax (a 1031 exchange can defer both). Figures are a year-1 estimate at your 24.0% rate — not tax advice; consult a CPA.
Schools (NCES district)
- District
- Palm Beach
- NCES district ID
- 1201500
- Math proficiency
- 46% ▼ -16.00%
- Reading proficiency
- 53% ▼ -4.00%
- Median HH income
- $53,943
- Composite
- 42.72/100
- National rank
- #3160
- State rank
- #34 of 73 in FL
Livability — West Palm Beach
- Score
- 82/100
- State rank
- #75
- US rank
- #1255
Category grades
Schools grade is shown separately in the Schools card above.
Census & demographics
- County
- Palm Beach County · 1,438,312 people
- City population
- 222,012
- Metro
- Miami-Fort Lauderdale-Pompano Beach, FL
- Population (ZIP)
- 76,863
- Household income
- $92,591
- Rent vs Own
- Severe rent burden
- 1870.0
Population outlook (Palm Beach County) Hauer SSP2
- Today (2025)
- 1,637,487 people
- By 2030
- 1,743,255 · +6.5%
- By 2040
- 1,948,712 · +19.0%
- By 2050
- 2,132,979 · +30.3%
- By 2075
- 2,530,027 · +54.5%
- By 2100
- 2,706,979 · +65.3%
Race, ethnicity, and origin ACS 2023
- Neighborhood character
- Diverse neighborhood (Simpson 0.70)
- Race & ethnicity
- White 44% Hispanic / Latino 24% Black 23% Two or more races 16% Asian 5%
- Hispanic origin (detail)
- Mexican 2% Puerto Rican 5% Cuban 4% Dominican 2%
- Common ancestry
- Hispanic 6% Romanian 2% Italian 1%
- Foreign-born
- 26% · Canada, Jamaica, China
- Languages at home
- 73% English-only · Spanish 17% French/Haitian/Cajun 4% Other Indo-European 2%
Political lean MEDSL · Palm Beach
- 2024 margin
- Toss-up / Even · D 50.0% · R 49.2%
- 2008→2024 swing
- -22.1pp toward R · 2008: 22.9pp · 2024: 0.8pp
- All cycles
- 2024: D+0.8 2020: D+12.8 2016: D+15.3 2012: D+17.0 2008: D+22.9
Not yet ingested
- Civics
- —
Market trends
- HPI YoY
- ▲ 17.04%
- Current HPI
- 903.78
- Rent YoY
- ▲ 0.85%
- Metro
- Miami-Fort Lauderdale-Pompano Beach, FL
- State GDP YoY
- ▲ 3.28%
- F500 in state
- 36
Industry mix (Fortune 500 HQ in FL)
| Industry | F500 HQs | Revenue |
|---|---|---|
| Industrial Technology | 2 | $29B |
|
||
| Insurance | 2 | $17B |
|
||
| Retail | 1 | $60B |
|
||
| Technology Distribution | 1 | $58B |
|
||
| Homebuilding | 1 | $35B |
|
||
| Technology Manufacturing | 1 | $35B |
|
||
Cash-flow waterfall
monthlySold comps — $/sqft
last 12 mo · ≤1 miLoading sold comps…