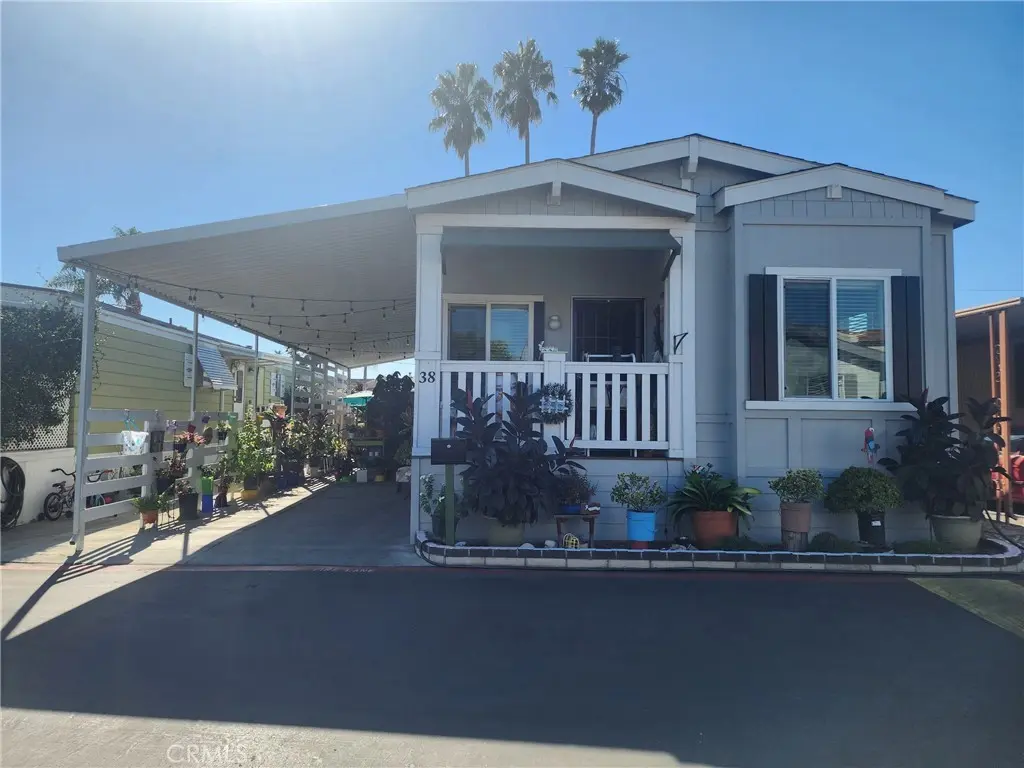
22600 NORMANDIE Ave #38 · West Carson, CA
Flood risk 3/10 · Minor
- FEMA flood zone
- X (unshaded)
- Chance of flooding over 30 yrs
- 0.16%
- Est. flood insurance / yr
- $507 – $1,088
Fire risk 1/10 · Minimal
- Est. fire insurance / yr
- $659 – $1,223
Heat risk 4/10 · Minor
- Hot days now (above 87°F)
- 7 days/yr
- Hot days in 30 yrs
- 22 days/yr
Wind risk 1/10 · Minimal
- Chance of severe wind over 30 yrs
- —
Air-quality risk 5/10 · Moderate
- Unhealthy air days now
- 7 days/yr
- Unhealthy air days in 30 yrs
- 7 days/yr
Risk factors via First Street. Map © Google.
Why this score? — see what drove the B- grade
The composite is a weighted blend of 9 inputs, each scored 0–100. Each bar is that input's sub-score; the figure is the points it added to the 100-point composite (weight × sub-score).
- Cash flow +30.0/30.0
- DSCR +10.0/10.0
- 1% rule +8.5/10.0
- ARV discount +7.5/15.0
- Condition / age +3.8/5.0
- Schools +3.6/10.0
- Livability +3.2/5.0
- Rent growth +2.5/5.0
- Appreciation +0.0/10.0
$250,000
🖨 Deal sheet 📄 Offer letter ✓ Due diligence
Listing remarks MLS
Welcome to this beautifully maintained 3-bedroom, 2-bath manufactured home built in 2020, located in the desirable city of Torrance. This home features a modern design with a spacious and functional layout, perfect for comfortable living. Step inside to an inviting open floor plan that seamlessly connects the living, dining, and kitchen areas. The bright and airy living space provides an ideal setting for both everyday living and entertaining. The modern kitchen offers sleek appliances, generous counter space, and stylish cabinetry, making meal preparation both convenient and enjoyable. The home includes three well-sized bedrooms, including a primary suite with its own private bathroom. Additional highlights include modern finishes, abundant natural light, and a thoughtfully designed interior layout. Situated within a well-maintained community in Torrance, this home offers convenient access to shopping, dining, schools, and major transportation routes. Seller may consider concessions toward space rent for a limited period with acceptable offer.
Key facts
- Community pool
- Built 2020
- Listed 140 days
Neighborhood map
What this means for you Summary
Snapshot
- This is a 3-bed/2.0-bath manufactured listed at $250k. Condition is rated good.
Deal economics
- At list price, monthly cash flow is $1k ($13k/yr) — positive.
- The deal already cash-flows at list — no discount required.
- Meets the 1% rule at list price ($3k rent vs $250k).
- Recommended offer: $220k (12.0% below list) — sets the bar for market timing.
- Cap rate 11.6% vs local median 2.8% in West Carson — top-decile yield for the area; either an underpriced asset or a hidden risk that comps aren't pricing in. Stress-test before assuming the spread holds.
Location & tenants
- Location reads 64/100 on livability (#408 in CA) — a middle-class / working-renter tenant base. Strengths: commute A+, employment A+; Watch: crime D+, amenities F, cost of living F.
- Los Angeles Unified (urban): math 29% / reading 54% proficiency, ranked #223 of 517 in CA (top 43%) — families likely to look elsewhere, expect single-tenant / working-renter base with shorter leases; 67% free/reduced lunch — lower-income household profile, screen leases tightly.
- Market conditions: 56 active listings in the ZIP; 40 comparable units currently listed for rent nearby; rentals at typical pace (median 24d on market — plan ~3-4 weeks tenant-placement turnaround); 40% of comp listings sitting > 30 days — soft ceiling on asking rent; solid renter incomes; 19,697 units permitted in Los Angeles County in 2024 (9,426 in 5+ unit buildings).
- This rent runs 43% of the median local income ($94k/yr) — at the standard rent-burdened threshold; future hikes will face affordability resistance.
Forward outlook
- Local home prices are declining (-3.0%/yr); year-one equity from $2k of loan paydown is wiped out by about $8k of value loss. Plan a longer hold.
- Los Angeles County population projected at +9% by 2050 — modest demand growth; plan on rents tracking national, not racing it.
- At projected returns (-3.0% appreciation + 3.0% rent growth), your $70k cash investment doubles in ~7 years — after that, you're playing with house money.
Negotiation context
- It's been on market 141 days — a 12% lower offer ($220k) is reasonable based on typical stale-listing flexibility.
- 4 sale attempts since 2y ago; this cycle's ask has dropped $30k (11%) from the opening price — seller is motivated, your offer sets the floor, not the list.
Questions for the listing agent
- It's been on market 141 days. Have you received any prior offers? Is the seller open to a 12% concession, seller financing, or rate buy-down credit?
- Why hasn't it sold? Are there any deal-killer items the seller is aware of (foundation, flood, title, zoning, code violations)?
- Is there a deadline driving the sale (1031 exchange, divorce, estate, relocation)? That informs how much negotiation room exists.
- Crime grade is D in this area — have there been break-ins, vandalism, or insurance claims at this property in the last 3 years? What carrier currently insures it and at what premium?
- What's the average days-on-market for RENTAL listings here right now (not sales)? A rising rental-DOM trend means longer vacancies and softer asking-rent achievability than the comps imply.
- What's the recent tenant-quality profile in this submarket — average credit score on applications, eviction rate, late-payment / NSF rate, and stable-employment percentage? A property-management company in the area should have these aggregated.
- How much new for-sale + rental construction is in the pipeline within 1–3 miles? Heavy new supply typically softens prices + rents 12–24 months out; constrained supply supports both.
Investment metrics
- 1% rule
- 1.35% ✓
- Cap rate
- 11.62%
- Cash-on-cash
- 19.03%
- DSCR
- 1.85
- GRM
- 6.2
CMA / ARV
- ARV (median comp)
- $153,383
- List price
- $250,000
- Delta
- 62.99%
- Verdict
- OVERPRICED
- Comps
- 6 within 1.0 mi
Show comp detail 2 sales within ~0.75 mi
| Address | Dist | Beds/Ba | Sqft | Sold | Price | $/sf | Match |
|---|---|---|---|---|---|---|---|
| 22600 Normandie Ave #50 | 0.14mi | 2/2.0 (-1) | 1,120 (0%) | 1mo | $243,000 | $217 | 88 |
| 22516 Normandie Ave Unit 27A | 0.06mi | 2/2.0 (-1) | 1,000 (-11%) | 11mo | $145,000 | $145 | 65 |
Match score weights: distance 35% · size 25% · config 20% · recency 20%. Top-matched comps best support the ARV.
Projected returns pro-forma
-3.0% appreciation · 3.0% rent growth · sell at horizon
- IRR
- 10.9%
- Equity multiple
- 1.43×
- Total profit
- $30,123
- Equity at exit
- $37,276
- IRR
- 19.9%
- Equity multiple
- 2.67×
- Total profit
- $117,035
- Equity at exit
- $21,615
Cash invested: $70,000 (down + closing). Projections, not guarantees.
Landlord ↔ Tenant lean methodology
- Overall (STATE)
- 18 Strongly Tenant-Friendly
- State California
- 18 Strongly Tenant-Friendly · D+13
- County
- — inherits STATE
- City
- — inherits STATE
ZIP-level market 90502
- Active inventory
- 56
- Price-to-rent
- 6.2×
Monthly cashflow live
- Estimated rent
- $3,377 high interval (Pro) →
- Mortgage (P&I)
- −$1,311
- Tax from tax record
- −$143 /mo · $1,713/yr
- Insurance
- −$104
- HOA
- −$0
- Vacancy / Maint / Mgmt
- −$709
- Net cashflow
- $1,110
Break-even live
UW: 25.0% down · 7.5% · 30yr · 1.5% tax · 5.0% vac · 8.0% maint · 8.0% mgmt
Financing live
Cash to close
- Down payment
- $62,500
- Closing costs
- $7,500
- Reserves months
- —
- Total cash needed
- —
Loan-product check · same deal, 3 products live
Conventional
25% down · 7.5% · 30yr
- Down + closing
- —
- Monthly P&I
- —
- Monthly cashflow
- —
- DSCR
- —
- Eligible?
- —
Personal DTI + credit; lowest rate.
DSCR
20% down · 8.5% · 30yr
- Down + closing
- —
- Monthly P&I
- —
- Monthly cashflow
- —
- DSCR
- —
- Eligible?
- —
No personal income docs; deal must DSCR.
Hard money
10% down · 12.0% · 12mo
- Down + closing
- —
- Monthly P&I
- —
- Monthly cashflow
- —
- DSCR
- —
- Eligible?
- —
Short-term bridge; refi at stabilization.
Rent comps 40 comps
| Address | Beds | Baths | Sqft | Rent | $/sqft | DOM | Units | Dist |
|---|---|---|---|---|---|---|---|---|
| 1332 W 225th St Unit 1 Torrance, CA | 2.0 | 1.0 | 900 | $2,095 | $2.33 | 43d | 1 | 0.17mi |
| 22919 Mariposa Ave Torrance, CA | 2.0–3.0 | 2.5–4.0 | 1480 | $4,000 | $2.70 | 43d | 2 | 0.21mi |
| 1311 Sepulveda Blvd Torrance, CA | 2.0 | 2.0 | 1050 | $3,650 | $3.48 | 20d | 1 | 0.39mi |
| 1533 Plaza del Amo Unit 4 Torrance, CA | 2.0 | 1.0 | 978 | $2,650 | $2.71 | 3d | 1 | 0.41mi |
| 1570 W 226th St Torrance, CA | 3.0 | 2.0 | 1200 | $3,750 | $3.12 | 21d | 1 | 0.47mi |
| 1567 W 228th St Torrance, CA | 2.0 | 2.0 | 990 | $3,200 | $3.23 | 43d | 1 | 0.48mi |
| 22423 Harvard Blvd Torrance, CA | 3.0 | 1.0 | 1150 | $3,750 | $3.26 | 4d | 1 | 0.51mi |
| 1612 226th St Unit B Torrance, CA | 2.0 | 1.0 | 850 | $2,650 | $3.12 | 43d | 1 | 0.51mi |
| 22317 Harbor Ridge Ln Torrance, CA | 3.0 | 1.5 | 1472 | $3,250 | $2.21 | 3d | 1 | 0.56mi |
| 817 W 232nd St Unit G Torrance, CA | 2.0 | 1.5 | 900 | $3,250 | $3.61 | 18d | 1 | 0.62mi |
| 22633 Figueroa St Carson, CA | 2.0 | 1.0 | 816 | $3,000 | $3.68 | 24d | 1 | 0.67mi |
| 22619 Figueroa St Carson, CA | 2.0 | 2.0 | 800 | $3,300 | $4.12 | 43d | 1 | 0.67mi |
| 1442 W Carson St Unit 1430-4 Torrance, CA | 2.0 | 1.0 | 800 | $2,295 | $2.87 | 24d | 1 | 0.76mi |
| 23318 Sesame St Unit H Torrance, CA | 2.0 | 2.0 | 852 | $2,595 | $3.05 | 21d | 1 | 0.80mi |
| 1565 W 218th St Torrance, CA | 2.0 | 1.0 | 728 | $2,700 | $3.71 | 43d | 1 | 0.80mi |
| 806 Coriander Dr Unit H Torrance, CA | 2.0 | 2.0 | 829 | $2,500 | $3.02 | 24d | 1 | 0.80mi |
| 21612 Berendo Ave Torrance, CA | 2.0 | 1.0 | 754 | $2,495 | $3.31 | 43d | 1 | 0.81mi |
| 800 W Carson St Torrance, CA | 2.0–3.0 | 1.0–2.0 | 887 | $2,266 | $2.55 | 1d | 5 | 0.87mi |
| 2308 Cabrillo Ave Apt 8 Torrance, CA | 2.0 | 2.0 | 950 | $2,200 | $2.32 | 7d | 1 | 0.96mi |
| 21329 Jaffrey Ave Torrance, CA | 3.0 | 2.0 | 1233 | $4,300 | $3.49 | 3d | 1 | 0.97mi |
| 21329 Jaffrey Ave Torrance, CA | 3.0 | 2.0 | 1233 | $4,300 | $3.49 | 43d | 1 | 0.97mi |
| 21329 Jaffrey Ave Torrance, CA | 3.0 | 2.0 | 1233 | $4,300 | $3.49 | 1d | 1 | 0.97mi |
| 2023 Border Ave Torrance, CA | 3.0 | 2.0 | 1224 | $4,500 | $3.68 | 18d | 1 | 0.99mi |
| 1642 W 215th St Torrance, CA | 3.0 | 1.0 | 1008 | $3,300 | $3.27 | 24d | 1 | 1.03mi |
| 317 W 220th St Unit 112A Carson, CA | 2.0 | 1.5 | 800 | $2,395 | $2.99 | 43d | 1 | 1.03mi |
| 1614 W 214th St Torrance, CA | 4.0 | 3.0 | 1415 | $4,400 | $3.11 | 1d | 1 | 1.06mi |
| 24223 Ambassador Pl Harbor City, CA | 3.0 | 2.0 | 1208 | $3,800 | $3.15 | 5d | 1 | 1.08mi |
| 1903 Cabrillo Ave Unit C Torrance, CA | 2.0 | 1.0 | 700 | $2,700 | $3.86 | 43d | 1 | 1.10mi |
| 21323 Conradi Ave Torrance, CA | 2.0 | 2.0 | 981 | $3,500 | $3.57 | 43d | 1 | 1.10mi |
| 1541 W 213th St Torrance, CA | 2.0 | 2.0 | 1000 | $2,900 | $2.90 | 43d | 1 | 1.10mi |
| 1541 W 213th St Unit 1/2 Torrance, CA | 3.0 | 2.0 | 1200 | $3,400 | $2.83 | 43d | 1 | 1.10mi |
| 1833 Cabrillo Ave Torrance, CA | 2.0 | 2.5 | 1200 | $3,650 | $3.04 | 43d | 1 | 1.10mi |
| 2757 Andreo Ave Torrance, CA | 2.0 | 2.0 | 1100 | $3,295 | $3.00 | 43d | 1 | 1.11mi |
| 2757 Andreo Ave Unit 6 Torrance, CA | 2.0 | 2.0 | 1100 | $2,933 | $2.67 | 2d | 1 | 1.11mi |
| 2757 Andreo Ave Unit 3 Torrance, CA | 2.0 | 1.5 | 1100 | $2,933 | $2.67 | 3d | 1 | 1.11mi |
| 2757 Andreo Ave Unit 3 Torrance, CA | 2.0 | 2.0 | 1100 | $2,933 | $2.67 | 11d | 1 | 1.11mi |
| 2757 Andreo Ave Unit 5 Torrance, CA | 2.0 | 1.5 | 1100 | $2,993 | $2.72 | 11d | 1 | 1.11mi |
| 2757 Andreo Ave Unit 5 Torrance, CA | 2.0 | 2.0 | 1100 | $2,933 | $2.67 | 21d | 1 | 1.11mi |
| 1751 Cabrillo Ave Unit K Torrance, CA | 3.0 | 2.0 | 1150 | $3,295 | $2.87 | 12d | 1 | 1.15mi |
| 21116 Denker Ave Torrance, CA | 4.0 | 2.0 | 1464 | $4,450 | $3.04 | 43d | 1 | 1.20mi |
Listing history 21 events
-
2026-06-18days on market $250,000 Active 141 DOM
-
2026-06-17days on market $250,000 Active 140 DOM
-
2026-06-16days on market $250,000 Active 139 DOM
-
2026-06-15days on market $250,000 Active 138 DOM
-
2026-06-13days on market $250,000 Active 136 DOM
-
2026-06-09days on market $250,000 Active 132 DOM
-
2026-06-08days on market $250,000 Active 131 DOM
-
2026-06-07days on market $250,000 Active 130 DOM
-
2026-06-04days on market $250,000 Active 127 DOM
-
2026-06-03days on market $250,000 Active 126 DOM
-
2026-06-02days on market $250,000 Active 125 DOM
-
2026-06-01days on market $250,000 Active 124 DOM
-
2026-05-31days on market $250,000 Active 123 DOM
-
2026-03-27price $250,000 1060-char remark
Show marketing remark (1060 chars)
Welcome to this beautifully maintained 3-bedroom, 2-bath manufactured home built in 2020, located in the desirable city of Torrance. This home features a modern design with a spacious and functional layout, perfect for comfortable living. Step inside to an inviting open floor plan that seamlessly connects the living, dining, and kitchen areas. The bright and airy living space provides an ideal setting for both everyday living and entertaining. The modern kitchen offers sleek appliances, generous counter space, and stylish cabinetry, making meal preparation both convenient and enjoyable. The home includes three well-sized bedrooms, including a primary suite with its own private bathroom. Additional highlights include modern finishes, abundant natural light, and a thoughtfully designed interior layout. Situated within a well-maintained community in Torrance, this home offers convenient access to shopping, dining, schools, and major transportation routes. Seller may consider concessions toward space rent for a limited period with acceptable offer.
-
2026-01-28$280,000 Active 1060-char remark
Show marketing remark (1060 chars)
Welcome to this beautifully maintained 3-bedroom, 2-bath manufactured home built in 2020, located in the desirable city of Torrance. This home features a modern design with a spacious and functional layout, perfect for comfortable living. Step inside to an inviting open floor plan that seamlessly connects the living, dining, and kitchen areas. The bright and airy living space provides an ideal setting for both everyday living and entertaining. The modern kitchen offers sleek appliances, generous counter space, and stylish cabinetry, making meal preparation both convenient and enjoyable. The home includes three well-sized bedrooms, including a primary suite with its own private bathroom. Additional highlights include modern finishes, abundant natural light, and a thoughtfully designed interior layout. Situated within a well-maintained community in Torrance, this home offers convenient access to shopping, dining, schools, and major transportation routes. Seller may consider concessions toward space rent for a limited period with acceptable offer.
-
2025-09-30historical
-
2025-06-09price $280,000
-
2025-05-25status Active
-
2024-12-20status Active
-
2024-12-20price $300,000
-
2024-10-22$280,000 Active
ⓘ Source: listings_history table (triggers on properties + properties_extension) + one-shot
backfill from property_details.listing_events for pre-trigger history.
Tax reassessment forecast CA · Resets to sale price
- Current annual tax
- $1,713 · $143/mo
- Projected year-2 tax
- $1,900 · $158/mo
- Expected delta
- +$187/yr (+$16/mo · 10.9%)
ⓘ Screening estimate from a state-policy table — verify with the county assessor before closing.
Climate risk First Street
- Flood 3/10 Moderate FEMA zone X (unshaded) · 16% chance over 30 yrs
- Wildfire 1/10 Low
- Heat 4/10 Moderate 7 d/yr ≥87°F today · 22 d/yr by 30 yrs out
- Wind 1/10 Low
- Air quality 5/10 Major 7 unhealthy d/yr today · 7 by 30 yrs out
Nearby sold comps map
Loading sold comps map…
Walkable amenities ~0.75 mi
Loading nearby amenities…
Taxation est. · year 1
- Rental income
- $40,524
- − Mortgage interest
- −$14,004
- − Property taxes
- −$1,713
- − Insurance
- −$1,250
- − Repairs & maintenance
- −$3,242
- − Management
- −$3,242
- − Depreciation
- −$7,273
- Taxable income
- $9,800
- Est. tax owed @ 24.0%
- −$2,352
- After-tax cash flow
- $10,966/yr
For passive investors: Depreciation is non-cash, so a rental often shows a tax loss while cash-flowing — sheltering income. Rental losses are passive: they offset passive income freely, and up to $25,000/yr can offset ordinary (W-2) income if you actively participate and your MAGI is under $100k (phasing out to $0 by $150k); unused losses carry forward. On sale, claimed depreciation is recaptured at up to 25%, and gains may owe capital-gains tax (a 1031 exchange can defer both). Figures are a year-1 estimate at your 24.0% rate — not tax advice; consult a CPA.
Condition & rehab AI · 12 photos
This well-maintained 3-bedroom, 2-bath manufactured home is ready for a fresh coat of paint and some minor updates to increase its value.
Value-add opportunities
- Both Paint the exterior and interior walls — Fresh paint enhances curb appeal and interior aesthetics.
- Both Replace the flooring with a more durable material — Durable flooring improves both resale and rental value.
- Both Install new kitchen appliances — Modern appliances can increase both resale and rental value.
- Both Add a smart home system — Smart home features can increase both resale and rental value by adding convenience and modern amenities.
Renovation cost estimate screening
Value-add ROI direction
- Both Paint the exterior and interior walls — Fresh paint enhances curb appeal and interior aesthetics. ↑
- Both Replace the flooring with a more durable material — Durable flooring improves both resale and rental value. ↑
- Both Install new kitchen appliances — Modern appliances can increase both resale and rental value. ↑
- Both Add a smart home system — Smart home features can increase both resale and rental value by adding convenience and modern amenities. ↑
ⓘ Cost ranges are severity-bucket heuristics (US national rule-of-thumb). Get contractor quotes + a written scope before underwriting a rehab budget.
Schools (NCES district)
- District
- Los Angeles Unified
- NCES district ID
- 0622710
- Math proficiency
- 29% ▼ -4.00%
- Reading proficiency
- 54% ▲ 10.00%
- Median HH income
- $50,403
- Composite
- 35.67/100
- National rank
- #4875
- State rank
- #223 of 517 in CA
Livability — West Carson
- Score
- 64/100
- State rank
- #408
- US rank
- #13927
Category grades
Schools grade is shown separately in the Schools card above.
Census & demographics
- Census place
- West Carson, CA
- County
- Los Angeles County · 9,444,647 people
- City population
- 18,467
- Metro
- Los Angeles-Long Beach-Anaheim, CA
- Population (ZIP)
- 18,467
- Household income
- $94,291
- Rent vs Own
- Severe rent burden
- 593.0
Population outlook (Los Angeles County) Hauer SSP2
- Today (2025)
- 10,940,515 people
- By 2030
- 11,256,481 · +2.9%
- By 2040
- 11,729,929 · +7.2%
- By 2050
- 11,948,407 · +9.2%
- By 2075
- 11,818,114 · +8.0%
- By 2100
- 10,842,928 · -0.9%
Race, ethnicity, and origin ACS 2023
- Neighborhood character
- Highly diverse neighborhood (Simpson 0.71)
- Race & ethnicity
- Asian 37% Hispanic / Latino 36% White 14% Two or more races 14% Black 8%
- Hispanic origin (detail)
- Mexican 29%
- Common ancestry
- Romanian 1% Russian 1% Lithuanian 1%
- Foreign-born
- 38% · Canada, South Korea, China
- Languages at home
- 42% English-only · Spanish 29% Tagalog/Filipino 12% Korean 6%
Political lean MEDSL · Los Angeles
- 2024 margin
- Solid D (+32.9) · D 64.8% · R 31.9% · Other 3.3%
- 2008→2024 swing
- -7.4pp toward R · 2008: 40.4pp · 2024: 32.9pp
- All cycles
- 2024: D+32.9 2020: D+44.2 2016: D+48.0 2012: D+40.0 2008: D+40.4
Not yet ingested
- Civics
- —
Market trends
- HPI YoY
- ▼ -647.11%
- Current HPI
- 417.1507
- Rent YoY
- —
- Metro
- Los Angeles-Long Beach-Anaheim, CA
- State GDP YoY
- ▲ 3.21%
- F500 in state
- 116
Industry mix (Fortune 500 HQ in CA)
| Industry | F500 HQs | Revenue |
|---|---|---|
| Technology | 27 | $1,492B |
|
||
| Financial Services | 3 | $174B |
|
||
| Retail | 3 | $44B |
|
||
| Insurance | 3 | $26B |
|
||
| Media / Entertainment | 2 | $115B |
|
||
| Pharmaceuticals / Biotech | 2 | $62B |
|
||
Price history
-10.7% since first listed8 events — show timeline
- 2026-03-27 Price Changed $250,000 CRMLS
- 2026-01-28 Listed $280,000 CRMLS
- 2025-09-30 Listing Removed — CRMLS
- 2025-06-09 Price Changed $280,000 CRMLS
- 2025-05-25 Relisted — CRMLS
- 2024-12-20 Relisted — CRMLS
- 2024-12-20 Price Changed $300,000 CRMLS
- 2024-10-22 Listed $280,000 CRMLS
Property tax history
+2.0%/yrLatest (2025): $1,713 · +2.0% YoY. Source: county tax records.
Cash-flow waterfall
monthlySold comps — $/sqft
last 12 mo · ≤1 miLoading sold comps…