 🌊 Lakefront
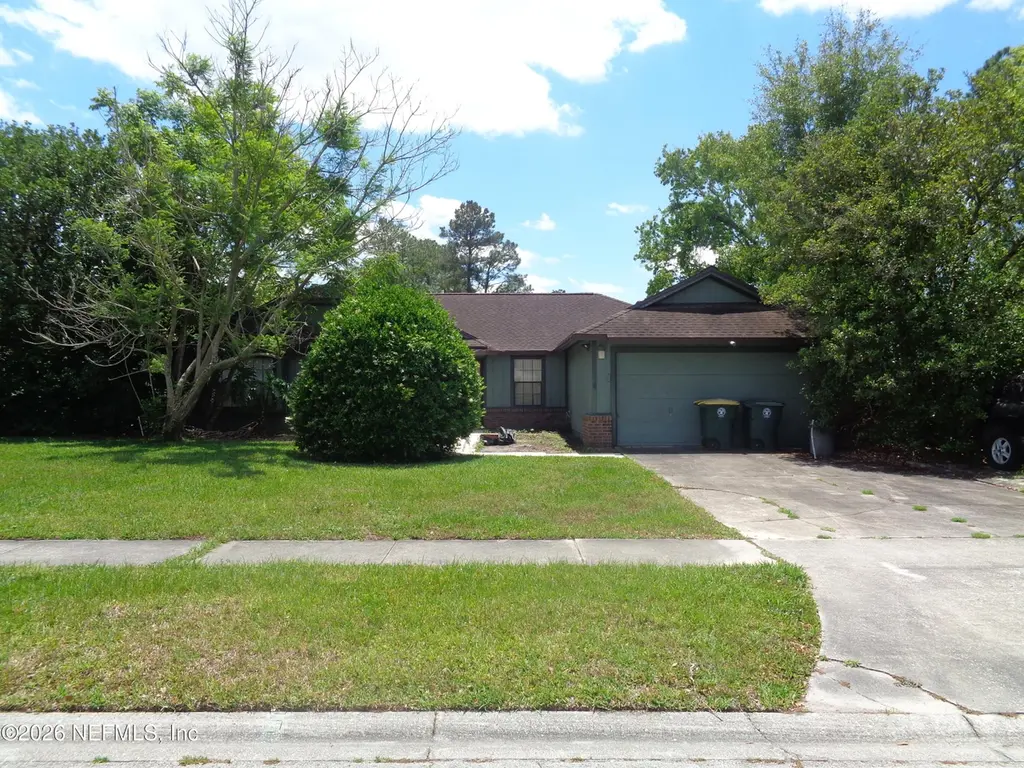
3526 Sheldrake Dr · Jacksonville, FL
Flood risk 1/10 · Minimal
- FEMA flood zone
- X (unshaded)
- Chance of flooding over 30 yrs
- 0.0%
- Est. flood insurance / yr
- $507 – $1,088
Fire risk 4/10 · Minor
- Est. fire insurance / yr
- $947 – $1,759
Heat risk 9/10 · Severe
- Hot days now (above 107°F)
- 7 days/yr
- Hot days in 30 yrs
- 20 days/yr
Wind risk 10/10 · Severe
- Chance of severe wind over 30 yrs
- 99.0%
Air-quality risk 4/10 · Minor
- Unhealthy air days now
- 4 days/yr
- Unhealthy air days in 30 yrs
- 6 days/yr
Risk factors via First Street. Map © Google.
Why this score? — see what drove the D grade
The composite is a weighted blend of 9 inputs, each scored 0–100. Each bar is that input's sub-score; the figure is the points it added to the 100-point composite (weight × sub-score).
- ARV discount +15.0/15.0
- Cash flow +10.7/30.0
- Livability +4.2/5.0
- 1% rule +3.9/10.0
- Schools +3.9/10.0
- DSCR +3.1/10.0
- Condition / age +2.5/5.0
- Rent growth +1.7/5.0
- Appreciation +0.0/10.0
$234,900
🖨 Deal sheet 📄 Offer letter ✓ Due diligence
Listing remarks MLS
4/2 Pool Home located in nice neighborhood in Mandarin. Split floor plan. Needs renovations. CASH ONLY! SELLERS TO MAKE NO REPAIRS.
Key facts
- Screened porch
- Overlooks a lake
- In ground pool
Tags
Property features AI
Finance
- HOA & community: Not a senior community
Exterior
- Parking: Garage; 2-car garage
- Utilities: Public sewer; Electricity connected; Sewer connected; Water connected
- Home design: Single-family residence; One level
- Construction: Wood siding
- Exterior features: Patio; Screened porch; Lake front property; City street frontage; Asphalt road
Interior
- Kitchen: No appliances included
- Bedrooms: 4 bedrooms
- Flooring: Carpet
- Bathrooms: 2 full bathrooms
- Heating & cooling: Central heating; Central air conditioning
- Interior features: Eat-in kitchen; Kitchen island; Wood burning fireplace (1)
- Laundry & utility: Washer hookup; Electric dryer hookup
Neighborhood map
What this means for you Summary
Snapshot
- This is a 3-bed/2.0-bath single-family listed at $235k.
Deal economics
- At list price, monthly cash flow is $-110 ($-1k/yr) — negative.
- To cash-flow at today's rent, offer at most $216k (8.2% below list).
- To meet the 1% rule (rent ≥ 1% of price), the offer needs to be $209k (11.1% below list).
- Recommended offer: $209k (11.1% below list) — sets the bar for 1% rule.
- Cap rate 5.7% vs local median 4.0% in Jacksonville — top-decile yield for the area; either an underpriced asset or a hidden risk that comps aren't pricing in. Stress-test before assuming the spread holds.
Location & tenants
- Location reads 83/100 on livability (#50 in FL, #911 nationally) — a professional / high-income tenant draw. Strengths: amenities A+, commute A+, housing A+.
- Duval (urban): math 46% / reading 45% proficiency, ranked #48 of 73 in FL (top 66%) — families likely to look elsewhere, expect single-tenant / working-renter base with shorter leases.
- Market conditions: Rents falling (-3.4%/yr); 122 active listings in the ZIP; 12 comparable units currently listed for rent nearby; rentals at typical pace (median 14d on market — plan ~3-4 weeks tenant-placement turnaround); solid renter incomes; 6,503 units permitted in Duval County in 2024 (1,131 in 5+ unit buildings).
Forward outlook
- Local home prices are declining (-3.0%/yr); year-one equity from $2k of loan paydown is wiped out by about $7k of value loss. Plan a longer hold.
- Duval County population projected at +19% by 2050 — long-run rental-demand tailwind backs the buy-and-hold thesis.
Negotiation context
- Only 6 days on market — expect competitive offers; lowballing is unlikely to land.
- 3 sale attempts since 22y ago with the ask held roughly flat each time — persistent listings suggest the price (not the market) is what's stuck; bring a comps-based counter.
- Current owner paid $181k; 30% above their basis — modest negotiation headroom, anchor on the comps not their cost.
Risks & watch-outs
- Climate carrying-cost: severe wind risk, 99% chance of damaging wind over 30y; extreme-heat days projected 7→20/yr by 2055 (HVAC capex compounding) — expect insurance premiums to compound above CPI over the hold.
Questions for the listing agent
- What do current leases actually rent for vs. the listed asking? Can we see a recent rent roll and the last 12 months of T-12 income?
- Is there a deadline driving the sale (1031 exchange, divorce, estate, relocation)? That informs how much negotiation room exists.
- Schools are B-rated — typically a magnet for longer-tenancy family renters. What's the average tenant stay here, and is there a school-zone premium baked into asking?
- The area grade is low — what's the realistic commute time and amenity access for the typical tenant pool here? Any planned neighborhood developments (good or bad) we should know about?
- This sits on a lake — are riparian / water-frontage rights deeded with the parcel? Any dock permits, shoreline easements, or HOA water-use restrictions?
- What's the documented flood / surge / shoreline-erosion history here (FEMA AND non-FEMA — e.g., storm surge, creek backup, septic-field saturation)?
- Any water-quality or seasonal algae-bloom issues that affect tenant satisfaction or short-term-rental demand?
- What's the average days-on-market for RENTAL listings here right now (not sales)? A rising rental-DOM trend means longer vacancies and softer asking-rent achievability than the comps imply.
- What's the recent tenant-quality profile in this submarket — average credit score on applications, eviction rate, late-payment / NSF rate, and stable-employment percentage? A property-management company in the area should have these aggregated.
- How much new for-sale + rental construction is in the pipeline within 1–3 miles? Heavy new supply typically softens prices + rents 12–24 months out; constrained supply supports both.
Investment metrics
- 1% rule
- 0.89% ✗
- Cap rate
- 5.73%
- Cash-on-cash
- -2.00%
- DSCR
- 0.91
- GRM
- 9.4
CMA / ARV
- ARV (on-the-fly)
- $376,797
- Comps found
- 12
Show comp detail 12 sales within ~0.75 mi
| Address | Dist | Beds/Ba | Sqft | Sold | Price | $/sf | Match |
|---|---|---|---|---|---|---|---|
| 11923 Marabou Ct S | 0.05mi | 3/2.0 | 1,783 (+1%) | 7mo | $355,000 | $199 | 90 |
| 11850 Tumbling Oaks Ln | 0.14mi | 3/2.0 | 1,828 (+3%) | 1mo | $365,000 | $200 | 87 |
| 3563 Lazy Willow Ct | 0.35mi | 3/2.0 | 1,647 (-7%) | 1mo | $360,100 | $219 | 72 |
| 11531 Knobby Way | 0.59mi | 3/2.0 | 1,685 (-5%) | 1mo | $390,000 | $231 | 64 |
| 12157 Cheyenne Trl | 0.51mi | 3/2.0 | 1,886 (+7%) | 2mo | $455,000 | $241 | 64 |
| 3382 Cheyenne Ln | 0.34mi | 3/2.0 | 1,962 (+11%) | 3mo | $325,000 | $166 | 63 |
| 11530 W Ride Dr | 0.48mi | 3/2.0 | 1,636 (-8%) | 8mo | $330,000 | $202 | 59 |
| 3603 North Ride Dr | 0.57mi | 4/2.0 (+1) | 1,870 (+6%) | 1mo | $270,000 | $144 | 58 |
| 11851 Pegasus Dr | 0.31mi | 3/2.0 | 2,023 (+14%) | 8mo | $495,000 | $245 | 55 |
| 11562 W Ride Dr | 0.41mi | 3/2.0 | 1,538 (-13%) | 5mo | $358,000 | $233 | 54 |
| 3882 Habersham Forest Dr | 0.72mi | 3/2.0 | 1,849 (+4%) | 7mo | $302,000 | $163 | 53 |
| 11958 Swooping Willow Rd | 0.74mi | 3/2.0 | 1,598 (-10%) | 2mo | $340,000 | $213 | 48 |
Match score weights: distance 35% · size 25% · config 20% · recency 20%. Top-matched comps best support the ARV.
Projected returns pro-forma
-3.0% appreciation · 0.0% rent growth · sell at horizon
- IRR
- -23.3%
- Equity multiple
- 0.22×
- Total profit
- $-51,050
- Equity at exit
- $35,024
- IRR
- -30.2%
- Equity multiple
- -0.16×
- Total profit
- $-76,624
- Equity at exit
- $20,310
Cash invested: $65,772 (down + closing). Projections, not guarantees.
Landlord ↔ Tenant lean methodology
- Overall (STATE)
- 87 Strongly Landlord-Friendly
- State Florida
- 87 Strongly Landlord-Friendly · R+3
- County
- — inherits STATE
- City
- — inherits STATE
ZIP-level market 32223
- Rents YoY
- -3.4%
- Active inventory
- 122
- Price-to-rent
- 9.4×
Monthly cashflow live
- Estimated rent
- $2,088 high interval (Pro) →
- Mortgage (P&I)
- −$1,232
- Tax from tax record
- −$429 /mo · $5,152/yr
- Insurance
- −$98
- HOA
- −$0
- Vacancy / Maint / Mgmt
- −$438
- Net cashflow
- $-110
Break-even live
UW: 25.0% down · 7.5% · 30yr · 1.5% tax · 5.0% vac · 8.0% maint · 8.0% mgmt
Financing live
Cash to close
- Down payment
- $58,725
- Closing costs
- $7,047
- Reserves months
- —
- Total cash needed
- —
Loan-product check · same deal, 3 products live
Conventional
25% down · 7.5% · 30yr
- Down + closing
- —
- Monthly P&I
- —
- Monthly cashflow
- —
- DSCR
- —
- Eligible?
- —
Personal DTI + credit; lowest rate.
DSCR
20% down · 8.5% · 30yr
- Down + closing
- —
- Monthly P&I
- —
- Monthly cashflow
- —
- DSCR
- —
- Eligible?
- —
No personal income docs; deal must DSCR.
Hard money
10% down · 12.0% · 12mo
- Down + closing
- —
- Monthly P&I
- —
- Monthly cashflow
- —
- DSCR
- —
- Eligible?
- —
Short-term bridge; refi at stabilization.
Rent comps 12 comps
| Address | Beds | Baths | Sqft | Rent | $/sqft | DOM | Units | Dist |
|---|---|---|---|---|---|---|---|---|
| 3372 Mandarin Glen Cir S Jacksonville, FL | 3.0 | 2.0 | 1296 | $1,800 | $1.39 | 7d | 1 | 0.63mi |
| 3139 Mountain Ash Rd E Jacksonville, FL | 3.0 | 2.0 | 1801 | $2,300 | $1.28 | 10d | 1 | 0.70mi |
| 3083 Marbon Estates Ln S Jacksonville, FL | 3.0 | 2.0 | 1601 | $2,299 | $1.44 | 23d | 1 | 0.90mi |
| 11325 McNichols Ct Jacksonville, FL | 3.0 | 2.0 | 1865 | $2,375 | $1.27 | 7d | 1 | 0.91mi |
| 3910 Karissa Ann Pl E Jacksonville, FL | 3.0 | 2.0 | 1405 | $2,250 | $1.60 | 14d | 1 | 0.96mi |
| 3990 Clearwater Ln Jacksonville, FL | 2.0 | 2.0 | 1914 | $1,995 | $1.04 | 23d | 1 | 0.98mi |
| 3990 Clearwater Ln Jacksonville, FL | 2.0 | 2.0 | 1914 | $1,995 | $1.04 | 14d | 1 | 0.98mi |
| 11247 San Jose Blvd Jacksonville, FL | 1.0–3.0 | 1.0–2.0 | 1109 | $1,797 | $1.62 | 1d | 11 | 1.00mi |
| 3900 Oldfield Crossing Dr Jacksonville, FL | 1.0–3.0 | 1.0–2.0 | 1107 | $1,828 | $1.65 | 1d | 24 | 1.01mi |
| 12397 San Jose Blvd Jacksonville, FL | 1.0–3.0 | 1.0–2.0 | 1095 | $2,569 | $2.35 | 2d | 21 | 1.18mi |
| 12604 Condor Dr Jacksonville, FL | 4.0 | 2.0 | 1386 | $2,000 | $1.44 | 23d | 1 | 1.30mi |
| 12637 Condor Dr Jacksonville, FL | 3.0 | 2.0 | 1245 | $2,250 | $1.81 | 23d | 1 | 1.31mi |
Listing history 9 events
-
2026-05-22$234,900 Active
-
2019-08-25historical 132-char remark
Show marketing remark (132 chars)
4/2 Pool Home located in nice neighborhood in Mandarin. Split floor plan. Needs renovations. CASH ONLY! SELLERS TO MAKE NO REPAIRS.
-
2019-08-25$185,000 Active 132-char remark
Show marketing remark (132 chars)
4/2 Pool Home located in nice neighborhood in Mandarin. Split floor plan. Needs renovations. CASH ONLY! SELLERS TO MAKE NO REPAIRS.
-
2004-05-25soldstatus $181,000
-
2004-05-10soldstatus $181,000 392-char remark
Show marketing remark (392 chars)
BEAUTIFULLY MAINTAINED HOME WITH MARVELOUS MANDARIN LOCATION! FOUR BEDROOMS, TWO BATHS, SCREENED PORCH WITH TILE FLOOR OVERLOOKS SPARKLING POOL AND VERY LARGE NATURAL LAKE TEEMING WITH FISH AND TURTLES. A PADDLE BOAT STAYS WITH THE PROPERTY FOR QUIET CRUISES ON THE LAKE. LARGE STORAGE SHED, TERMITE BOND WITH SENTRICON, IRRIGATION WELL & SPRINKLER SYSTEM. AC NEW IN 2002. SHOW AND SELL!!
-
2004-03-29$184,900 392-char remark
Show marketing remark (392 chars)
BEAUTIFULLY MAINTAINED HOME WITH MARVELOUS MANDARIN LOCATION! FOUR BEDROOMS, TWO BATHS, SCREENED PORCH WITH TILE FLOOR OVERLOOKS SPARKLING POOL AND VERY LARGE NATURAL LAKE TEEMING WITH FISH AND TURTLES. A PADDLE BOAT STAYS WITH THE PROPERTY FOR QUIET CRUISES ON THE LAKE. LARGE STORAGE SHED, TERMITE BOND WITH SENTRICON, IRRIGATION WELL & SPRINKLER SYSTEM. AC NEW IN 2002. SHOW AND SELL!!
-
1997-07-03soldstatus $107,000
-
1991-07-01soldstatus $103,500
-
1988-04-01soldstatus $82,500
ⓘ Source: listings_history table (triggers on properties + properties_extension) + one-shot
backfill from property_details.listing_events for pre-trigger history.
Tax reassessment forecast FL · Resets to sale price
- Current annual tax
- $5,152 · $429/mo
- Projected year-2 tax
- $5,152 · $429/mo
- Expected delta
- $0/yr ($0/mo · 0.0%)
ⓘ Screening estimate from a state-policy table — verify with the county assessor before closing.
Climate risk First Street
- Flood 1/10 Low FEMA zone X (unshaded) · 0% chance over 30 yrs
- Wildfire 4/10 Moderate
- Heat 9/10 Extreme 7 d/yr ≥107°F today · 20 d/yr by 30 yrs out
- Wind 10/10 Extreme 99% chance of damaging wind over 30 yrs
- Air quality 4/10 Moderate 4 unhealthy d/yr today · 6 by 30 yrs out
Nearby sold comps map
Loading sold comps map…
Walkable amenities ~0.75 mi
Loading nearby amenities…
Taxation est. · year 1
- Rental income
- $25,054
- − Mortgage interest
- −$13,158
- − Property taxes
- −$5,152
- − Insurance
- −$1,174
- − Repairs & maintenance
- −$2,004
- − Management
- −$2,004
- − Depreciation
- −$6,833
- Taxable loss
- −$5,272
- Est. tax savings @ 24.0%
- +$1,265
- After-tax cash flow
- $-50/yr
For passive investors: Depreciation is non-cash, so a rental often shows a tax loss while cash-flowing — sheltering income. Rental losses are passive: they offset passive income freely, and up to $25,000/yr can offset ordinary (W-2) income if you actively participate and your MAGI is under $100k (phasing out to $0 by $150k); unused losses carry forward. On sale, claimed depreciation is recaptured at up to 25%, and gains may owe capital-gains tax (a 1031 exchange can defer both). Figures are a year-1 estimate at your 24.0% rate — not tax advice; consult a CPA.
Schools (NCES district)
- District
- Duval
- NCES district ID
- 1200480
- Math proficiency
- 46% ▼ -11.00%
- Reading proficiency
- 45% ▼ -4.00%
- Median HH income
- $48,987
- Composite
- 38.97/100
- National rank
- #4076
- State rank
- #48 of 73 in FL
Livability — Jacksonville
- Score
- 83/100
- State rank
- #50
- US rank
- #911
Category grades
Schools grade is shown separately in the Schools card above.
Census & demographics
- Census place
- Jacksonville, FL
- County
- Duval County · 1,015,274 people
- City population
- 979,034
- Metro
- Jacksonville, FL
- Population (ZIP)
- 26,160
- Household income
- $95,347
- Rent vs Own
- Severe rent burden
- 380.0
Population outlook (Duval County) Hauer SSP2
- Today (2025)
- 1,013,010 people
- By 2030
- 1,059,228 · +4.6%
- By 2040
- 1,141,439 · +12.7%
- By 2050
- 1,205,258 · +19.0%
- By 2075
- 1,324,282 · +30.7%
- By 2100
- 1,319,620 · +30.3%
Race, ethnicity, and origin ACS 2023
- Neighborhood character
- Predominantly White (76%)
- Race & ethnicity
- White 76% Two or more races 11% Hispanic / Latino 9% Black 6% Asian 2%
- Hispanic origin (detail)
- Mexican 1% Puerto Rican 2% Cuban 1%
- Common ancestry
- Italian 6% Slovak 3% Romanian 3%
- Foreign-born
- 10% · Canada, Jamaica
- Languages at home
- 88% English-only · Spanish 5% Other Indo-European 2% Arabic 2%
Political lean MEDSL · Duval
- 2024 margin
- Toss-up / Even · D 48.7% · R 50.1% · Other 1.2%
- 2008→2024 swing
- +0.4pp no change · 2008: -1.9pp · 2024: -1.5pp
- All cycles
- 2024: R+1.5 2020: D+3.8 2016: R+1.5 2012: R+3.6 2008: R+1.9
Not yet ingested
- Civics
- —
Market trends
- HPI YoY
- ▼ -254.71%
- Current HPI
- 296.3365
- Rent YoY
- ▼ -3.38%
- Metro
- Jacksonville, FL
- State GDP YoY
- ▲ 3.28%
- F500 in state
- 36
Industry mix (Fortune 500 HQ in FL)
| Industry | F500 HQs | Revenue |
|---|---|---|
| Industrial Technology | 2 | $29B |
|
||
| Insurance | 2 | $17B |
|
||
| Retail | 1 | $60B |
|
||
| Technology Distribution | 1 | $58B |
|
||
| Homebuilding | 1 | $35B |
|
||
| Technology Manufacturing | 1 | $35B |
|
||
Price history
+184.7% since first listed9 events — show timeline
- 2026-05-22 Listed $234,900 realMLS
- 2019-08-25 Listed $185,000 realMLS
- 2019-08-25 Listing Removed — realMLS
- 2004-05-25 Sold (Public Records) $181,000 Public Records
- 2004-05-10 Sold (MLS) $181,000 realMLS
- 2004-03-29 Listed $184,900 realMLS
- 1997-07-03 Sold (Public Records) $107,000 Public Records
- 1991-07-01 Sold (Public Records) $103,500 Public Records
- 1988-04-01 Sold (Public Records) $82,500 Public Records
Property tax history
+9.7%/yrLatest (2025): $5,152 · +6.4% YoY. Source: county tax records.
Cash-flow waterfall
monthlySold comps — $/sqft
last 12 mo · ≤1 miLoading sold comps…