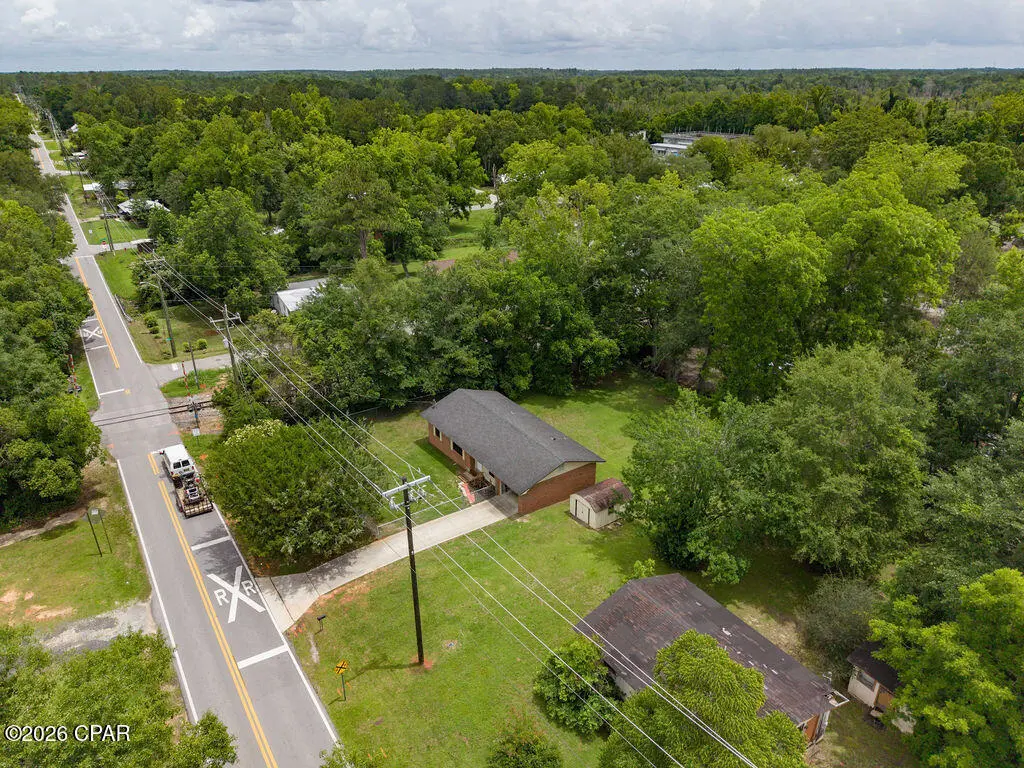
406 S Hubbard St · Bonifay, FL
Flood risk 1/10 · Minimal
- FEMA flood zone
- X (unshaded)
- Chance of flooding over 30 yrs
- 0.0%
- Est. flood insurance / yr
- $507 – $1,088
Fire risk 5/10 · Moderate
- Est. fire insurance / yr
- $947 – $1,759
Heat risk 8/10 · Major
- Hot days now (above 107°F)
- 7 days/yr
- Hot days in 30 yrs
- 19 days/yr
Wind risk 9/10 · Severe
- Chance of severe wind over 30 yrs
- 99.0%
Air-quality risk 2/10 · Minimal
- Unhealthy air days now
- 1 days/yr
- Unhealthy air days in 30 yrs
- 1 days/yr
Risk factors via First Street. Map © Google.
Why this score? — see what drove the F grade
The composite is a weighted blend of 9 inputs, each scored 0–100. Each bar is that input's sub-score; the figure is the points it added to the 100-point composite (weight × sub-score).
- Appreciation +10.0/10.0
- Cash flow +7.9/30.0
- Schools +3.7/10.0
- Livability +3.4/5.0
- Rent growth +2.5/5.0
- Condition / age +2.5/5.0
- DSCR +2.0/10.0
- 1% rule +1.2/10.0
- ARV discount +0.0/15.0
$165,000
🖨 Deal sheet 📄 Offer letter ✓ Due diligence
Listing remarks MLS
'CURRENTLY UNDER CONTRACT, SELLER WILL CONSIDER BACKUP OFFERS' Almost like new!!! Nice, clean and cute as a button is this 3-bedroom Brick home on lot in the City of Bonifay, Florida. Open concept with living room, dining room and kitchen. Large living room. Cozy country Kitchen. Inside walls have new paint. Garage has been finished out with sheetrock and has auto garage door. Can easily make into more living area. Nice windows with darkening screens that help to control your air-conditioning electric bill. Newer roof. Good sized laundry room with large sink. Concrete driveway. Metal Storage building. Conveniently located on paved street at the edge of town. Check it out today. It won't be available for long.
Key facts
- Paved street
- Finished garage
- Fully fenced lot
Tags
Property features AI
Exterior
- Parking: Attached garage with space for 1 car
- Utilities: Public sewer
- Home design: Single-story (1 story)
- Construction: Brick construction; Shingle/composition roof
- Exterior features: Full chain-link fencing around the property; Lot dimensions approximately 155 x 116
Interior
- Kitchen: Electric range
- Bedrooms: Primary bedroom on first floor; Additional bedrooms on first floor (12 x 9; 10 x 11)
- Bathrooms: 1 full bathroom
- Heating & cooling: Central heating; Central air conditioning
- Interior features: Total of 3 rooms; Verify room measurements listed in room descriptions
- Laundry & utility: Electric water heater
Neighborhood map
What this means for you Summary
Snapshot
- This is a 3-bed/1.0-bath single-family listed at $165k.
Deal economics
- At list price, monthly cash flow is $-176 ($-2k/yr) — negative.
- To cash-flow at today's rent, offer at most $134k (18.8% below list).
- To meet the 1% rule (rent ≥ 1% of price), the offer needs to be $102k (38.2% below list).
- Recommended offer: $102k (38.2% below list) — sets the bar for 1% rule.
- Cap rate 5.0% vs local median 3.8% in Bonifay — top-decile yield for the area; either an underpriced asset or a hidden risk that comps aren't pricing in. Stress-test before assuming the spread holds.
Location & tenants
- Location reads 67/100 on livability (#577 in FL) — a middle-class / working-renter tenant base. Strengths: crime A+, cost of living A+, housing A+; Watch: schools D, amenities F, commute F.
- Holmes (rural): math 44% / reading 45% proficiency, ranked #53 of 73 in FL (top 73%) — families likely to look elsewhere, expect single-tenant / working-renter base with shorter leases.
- Market conditions: 141 active listings in the ZIP; 12 units permitted in Holmes County in 2024 (0 in 5+ unit buildings).
Forward outlook
- In year one you build about $18k of equity ($1k loan paydown + $16k appreciation (10.0% local appreciation)).
- Holmes County population projected at -17% by 2050 — secular population decline; favor cash flow + early exit over multi-decade hold.
- By year 3, paydown + projected appreciation supports a ~$45k cash-out refi (75% LTV) — recoverable capital for the next deal without selling this one.
Negotiation context
- It's been on market 17 days — a 2% lower offer ($163k) is reasonable based on typical stale-listing flexibility.
- 2 sale attempts since 2y ago with the ask held roughly flat each time — persistent listings suggest the price (not the market) is what's stuck; bring a comps-based counter.
Risks & watch-outs
- Climate carrying-cost: severe wind risk, 99% chance of damaging wind over 30y; moderate wildfire risk; extreme-heat days projected 7→19/yr by 2055 (HVAC capex compounding) — expect insurance premiums to compound above CPI over the hold.
Questions for the listing agent
- What do current leases actually rent for vs. the listed asking? Can we see a recent rent roll and the last 12 months of T-12 income?
- Is there a deadline driving the sale (1031 exchange, divorce, estate, relocation)? That informs how much negotiation room exists.
- Schools are D-rated, which usually means shorter tenancies and higher turnover. Who's the typical renter profile here, and what's been the actual vacancy rate?
- The area grade is low — what's the realistic commute time and amenity access for the typical tenant pool here? Any planned neighborhood developments (good or bad) we should know about?
- What's the average days-on-market for RENTAL listings here right now (not sales)? A rising rental-DOM trend means longer vacancies and softer asking-rent achievability than the comps imply.
- What's the recent tenant-quality profile in this submarket — average credit score on applications, eviction rate, late-payment / NSF rate, and stable-employment percentage? A property-management company in the area should have these aggregated.
- How much new for-sale + rental construction is in the pipeline within 1–3 miles? Heavy new supply typically softens prices + rents 12–24 months out; constrained supply supports both.
Investment metrics
- 1% rule
- 0.62% ✗
- Cap rate
- 5.01%
- Cash-on-cash
- -4.57%
- DSCR
- 0.80
- GRM
- 13.5
CMA / ARV
- ARV (on-the-fly)
- $121,500
- Comps found
- 2
Show comp detail 2 sales within ~0.75 mi
| Address | Dist | Beds/Ba | Sqft | Sold | Price | $/sf | Match |
|---|---|---|---|---|---|---|---|
| 203 Hubbard Ave | 0.32mi | 3/1.0 | 1,036 (+7%) | 16mo | $129,000 | $125 | 60 |
| 107 E Indiana Ave | 0.65mi | 2/1.0 (-1) | 912 (-6%) | 17mo | $67,000 | $73 | 41 |
Match score weights: distance 35% · size 25% · config 20% · recency 20%. Top-matched comps best support the ARV.
Projected returns pro-forma
10.0% appreciation · 3.0% rent growth · sell at horizon
- IRR
- 21.0%
- Equity multiple
- 2.70×
- Total profit
- $78,579
- Equity at exit
- $148,645
- IRR
- 19.0%
- Equity multiple
- 6.20×
- Total profit
- $240,046
- Equity at exit
- $320,559
Cash invested: $46,200 (down + closing). Projections, not guarantees.
Landlord ↔ Tenant lean methodology
- Overall (STATE)
- 87 Strongly Landlord-Friendly
- State Florida
- 87 Strongly Landlord-Friendly · R+3
- County
- — inherits STATE
- City
- — inherits STATE
ZIP-level market 32425
- Home prices YoY
- 16.2%
- Active inventory
- 141
- Price-to-rent
- 13.5×
Monthly cashflow live
- Estimated rent
- $1,019 medium interval (Pro) →
- Mortgage (P&I)
- −$865
- Tax from tax record
- −$47 /mo · $562/yr
- Insurance
- −$69
- HOA
- −$0
- Vacancy / Maint / Mgmt
- −$214
- Net cashflow
- $-176
Break-even live
UW: 25.0% down · 7.5% · 30yr · 1.5% tax · 5.0% vac · 8.0% maint · 8.0% mgmt
Financing live
Cash to close
- Down payment
- $41,250
- Closing costs
- $4,950
- Reserves months
- —
- Total cash needed
- —
Loan-product check · same deal, 3 products live
Conventional
25% down · 7.5% · 30yr
- Down + closing
- —
- Monthly P&I
- —
- Monthly cashflow
- —
- DSCR
- —
- Eligible?
- —
Personal DTI + credit; lowest rate.
DSCR
20% down · 8.5% · 30yr
- Down + closing
- —
- Monthly P&I
- —
- Monthly cashflow
- —
- DSCR
- —
- Eligible?
- —
No personal income docs; deal must DSCR.
Hard money
10% down · 12.0% · 12mo
- Down + closing
- —
- Monthly P&I
- —
- Monthly cashflow
- —
- DSCR
- —
- Eligible?
- —
Short-term bridge; refi at stabilization.
Listing history 13 events
-
2026-06-18days on market $165,000 Active 17 DOM
-
2026-06-17days on market $165,000 Active 16 DOM
-
2026-06-16days on market $165,000 Active 15 DOM
-
2026-06-15days on market $165,000 Active 14 DOM
-
2026-06-14days on market $165,000 Active 12 DOM
-
2026-06-13days on market $165,000 Active 11 DOM
-
2026-06-10days on market $165,000 Active 9 DOM
-
2026-06-09days on market $165,000 Active 8 DOM
-
2026-06-08days on market $165,000 Active 7 DOM
-
2026-06-07days on market $165,000 Active 6 DOM
-
2026-06-05days on market $165,000 Active 3 DOM
-
2026-06-02remarks 699-char remark
-
2026-06-02$165,000 Active 1 DOM
ⓘ Source: listings_history table (triggers on properties + properties_extension) + one-shot
backfill from property_details.listing_events for pre-trigger history.
Tax reassessment forecast FL · Resets to sale price
- Current annual tax
- $562 · $47/mo
- Projected year-2 tax
- $1,370 · $114/mo
- Expected delta
- +$808/yr (+$67/mo · 143.9%)
ⓘ Screening estimate from a state-policy table — verify with the county assessor before closing.
Climate risk First Street
- Flood 1/10 Low FEMA zone X (unshaded) · 0% chance over 30 yrs
- Wildfire 5/10 Major
- Heat 8/10 Severe 7 d/yr ≥107°F today · 19 d/yr by 30 yrs out
- Wind 9/10 Extreme 99% chance of damaging wind over 30 yrs
- Air quality 2/10 Low 1 unhealthy d/yr today · 1 by 30 yrs out
Nearby sold comps map
Loading sold comps map…
Walkable amenities ~0.75 mi
Loading nearby amenities…
Taxation est. · year 1
- Rental income
- $12,227
- − Mortgage interest
- −$9,243
- − Property taxes
- −$562
- − Insurance
- −$825
- − Repairs & maintenance
- −$978
- − Management
- −$978
- − Depreciation
- −$4,800
- Taxable loss
- −$5,158
- Est. tax savings @ 24.0%
- +$1,238
- After-tax cash flow
- $-873/yr
For passive investors: Depreciation is non-cash, so a rental often shows a tax loss while cash-flowing — sheltering income. Rental losses are passive: they offset passive income freely, and up to $25,000/yr can offset ordinary (W-2) income if you actively participate and your MAGI is under $100k (phasing out to $0 by $150k); unused losses carry forward. On sale, claimed depreciation is recaptured at up to 25%, and gains may owe capital-gains tax (a 1031 exchange can defer both). Figures are a year-1 estimate at your 24.0% rate — not tax advice; consult a CPA.
Schools (NCES district)
- District
- Holmes
- NCES district ID
- 1200900
- Math proficiency
- 44% ▼ -5.00%
- Reading proficiency
- 45% ▼ -7.00%
- Median HH income
- $35,365
- Composite
- 36.83/100
- National rank
- #4558
- State rank
- #53 of 73 in FL
Livability — Bonifay
- Score
- 67/100
- State rank
- #577
- US rank
- #10976
Category grades
Schools grade is shown separately in the Schools card above.
Census & demographics
- Census place
- Bonifay, FL
- Population (ZIP)
- 13,944
Population outlook (Holmes County) Hauer SSP2
- Today (2025)
- 17,963 people
- By 2030
- 17,245 · -4.0%
- By 2040
- 15,970 · -11.1%
- By 2050
- 14,905 · -17.0%
- By 2075
- 12,327 · -31.4%
- By 2100
- 9,760 · -45.7%
Race, ethnicity, and origin ACS 2023
- Neighborhood character
- Predominantly White (81%)
- Race & ethnicity
- White 81% Black 9% Two or more races 6% Hispanic / Latino 4%
- Common ancestry
- Slovak 1% Iranian 1% Lithuanian 1%
- Foreign-born
- 2% · Canada
- Languages at home
- 94% English-only · Spanish 4% Russian/Polish/Slavic 1% French/Haitian/Cajun 1%
Political lean MEDSL · Holmes
- 2024 margin
- Solid R (+80.2) · D 9.7% · R 89.9%
- 2008→2024 swing
- -15.1pp toward R · 2008: -65.0pp · 2024: -80.2pp
- All cycles
- 2024: R+80.2 2020: R+78.9 2016: R+77.9 2012: R+68.3 2008: R+65.0
Not yet ingested
- Civics
- —
Market trends
- HPI YoY
- ▲ 44.87%
- Current HPI
- 322.29
- Rent YoY
- —
- Metro
- —
- State GDP YoY
- ▲ 3.28%
- F500 in state
- 36
Industry mix (Fortune 500 HQ in FL)
| Industry | F500 HQs | Revenue |
|---|---|---|
| Industrial Technology | 2 | $29B |
|
||
| Insurance | 2 | $17B |
|
||
| Retail | 1 | $60B |
|
||
| Technology Distribution | 1 | $58B |
|
||
| Homebuilding | 1 | $35B |
|
||
| Technology Manufacturing | 1 | $35B |
|
||
Price history
+43.5% since first listed9 events — show timeline
- 2026-06-01 Listed $165,000 CPARMLS
- 2024-09-10 Sold (Public Records) $158,000 Public Records
- 2024-09-09 Sold (MLS) $158,000 CPARMLS
- 2024-07-31 Contingent — CPARMLS
- 2024-06-21 Price Changed $165,000 CPARMLS
- 2024-05-20 Price Changed $169,900 CPARMLS
- 2024-04-25 Price Changed $179,000 CPARMLS
- 2024-04-03 Listed $189,000 CPARMLS
- 2024-02-02 Sold (Public Records) $115,000 Public Records
Property tax history
+11.3%/yrLatest (2025): $562 · -50.3% YoY. Source: county tax records.
Cash-flow waterfall
monthlySold comps — $/sqft
last 12 mo · ≤1 miLoading sold comps…