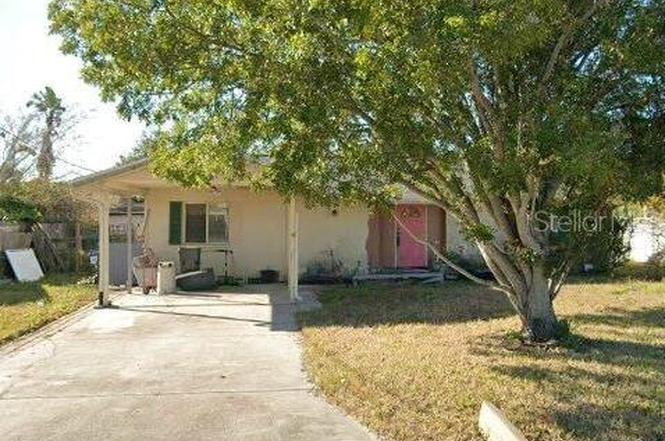
311 42nd Street Ct W · Memphis, FL
Flood risk 6/10 · Moderate
- FEMA flood zone
- X (shaded)
- Chance of flooding over 30 yrs
- 0.56%
- Est. flood insurance / yr
- $507 – $1,088
Fire risk 1/10 · Minimal
- Est. fire insurance / yr
- $947 – $1,759
Heat risk 10/10 · Severe
- Hot days now (above 107°F)
- 7 days/yr
- Hot days in 30 yrs
- 30 days/yr
Wind risk 10/10 · Severe
- Chance of severe wind over 30 yrs
- 99.0%
Air-quality risk 3/10 · Minor
- Unhealthy air days now
- 2 days/yr
- Unhealthy air days in 30 yrs
- 3 days/yr
Risk factors via First Street. Map © Google.
Why this score? — see what drove the C grade
The composite is a weighted blend of 9 inputs, each scored 0–100. Each bar is that input's sub-score; the figure is the points it added to the 100-point composite (weight × sub-score).
- Cash flow +19.4/30.0
- ARV discount +15.0/15.0
- DSCR +6.1/10.0
- 1% rule +5.3/10.0
- Schools +4.4/10.0
- Livability +3.2/5.0
- Condition / age +2.5/5.0
- Rent growth +1.8/5.0
- Appreciation +0.0/10.0
$205,000
🖨 Deal sheet 📄 Offer letter ✓ Due diligence
Listing remarks MLS
Absolutely adorable and really well kept home in desirable Palmetto Point. Stone woodburning fireplace is the living room focal pt. High vaulted ceilings. Indoor laundry area with full size washer and dryer included. Screened Porch overlooks quite privateback yard with shed. Newly redone master bathroom. Split bedroom plan. Pretty kitchen features a large breakfast bar and Glass top electric range. This is NOT A SHORT SALE. Community features boat ramp which can be accessed by being a member of the Palmetto Point Community organization.
Key facts
- 8,320 sq ft lot
- Parking
- Built 1980
Neighborhood map
What this means for you Summary
Snapshot
- This is a 2-bed/2.0-bath single-family listed at $205k.
Deal economics
- At list price, monthly cash flow is $230 ($3k/yr) — positive.
- The deal already cash-flows at list — no discount required.
- Meets the 1% rule at list price ($2k rent vs $205k).
- Cap rate 7.6% vs local median 4.5% in Memphis — top-decile yield for the area; either an underpriced asset or a hidden risk that comps aren't pricing in. Stress-test before assuming the spread holds.
Location & tenants
- Location reads 63/100 on livability (#745 in FL) — a middle-class / working-renter tenant base. Strengths: cost of living A+, housing A+; Watch: employment D+, schools F, amenities F.
- Manatee (suburban): math 54% / reading 50% proficiency, ranked #26 of 73 in FL (top 36%) — acceptable for families but not a draw, mixed tenant base, ~2y average lease.
- Market conditions: Rents soft (-3.0%/yr); 1160 active listings in the ZIP; 12 comparable units currently listed for rent nearby; rentals at typical pace (median 24d on market — plan ~3-4 weeks tenant-placement turnaround); solid renter incomes; 7,472 units permitted in Manatee County in 2024 (1,782 in 5+ unit buildings).
- This rent runs 33% of the median local income ($78k/yr) — at the standard rent-burdened threshold; future hikes will face affordability resistance.
Forward outlook
- Local home prices are declining (-3.0%/yr); year-one equity from $1k of loan paydown is wiped out by about $6k of value loss. Plan a longer hold.
- Manatee County population projected at +43% by 2050 — long-run rental-demand tailwind backs the buy-and-hold thesis.
Negotiation context
- Only 0 days on market — expect competitive offers; lowballing is unlikely to land.
- 4 sale attempts since 18y ago with the ask held roughly flat each time — persistent listings suggest the price (not the market) is what's stuck; bring a comps-based counter.
- Current owner paid $105k; list at $205k implies a 95% gain — meaningful room to come down on a strong offer.
Risks & watch-outs
- Climate carrying-cost: major flood risk; severe wind risk, 99% chance of damaging wind over 30y; extreme-heat days projected 7→30/yr by 2055 (HVAC capex compounding) — expect insurance premiums to compound above CPI over the hold.
Questions for the listing agent
- Is there a deadline driving the sale (1031 exchange, divorce, estate, relocation)? That informs how much negotiation room exists.
- Schools are F-rated, which usually means shorter tenancies and higher turnover. Who's the typical renter profile here, and what's been the actual vacancy rate?
- What's the average days-on-market for RENTAL listings here right now (not sales)? A rising rental-DOM trend means longer vacancies and softer asking-rent achievability than the comps imply.
- What's the recent tenant-quality profile in this submarket — average credit score on applications, eviction rate, late-payment / NSF rate, and stable-employment percentage? A property-management company in the area should have these aggregated.
- How much new for-sale + rental construction is in the pipeline within 1–3 miles? Heavy new supply typically softens prices + rents 12–24 months out; constrained supply supports both.
Investment metrics
- 1% rule
- 1.03% ✓
- Cap rate
- 7.64%
- Cash-on-cash
- 4.81%
- DSCR
- 1.21
- GRM
- 8.1
CMA / ARV
- ARV (on-the-fly)
- $266,112
- Comps found
- 12
Show comp detail 12 sales within ~0.75 mi
| Address | Dist | Beds/Ba | Sqft | Sold | Price | $/sf | Match |
|---|---|---|---|---|---|---|---|
| 416 41st St W | 0.10mi | 2/1.0 | 1,196 (+4%) | 2mo | $275,000 | $230 | 84 |
| 516 45th Street Ct W | 0.28mi | 2/2.0 | 1,129 (-2%) | 2mo | $345,000 | $306 | 82 |
| 4127 3rd Ave W | 0.03mi | 2/1.0 | 1,188 (+3%) | 11mo | $179,000 | $151 | 80 |
| 3831 3rd Ave W | 0.22mi | 2/2.0 | 1,050 (-9%) | 4mo | $200,000 | $190 | 72 |
| 423 46th St W | 0.25mi | 2/1.5 | 1,207 (+5%) | 10mo | $158,000 | $131 | 70 |
| 723 45th Street Ct W | 0.40mi | 2/2.0 | 1,092 (-5%) | 4mo | $305,000 | $279 | 69 |
| 615 48th St W | 0.42mi | 3/2.0 (+1) | 1,090 (-5%) | 4mo | $111,000 | $102 | 64 |
| 324 43rd Street Blvd W | 0.08mi | 3/2.0 (+1) | 988 (-14%) | 8mo | $295,000 | $299 | 61 |
| 3808 6th Ave W | 0.34mi | 3/2.0 (+1) | 1,246 (+8%) | 9mo | $287,800 | $231 | 58 |
| 4208 3rd Avenue Blvd E | 0.40mi | 2/2.0 | 1,320 (+15%) | 3mo | $197,000 | $149 | 54 |
| 5004 3rd Ave W | 0.50mi | 3/2.0 (+1) | 1,053 (-9%) | 5mo | $290,000 | $275 | 54 |
| 603 48th St W | 0.40mi | 3/1.0 (+1) | 987 (-14%) | 1mo | $239,000 | $242 | 48 |
Match score weights: distance 35% · size 25% · config 20% · recency 20%. Top-matched comps best support the ARV.
Projected returns pro-forma
-3.0% appreciation · 0.0% rent growth · sell at horizon
- IRR
- -12.3%
- Equity multiple
- 0.57×
- Total profit
- $-24,722
- Equity at exit
- $30,566
- IRR
- -8.6%
- Equity multiple
- 0.54×
- Total profit
- $-26,440
- Equity at exit
- $17,725
Cash invested: $57,400 (down + closing). Projections, not guarantees.
Landlord ↔ Tenant lean methodology
- Overall (STATE)
- 87 Strongly Landlord-Friendly
- State Florida
- 87 Strongly Landlord-Friendly · R+3
- County
- — inherits STATE
- City
- — inherits STATE
ZIP-level market 34221
- Rents YoY
- -3.0%
- Active inventory
- 1160
- Price-to-rent
- 8.1×
Monthly cashflow live
- Estimated rent
- $2,117 high interval (Pro) →
- Mortgage (P&I)
- −$1,075
- Tax from tax record
- −$282 /mo · $3,381/yr
- Insurance
- −$85
- HOA
- −$0
- Vacancy / Maint / Mgmt
- −$445
- Net cashflow
- $230
Break-even live
UW: 25.0% down · 7.5% · 30yr · 1.5% tax · 5.0% vac · 8.0% maint · 8.0% mgmt
Financing live
Cash to close
- Down payment
- $51,250
- Closing costs
- $6,150
- Reserves months
- —
- Total cash needed
- —
Loan-product check · same deal, 3 products live
Conventional
25% down · 7.5% · 30yr
- Down + closing
- —
- Monthly P&I
- —
- Monthly cashflow
- —
- DSCR
- —
- Eligible?
- —
Personal DTI + credit; lowest rate.
DSCR
20% down · 8.5% · 30yr
- Down + closing
- —
- Monthly P&I
- —
- Monthly cashflow
- —
- DSCR
- —
- Eligible?
- —
No personal income docs; deal must DSCR.
Hard money
10% down · 12.0% · 12mo
- Down + closing
- —
- Monthly P&I
- —
- Monthly cashflow
- —
- DSCR
- —
- Eligible?
- —
Short-term bridge; refi at stabilization.
Rent comps 12 comps
| Address | Beds | Baths | Sqft | Rent | $/sqft | DOM | Units | Dist |
|---|---|---|---|---|---|---|---|---|
| 4721 1st Ave E #4721 Palmetto, FL | 3.0 | 2.0 | 1460 | $2,000 | $1.37 | 23d | 1 | 0.34mi |
| 515 45th St E Palmetto, FL | 2.0 | 2.0 | 900 | $2,100 | $2.33 | 23d | 1 | 0.46mi |
| 709 45th St E Palmetto, FL | 2.0 | 2.0 | 1000 | $1,550 | $1.55 | 3d | 1 | 0.56mi |
| 3222 6th Ave W Palmetto, FL | 3.0 | 2.0 | 1414 | $2,185 | $1.55 | 23d | 1 | 0.79mi |
| 307 27th St E Palmetto, FL | 2.0 | 2.0 | 980 | $2,000 | $2.04 | 23d | 1 | 1.04mi |
| 2615 9th Avenue Dr E Palmetto, FL | 3.0 | 2.0 | 1369 | $2,200 | $1.61 | 23d | 1 | 1.20mi |
| 3115 Live Oak Ln #30 Palmetto, FL | 2.0 | 2.0 | 1253 | $3,695 | $2.95 | 23d | 1 | 1.23mi |
| 719 23rd St E Palmetto, FL | 3.0 | 2.0 | 1060 | $1,800 | $1.70 | 10d | 1 | 1.37mi |
| 900 21st St E Palmetto, FL | 2.0–3.0 | 1.0 | 800 | $1,495 | $1.87 | 23d | 1 | 1.42mi |
| 2211 11th Ave E Palmetto, FL | 3.0 | 2.0 | 1285 | $2,195 | $1.71 | 16d | 1 | 1.49mi |
| 1809 5th Ave W Palmetto, FL | 3.0 | 1.0 | 962 | $1,895 | $1.97 | 23d | 1 | 1.49mi |
| 2320 Terra Ceia Bay Blvd #211 Palmetto, FL | 2.0 | 2.0 | 978 | $2,500 | $2.56 | 23d | 1 | 1.49mi |
Listing history 2 events
-
2026-06-17remarks 377-char remark
-
2026-06-17$205,000 Pending
ⓘ Source: listings_history table (triggers on properties + properties_extension) + one-shot
backfill from property_details.listing_events for pre-trigger history.
Tax reassessment forecast FL · Resets to sale price
- Current annual tax
- $3,381 · $282/mo
- Projected year-2 tax
- $3,381 · $282/mo
- Expected delta
- $0/yr ($0/mo · 0.0%)
ⓘ Screening estimate from a state-policy table — verify with the county assessor before closing.
Climate risk First Street
- Flood 6/10 Major FEMA zone X (shaded) · 56% chance over 30 yrs
- Wildfire 1/10 Low
- Heat 10/10 Extreme 7 d/yr ≥107°F today · 30 d/yr by 30 yrs out
- Wind 10/10 Extreme 99% chance of damaging wind over 30 yrs
- Air quality 3/10 Moderate 2 unhealthy d/yr today · 3 by 30 yrs out
Nearby sold comps map
Loading sold comps map…
Walkable amenities ~0.75 mi
Loading nearby amenities…
Taxation est. · year 1
- Rental income
- $25,401
- − Mortgage interest
- −$11,483
- − Property taxes
- −$3,381
- − Insurance
- −$1,025
- − Repairs & maintenance
- −$2,032
- − Management
- −$2,032
- − Depreciation
- −$5,964
- Taxable loss
- −$516
- Est. tax savings @ 24.0%
- +$124
- After-tax cash flow
- $2,884/yr
For passive investors: Depreciation is non-cash, so a rental often shows a tax loss while cash-flowing — sheltering income. Rental losses are passive: they offset passive income freely, and up to $25,000/yr can offset ordinary (W-2) income if you actively participate and your MAGI is under $100k (phasing out to $0 by $150k); unused losses carry forward. On sale, claimed depreciation is recaptured at up to 25%, and gains may owe capital-gains tax (a 1031 exchange can defer both). Figures are a year-1 estimate at your 24.0% rate — not tax advice; consult a CPA.
Schools (NCES district)
- District
- Manatee
- NCES district ID
- 1201230
- Math proficiency
- 54% ▼ -6.00%
- Reading proficiency
- 50% ▼ -2.00%
- Median HH income
- $49,607
- Composite
- 44.43/100
- National rank
- #2806
- State rank
- #26 of 73 in FL
Livability — Memphis
- Score
- 63/100
- State rank
- #745
- US rank
- #16072
Category grades
Schools grade is shown separately in the Schools card above.
Census & demographics
- Census place
- Memphis, FL
- County
- Manatee County · 416,364 people
- Metro
- North Port-Sarasota-Bradenton, FL
- Population (ZIP)
- 56,208
- Household income
- $77,712
- Rent vs Own
- Severe rent burden
- 1193.0
Population outlook (Manatee County) Hauer SSP2
- Today (2025)
- 447,342 people
- By 2030
- 488,911 · +9.3%
- By 2040
- 567,934 · +27.0%
- By 2050
- 637,995 · +42.6%
- By 2075
- 781,970 · +74.8%
- By 2100
- 848,272 · +89.6%
Race, ethnicity, and origin ACS 2023
- Neighborhood character
- Diverse neighborhood (Simpson 0.58)
- Race & ethnicity
- White 59% Hispanic / Latino 22% Black 14% Two or more races 11%
- Hispanic origin (detail)
- Mexican 14% Puerto Rican 3%
- Common ancestry
- Romanian 2% Lithuanian 2% Italian 2%
- Foreign-born
- 10% · Canada, Dominican Republic, Jamaica
- Languages at home
- 81% English-only · Spanish 16% Other Indo-European 1%
Political lean MEDSL · Manatee
- 2024 margin
- Strong R (+23.5) · D 37.9% · R 61.4%
- 2008→2024 swing
- -16.5pp toward R · 2008: -7.0pp · 2024: -23.5pp
- All cycles
- 2024: R+23.5 2020: R+16.1 2016: R+17.1 2012: R+12.5 2008: R+7.0
Not yet ingested
- Civics
- —
Market trends
- HPI YoY
- ▼ -383.53%
- Current HPI
- 302.1458
- Rent YoY
- ▼ -2.98%
- Metro
- North Port-Sarasota-Bradenton, FL
- State GDP YoY
- ▲ 3.28%
- F500 in state
- 36
Industry mix (Fortune 500 HQ in FL)
| Industry | F500 HQs | Revenue |
|---|---|---|
| Industrial Technology | 2 | $29B |
|
||
| Insurance | 2 | $17B |
|
||
| Retail | 1 | $60B |
|
||
| Technology Distribution | 1 | $58B |
|
||
| Homebuilding | 1 | $35B |
|
||
| Technology Manufacturing | 1 | $35B |
|
||
Price history
+346.6% since first listed13 events — show timeline
- 2026-06-17 Listing Removed — Stellar MLS as Distributed by MLS Grid
- 2026-06-17 Listed $205,000 Stellar MLS as Distributed by MLS Grid
- 2009-11-30 Sold (Public Records) $105,000 Public Records
- 2009-11-23 Sold (MLS) $105,000 Stellar MLS as Distributed by MLS Grid
- 2009-06-22 Listed $109,900 Stellar MLS as Distributed by MLS Grid
- 2009-04-28 Listing Removed — Stellar MLS as Distributed by MLS Grid
- 2009-02-02 Listed $129,000 Stellar MLS as Distributed by MLS Grid
- 2008-08-01 Listed $130,000 Stellar MLS as Distributed by MLS Grid
- 2003-11-26 Sold (Public Records) $124,000 Public Records
- 1999-10-18 Sold (Public Records) $80,000 Public Records
- 1993-04-05 Sold (Public Records) $61,000 Public Records
- 1988-12-30 Sold (Public Records) $53,000 Public Records
- 1980-11-01 Sold (Public Records) $45,900 Public Records
Property tax history
+14.6%/yrLatest (2025): $3,381 · +376.1% YoY. Source: county tax records.
Cash-flow waterfall
monthlySold comps — $/sqft
last 12 mo · ≤1 miLoading sold comps…