 🏷️ Likely Rental
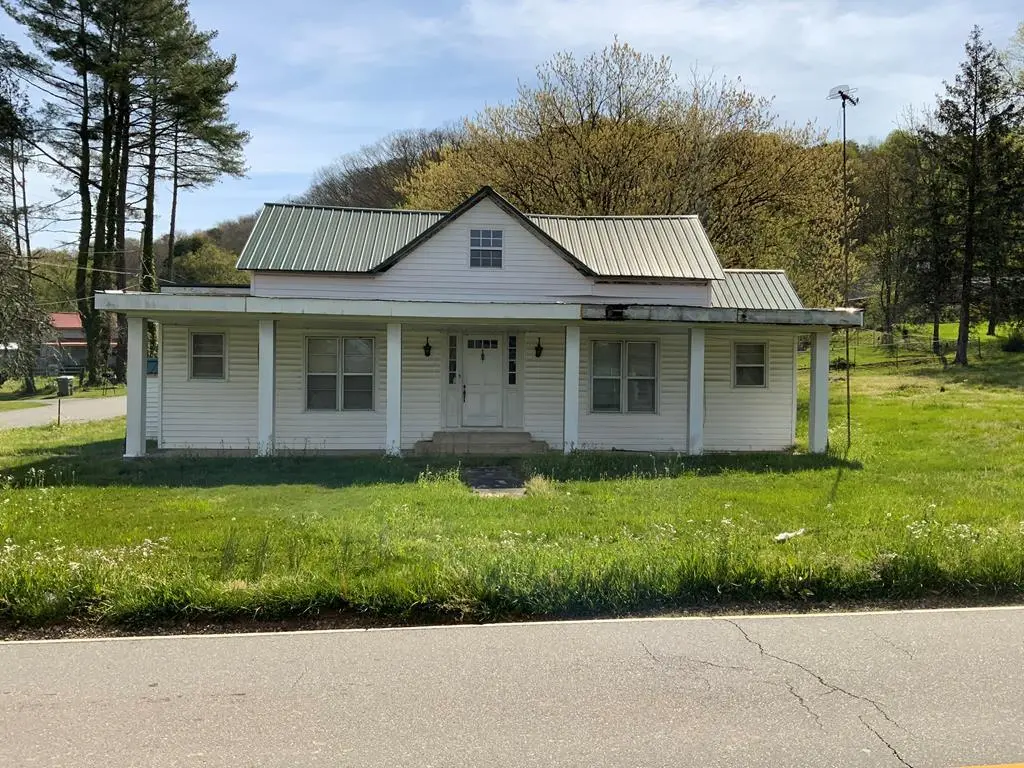
4 Boyd St · Andrews, NC
Flood risk 1/10 · Minimal
- FEMA flood zone
- X (unshaded)
- Chance of flooding over 30 yrs
- 0.0%
- Est. flood insurance / yr
- $507 – $1,088
Fire risk 4/10 · Minor
- Est. fire insurance / yr
- $906 – $1,684
Heat risk 4/10 · Minor
- Hot days now (above 98°F)
- 8 days/yr
- Hot days in 30 yrs
- 23 days/yr
Wind risk 2/10 · Minimal
- Chance of severe wind over 30 yrs
- —
Air-quality risk 4/10 · Minor
- Unhealthy air days now
- 5 days/yr
- Unhealthy air days in 30 yrs
- 5 days/yr
Risk factors via First Street. Map © Google.
Why this score? — see what drove the B- grade
The composite is a weighted blend of 9 inputs, each scored 0–100. Each bar is that input's sub-score; the figure is the points it added to the 100-point composite (weight × sub-score).
- Cash flow +30.0/30.0
- 1% rule +10.0/10.0
- DSCR +10.0/10.0
- ARV discount +7.5/15.0
- Schools +3.7/10.0
- Livability +3.4/5.0
- Rent growth +2.5/5.0
- Condition / age +2.5/5.0
- Appreciation +0.0/10.0
$95,500
🖨 Deal sheet 📄 Offer letter ✓ Due diligence
Listing remarks
Step back into charm with this delightful 1930s handyman special, perfectly positioned in the heart of Andrews at the intersection of three picturesque streets. Boasting beautiful mountain views and a good-sized backyard complete with a storage shed, this vintage dollhouse is brimming with character and untapped potential. Yes, it needs some work and tender loving care —but for the right visionary who can imagineer a dazzling new future, this is the ideal time to claim it. Don't miss your chance to transform this hidden treasure into something truly one-of-a-kind. Come see it today and let your creativity run wild! * * * THIS HOUSE IS NOT FOR RENT * * *
Key facts
- Storage shed
- Good-sized backyard
- Mountain views
Tags
Property features AI
Finance
- Other: Lot approximately 0.29 acres; Zoned for single-family use; Directions: From Main Street in Andrews, turn onto Locust Street. House is located at the intersection of Locust Street, Bristol Avenue and Boyd Street on the left.
Exterior
- Utilities: Public water; Public sewer
- Home design: Single-family residence; Single-story
- Construction: Frame construction; Vinyl siding
- Exterior features: Metal roof
Interior
- Flooring: Vinyl flooring; Wood flooring
- Bathrooms: 2 full bathrooms
- Interior features: Electric water heater; Crawl space foundation/access
- Laundry & utility: Dedicated laundry room
Neighborhood map
What this means for you Summary
Snapshot
- This is a 2-bed/2.0-bath single-family listed at $96k.
Deal economics
- At list price, monthly cash flow is $594 ($7k/yr) — positive.
- The deal already cash-flows at list — no discount required.
- Meets the 1% rule at list price ($1k rent vs $96k).
- Recommended offer: $90k (6.0% below list) — sets the bar for market timing.
- Cap rate 13.8% vs local median 3.0% in Andrews — top-decile yield for the area; either an underpriced asset or a hidden risk that comps aren't pricing in. Stress-test before assuming the spread holds.
Location & tenants
- Location reads 68/100 on livability (#201 in NC) — a middle-class / working-renter tenant base. Strengths: cost of living A+, housing A+, crime A-; Watch: health & safety C-, schools D, amenities F.
- Cherokee County Schools (rural): math 42% / reading 47% proficiency, ranked #90 of 178 in NC (top 51%) — families likely to look elsewhere, expect single-tenant / working-renter base with shorter leases.
- Market conditions: 111 active listings in the ZIP; 232 units permitted in Cherokee County in 2024 (0 in 5+ unit buildings).
Forward outlook
- Local home prices are declining (-3.0%/yr); year-one equity from $660 of loan paydown is wiped out by about $3k of value loss. Plan a longer hold.
- Cherokee County population projected at -24% by 2050 — secular population decline; favor cash flow + early exit over multi-decade hold.
- At projected returns (-3.0% appreciation + 3.0% rent growth), your $27k cash investment doubles in ~5 years — after that, you're playing with house money.
Negotiation context
- It's been on market 71 days — a 6% lower offer ($90k) is reasonable based on typical stale-listing flexibility.
- Current owner paid $50k; list at $96k implies a 91% gain — meaningful room to come down on a strong offer.
Risks & watch-outs
- Watch-outs: built in 1930 — expect roof / HVAC / electrical / plumbing capex.
Questions for the listing agent
- It's been on market 71 days. Have you received any prior offers? Is the seller open to a 6% concession, seller financing, or rate buy-down credit?
- Built in 1930 — when were the roof, HVAC, electrical panel, plumbing, and water heater last replaced?
- Why hasn't it sold? Are there any deal-killer items the seller is aware of (foundation, flood, title, zoning, code violations)?
- Is there a deadline driving the sale (1031 exchange, divorce, estate, relocation)? That informs how much negotiation room exists.
- Schools are D-rated, which usually means shorter tenancies and higher turnover. Who's the typical renter profile here, and what's been the actual vacancy rate?
- What's the average days-on-market for RENTAL listings here right now (not sales)? A rising rental-DOM trend means longer vacancies and softer asking-rent achievability than the comps imply.
- What's the recent tenant-quality profile in this submarket — average credit score on applications, eviction rate, late-payment / NSF rate, and stable-employment percentage? A property-management company in the area should have these aggregated.
- How much new for-sale + rental construction is in the pipeline within 1–3 miles? Heavy new supply typically softens prices + rents 12–24 months out; constrained supply supports both.
Investment metrics
- 1% rule
- 1.55% ✓
- Cap rate
- 13.75%
- Cash-on-cash
- 26.65%
- DSCR
- 2.19
- GRM
- 5.4
CMA / ARV
- ARV (on-the-fly)
- $264,992
- Comps found
- 8
Show comp detail 8 sales within ~0.75 mi
| Address | Dist | Beds/Ba | Sqft | Sold | Price | $/sf | Match |
|---|---|---|---|---|---|---|---|
| 106 Wells St | 0.12mi | 3/2.0 (+1) | 1,574 (+0%) | 22mo | $380,000 | $241 | 70 |
| 45 Boyd St | 0.05mi | 1/1.0 (-1) | 1,462 (-7%) | 10mo | $167,500 | $115 | 69 |
| 24 Wells St | 0.07mi | 2/3.0 | 1,713 (+9%) | 16mo | $289,200 | $169 | 64 |
| 208 Bristol Ave | 0.07mi | 3/2.0 (+1) | 1,380 (-12%) | 16mo | $255,000 | $185 | 59 |
| 308 Connaheta Ave | 0.52mi | 2/1.0 | 1,488 (-5%) | 18mo | $97,000 | $65 | 48 |
| 68 Stecoah Ave | 0.60mi | 3/2.0 (+1) | 1,488 (-5%) | 15mo | $172,000 | $116 | 46 |
| 150 Aquone Rd | 0.20mi | 3/1.0 (+1) | 1,374 (-12%) | 18mo | $290,000 | $211 | 46 |
| 150 Connaheta Ave | 0.46mi | 3/2.0 (+1) | 1,344 (-14%) | 14mo | $207,000 | $154 | 38 |
Match score weights: distance 35% · size 25% · config 20% · recency 20%. Top-matched comps best support the ARV.
Projected returns pro-forma
-3.0% appreciation · 3.0% rent growth · sell at horizon
- IRR
- 20.5%
- Equity multiple
- 1.83×
- Total profit
- $22,312
- Equity at exit
- $14,239
- IRR
- 28.7%
- Equity multiple
- 3.54×
- Total profit
- $68,006
- Equity at exit
- $8,257
Cash invested: $26,740 (down + closing). Projections, not guarantees.
Landlord ↔ Tenant lean methodology
- Overall (STATE)
- 85 Strongly Landlord-Friendly
- State North Carolina
- 85 Strongly Landlord-Friendly · R+3
- County
- — inherits STATE
- City
- — inherits STATE
ZIP-level market 28901
- Home prices YoY
- -11.7%
- Active inventory
- 111
- Price-to-rent
- 5.4×
Monthly cashflow live
- Estimated rent
- $1,481 medium interval (Pro) →
- Mortgage (P&I)
- −$501
- Tax from tax record
- −$36 /mo · $431/yr
- Insurance
- −$40
- HOA
- −$0
- Vacancy / Maint / Mgmt
- −$311
- Net cashflow
- $594
Break-even live
UW: 25.0% down · 7.5% · 30yr · 1.5% tax · 5.0% vac · 8.0% maint · 8.0% mgmt
Financing live
Cash to close
- Down payment
- $23,875
- Closing costs
- $2,865
- Reserves months
- —
- Total cash needed
- —
Loan-product check · same deal, 3 products live
Conventional
25% down · 7.5% · 30yr
- Down + closing
- —
- Monthly P&I
- —
- Monthly cashflow
- —
- DSCR
- —
- Eligible?
- —
Personal DTI + credit; lowest rate.
DSCR
20% down · 8.5% · 30yr
- Down + closing
- —
- Monthly P&I
- —
- Monthly cashflow
- —
- DSCR
- —
- Eligible?
- —
No personal income docs; deal must DSCR.
Hard money
10% down · 12.0% · 12mo
- Down + closing
- —
- Monthly P&I
- —
- Monthly cashflow
- —
- DSCR
- —
- Eligible?
- —
Short-term bridge; refi at stabilization.
Listing history 17 events
-
2026-06-18days on market $95,500 Active 71 DOM
-
2026-06-17days on market $95,500 Active 70 DOM
-
2026-06-16days on market $95,500 Active 69 DOM
-
2026-06-15days on market $95,500 Active 68 DOM
-
2026-06-13days on market $95,500 Active 66 DOM
-
2026-06-12days on market $95,500 Active 65 DOM
-
2026-06-09days on market $95,500 Active 62 DOM
-
2026-06-08days on market $95,500 Active 61 DOM
-
2026-06-07days on market $95,500 Active 60 DOM
-
2026-06-07days on market $95,500 Active 59 DOM
-
2026-06-04days on market $95,500 Active 2 DOM
-
2026-06-01days on market $95,500 Active 1 DOM
-
2026-06-01days on market $95,500 Active 54 DOM
-
2026-05-31days on market $95,500 Active 53 DOM
-
2026-04-08$95,500 Active
-
2026-03-12soldstatus $50,000
-
1990-08-01soldstatus $13,250,000
ⓘ Source: listings_history table (triggers on properties + properties_extension) + one-shot
backfill from property_details.listing_events for pre-trigger history.
Tax reassessment forecast NC · Resets to sale price
- Current annual tax
- $431 · $36/mo
- Projected year-2 tax
- $783 · $65/mo
- Expected delta
- +$352/yr (+$29/mo · 81.5%)
ⓘ Screening estimate from a state-policy table — verify with the county assessor before closing.
Climate risk First Street
- Flood 1/10 Low FEMA zone X (unshaded) · 0% chance over 30 yrs
- Wildfire 4/10 Moderate
- Heat 4/10 Moderate 8 d/yr ≥98°F today · 23 d/yr by 30 yrs out
- Wind 2/10 Low
- Air quality 4/10 Moderate 5 unhealthy d/yr today · 5 by 30 yrs out
Nearby sold comps map
Loading sold comps map…
Walkable amenities ~0.75 mi
Loading nearby amenities…
Taxation est. · year 1
- Rental income
- $17,777
- − Mortgage interest
- −$5,349
- − Property taxes
- −$431
- − Insurance
- −$478
- − Repairs & maintenance
- −$1,422
- − Management
- −$1,422
- − Depreciation
- −$2,778
- Taxable income
- $5,896
- Est. tax owed @ 24.0%
- −$1,415
- After-tax cash flow
- $5,710/yr
For passive investors: Depreciation is non-cash, so a rental often shows a tax loss while cash-flowing — sheltering income. Rental losses are passive: they offset passive income freely, and up to $25,000/yr can offset ordinary (W-2) income if you actively participate and your MAGI is under $100k (phasing out to $0 by $150k); unused losses carry forward. On sale, claimed depreciation is recaptured at up to 25%, and gains may owe capital-gains tax (a 1031 exchange can defer both). Figures are a year-1 estimate at your 24.0% rate — not tax advice; consult a CPA.
Schools (NCES district)
- District
- Cherokee County Schools
- NCES district ID
- 3700780
- Math proficiency
- 42% ▲ 1.00%
- Reading proficiency
- 47% ▼ -2.00%
- Median HH income
- $36,424
- Composite
- 36.91/100
- National rank
- #4542
- State rank
- #90 of 178 in NC
Livability — Andrews
- Score
- 68/100
- State rank
- #201
- US rank
- #9804
Category grades
Schools grade is shown separately in the Schools card above.
Census & demographics
- Census place
- Andrews, NC
- Population (ZIP)
- 5,624
Population outlook (Cherokee County) Hauer SSP2
- Today (2025)
- 25,672 people
- By 2030
- 24,504 · -4.5%
- By 2040
- 21,955 · -14.5%
- By 2050
- 19,592 · -23.7%
- By 2075
- 15,128 · -41.1%
- By 2100
- 11,203 · -56.4%
Race, ethnicity, and origin ACS 2023
- Neighborhood character
- Predominantly White (86%)
- Race & ethnicity
- White 86% Two or more races 5% Native American 4% Hispanic / Latino 4% Black 4%
- Common ancestry
- Lithuanian 3% Slovak 2% Estonian 1%
- Foreign-born
- 4% · Canada
- Languages at home
- 95% English-only · Spanish 4%
Political lean MEDSL · Cherokee
- 2024 margin
- Solid R (+57.5) · D 20.8% · R 78.2% · Other 1.0%
- 2008→2024 swing
- -18.9pp toward R · 2008: -38.6pp · 2024: -57.5pp
- All cycles
- 2024: R+57.5 2020: R+55.1 2016: R+57.0 2012: R+46.2 2008: R+38.6
Not yet ingested
- Civics
- —
Market trends
- HPI YoY
- ▼ -25.74%
- Current HPI
- 193.5561
- Rent YoY
- —
- Metro
- —
- State GDP YoY
- ▲ 3.28%
- F500 in state
- 26
Industry mix (Fortune 500 HQ in NC)
| Industry | F500 HQs | Revenue |
|---|---|---|
| Financial Services | 2 | $213B |
|
||
| Retail | 2 | $95B |
|
||
| Industrial Conglomerate | 1 | $38B |
|
||
| Metals / Steel | 1 | $35B |
|
||
| Utilities | 1 | $30B |
|
||
| Industrial Machinery | 1 | $19B |
|
||
Price history
-99.3% since first listed3 events — show timeline
- 2026-04-08 Listed $95,500 MLBOR
- 2026-03-12 Sold (Public Records) $50,000 Public Records
- 1990-08-01 Sold (Public Records) $13,250,000 Public Records
Property tax history
+1.4%/yrLatest (2025): $431 · +2.4% YoY. Source: county tax records.
Cash-flow waterfall
monthlySold comps — $/sqft
last 12 mo · ≤1 miLoading sold comps…