 🏷️ Likely Rental
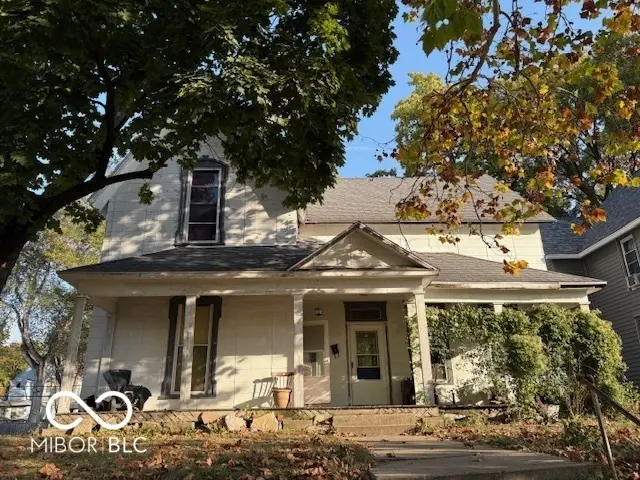
702 W 6th St · Marion, IN
Flood risk 1/10 · Minimal
- FEMA flood zone
- X (unshaded)
- Chance of flooding over 30 yrs
- 0.0%
- Est. flood insurance / yr
- $507 – $1,088
Fire risk 1/10 · Minimal
- Est. fire insurance / yr
- $717 – $1,331
Heat risk 3/10 · Minor
- Hot days now (above 100°F)
- 7 days/yr
- Hot days in 30 yrs
- 18 days/yr
Wind risk 2/10 · Minimal
- Chance of severe wind over 30 yrs
- —
Air-quality risk 2/10 · Minimal
- Unhealthy air days now
- 1 days/yr
- Unhealthy air days in 30 yrs
- 3 days/yr
Risk factors via First Street. Map © Google.
Why this score? — see what drove the D+ grade
The composite is a weighted blend of 9 inputs, each scored 0–100. Each bar is that input's sub-score; the figure is the points it added to the 100-point composite (weight × sub-score).
- Cash flow +15.0/30.0
- ARV discount +15.0/15.0
- 1% rule +5.0/10.0
- DSCR +5.0/10.0
- Livability +3.2/5.0
- Rent growth +2.5/5.0
- Condition / age +2.5/5.0
- Schools +1.7/10.0
- Appreciation +0.0/10.0
$61,900
🖨 Deal sheet 📄 Offer letter ✓ Due diligence
Multi-family units
County records classify this as Multi-Family (2-4 Unit). Listing-text estimate: 2 units. confirmed
Listing remarks MLS
Add this duplex to your portfolio today! Apt A rents for $575 a month, $575 deposit, and is month to month. Apt A has 2 beds and 1.5 Baths. Apt B rents for $550 a month, $550 deposit, and is month to month. Apt B has 2 bedrooms and 1 bath. Owner pays water and trash. Separated electric and gas meters. Each unit has access to a shared laundry area that is in the middle of the 2 units. Don't miss out on this opportunity!
Key facts
- 5,808 sq ft lot
- Built 1939
- Listed 241 days
Neighborhood map
What this means for you Summary
Snapshot
- This is a 1×2.0bd/1.5ba + 1×2.0bd/1.0ba units multifamily listed at $62k.
Deal economics
- At list price, monthly cash flow is $2k ($20k/yr) — positive. Per door: $846/mo.
- The deal already cash-flows at list — no discount required.
- Meets the 1% rule at list price ($3k rent vs $62k).
- Recommended offer: $54k (12.0% below list) — sets the bar for market timing.
- Cap rate 39.1% vs local median 8.7% in Marion — top-decile yield for the area; either an underpriced asset or a hidden risk that comps aren't pricing in. Stress-test before assuming the spread holds.
Location & tenants
- Location reads 65/100 on livability (#337 in IN) — a middle-class / working-renter tenant base. Strengths: crime A+, cost of living A+, housing A+; Watch: schools F, amenities F, commute F.
- Marion Community Schools (town): math 18% / reading 24% proficiency, ranked #277 of 301 in IN (top 92%) — low school quality limits family demand, transient renter base, plan for 1-2y turnover; 67% free/reduced lunch — lower-income household profile, screen leases tightly.
- Market conditions: 112 active listings in the ZIP; 52 units permitted in Grant County in 2024 (8 in 5+ unit buildings).
- At $2,726/mo this rent would consume 71% of the median local household income ($46k/yr) (locally 597% of renters already pay >50% of income on rent) — very limited rent-growth headroom before tenants either downsize or default.
Forward outlook
- Local home prices are declining (-3.0%/yr); year-one equity from $428 of loan paydown is wiped out by about $2k of value loss. Plan a longer hold.
- Grant County population projected at -18% by 2050 — secular population decline; favor cash flow + early exit over multi-decade hold.
- At projected returns (-3.0% appreciation + 3.0% rent growth), your $17k cash investment doubles in ~1 year — after that, you're playing with house money.
Negotiation context
- It's been on market 242 days — a 12% lower offer ($54k) is reasonable based on typical stale-listing flexibility.
- 3 sale attempts since 7y ago; this cycle's ask has dropped $13k (17%) from the opening price — seller is motivated, your offer sets the floor, not the list.
- Current owner paid $44k; 42% above their basis — modest negotiation headroom, anchor on the comps not their cost.
Risks & watch-outs
- Watch-outs: built in 1939 — expect roof / HVAC / electrical / plumbing capex.
Questions for the listing agent
- It's been on market 242 days. Have you received any prior offers? Is the seller open to a 12% concession, seller financing, or rate buy-down credit?
- Can we see the unit-by-unit rent roll, current vacancy, and any below-market leases? What's the average tenancy length?
- What capital expenditures (roof, boiler, parking lot, exteriors) have been made in the last 5 years, and what's planned in the next 2?
- Built in 1939 — when were the roof, HVAC, electrical panel, plumbing, and water heater last replaced?
- Why hasn't it sold? Are there any deal-killer items the seller is aware of (foundation, flood, title, zoning, code violations)?
- Is there a deadline driving the sale (1031 exchange, divorce, estate, relocation)? That informs how much negotiation room exists.
- Schools are F-rated, which usually means shorter tenancies and higher turnover. Who's the typical renter profile here, and what's been the actual vacancy rate?
- The area grade is low — what's the realistic commute time and amenity access for the typical tenant pool here? Any planned neighborhood developments (good or bad) we should know about?
- What's the average days-on-market for RENTAL listings here right now (not sales)? A rising rental-DOM trend means longer vacancies and softer asking-rent achievability than the comps imply.
- What's the recent tenant-quality profile in this submarket — average credit score on applications, eviction rate, late-payment / NSF rate, and stable-employment percentage? A property-management company in the area should have these aggregated.
- How much new apartment / multifamily construction is in the pipeline within 1–3 miles? Heavy new supply (>2% of stock underway) typically softens rents 12–24 months out; light construction supports rent growth.
Investment metrics
- 1% rule
- 4.40% ✓
- Cap rate
- 39.08%
- Cash-on-cash
- 117.09%
- DSCR
- 6.21
- GRM
- 1.9
CMA / ARV
- ARV (median comp)
- $114,561
- List price
- $61,900
- Delta
- -45.97%
- Verdict
- UNDERPRICED
- Comps
- 20 within 1.0 mi
Show comp detail 4 sales within ~0.75 mi
| Address | Dist | Beds/Ba | Sqft | Sold | Price | $/sf | Match |
|---|---|---|---|---|---|---|---|
| 823 W 6th St | 0.11mi | 4/3.0 | 2,616 (-14%) | 1mo | $85,000 | $32 | 66 |
| 715 W 6th St | 0.04mi | 4/4.0 | 2,652 (-13%) | 14mo | $155,000 | $58 | 57 |
| 1005 W Spencer Ave | 0.48mi | 5/2.0 (+1) | 3,248 (+6%) | 8mo | $175,000 | $54 | 56 |
| 1520 W 4th St | 0.60mi | 5/3.0 (+1) | 2,708 (-11%) | 12mo | $115,000 | $42 | 34 |
Match score weights: distance 35% · size 25% · config 20% · recency 20%. Top-matched comps best support the ARV.
Projected returns pro-forma
-3.0% appreciation · 3.0% rent growth · sell at horizon
- IRR
- —
- Equity multiple
- 6.64×
- Total profit
- $97,741
- Equity at exit
- $9,229
- IRR
- —
- Equity multiple
- 13.93×
- Total profit
- $224,058
- Equity at exit
- $5,352
Cash invested: $17,332 (down + closing). Projections, not guarantees.
Landlord ↔ Tenant lean methodology
- Overall (STATE)
- 90 Strongly Landlord-Friendly
- State Indiana
- 90 Strongly Landlord-Friendly · R+11
- County
- — inherits STATE
- City
- — inherits STATE
ZIP-level market 46953
- Home prices YoY
- -23.4%
- Active inventory
- 112
- Price-to-rent
- 3.8×
Monthly cashflow live
- Estimated rent
- $2,726 medium interval (Pro) →
- Mortgage (P&I)
- −$325
- Tax from tax record
- −$112 /mo · $1,344/yr
- Insurance
- −$26
- HOA
- −$0
- Vacancy / Maint / Mgmt
- −$572
- Net cashflow
- $1,691
Break-even live
2-unit breakdown (identical units grouped — click to expand)
| Units | Beds | Baths | Est. rent |
|---|---|---|---|
| 1× unit | 2.0 | 1.5 | $1,363 |
| 1× unit | 2.0 | 1 | $1,363 |
| Total (2 units) | $2,726 | ||
UW: 25.0% down · 7.5% · 30yr · 1.5% tax · 5.0% vac · 8.0% maint · 8.0% mgmt
Financing live
Cash to close
- Down payment
- $15,475
- Closing costs
- $1,857
- Reserves months
- —
- Total cash needed
- —
Loan-product check · same deal, 3 products live
Conventional
25% down · 7.5% · 30yr
- Down + closing
- —
- Monthly P&I
- —
- Monthly cashflow
- —
- DSCR
- —
- Eligible?
- —
Personal DTI + credit; lowest rate.
DSCR
20% down · 8.5% · 30yr
- Down + closing
- —
- Monthly P&I
- —
- Monthly cashflow
- —
- DSCR
- —
- Eligible?
- —
No personal income docs; deal must DSCR.
Hard money
10% down · 12.0% · 12mo
- Down + closing
- —
- Monthly P&I
- —
- Monthly cashflow
- —
- DSCR
- —
- Eligible?
- —
Short-term bridge; refi at stabilization.
Listing history 26 events
-
2026-06-19days on market $61,900 Active 242 DOM
-
2026-06-18days on market $61,900 Active 241 DOM
-
2026-06-17days on market $61,900 Active 240 DOM
-
2026-06-16days on market $61,900 Active 239 DOM
-
2026-06-15days on market $61,900 Active 238 DOM
-
2026-06-14days on market $61,900 Active 236 DOM
-
2026-06-12days on market $61,900 Active 235 DOM
-
2026-06-09days on market $61,900 Active 232 DOM
-
2026-06-08days on market $61,900 Active 231 DOM
-
2026-06-07days on market $61,900 Active 230 DOM
-
2026-06-02days on market $61,900 Active 225 DOM
-
2026-06-01days on market $61,900 Active 224 DOM
-
2026-05-31days on market $61,900 Active 223 DOM
-
2026-05-30days on market $61,900 Active 222 DOM
-
2026-04-09price $62,900 427-char remark
Show marketing remark (422 chars)
Add this duplex to your portfolio today! Apt A rents for $575 a month, $575 deposit, and is month to month. Apt A has 2 beds and 1.5 Baths. Apt B rents for $550 a month, $550 deposit, and is month to month. Apt B has 2 bedrooms and 1 bath. Owner pays water and trash. Separated electric and gas meters. Each unit has access to a shared laundry area that is in the middle of the 2 units. Don't miss out on this opportunity!
-
2026-04-09price $62,900 422-char remark
Show marketing remark (422 chars)
Add this duplex to your portfolio today! Apt A rents for $575 a month, $575 deposit, and is month to month. Apt A has 2 beds and 1.5 Baths. Apt B rents for $550 a month, $550 deposit, and is month to month. Apt B has 2 bedrooms and 1 bath. Owner pays water and trash. Separated electric and gas meters. Each unit has access to a shared laundry area that is in the middle of the 2 units. Don't miss out on this opportunity!
-
2026-04-03price $63,900 427-char remark
Show marketing remark (422 chars)
Add this duplex to your portfolio today! Apt A rents for $575 a month, $575 deposit, and is month to month. Apt A has 2 beds and 1.5 Baths. Apt B rents for $550 a month, $550 deposit, and is month to month. Apt B has 2 bedrooms and 1 bath. Owner pays water and trash. Separated electric and gas meters. Each unit has access to a shared laundry area that is in the middle of the 2 units. Don't miss out on this opportunity!
-
2026-04-03price $63,900 422-char remark
Show marketing remark (422 chars)
Add this duplex to your portfolio today! Apt A rents for $575 a month, $575 deposit, and is month to month. Apt A has 2 beds and 1.5 Baths. Apt B rents for $550 a month, $550 deposit, and is month to month. Apt B has 2 bedrooms and 1 bath. Owner pays water and trash. Separated electric and gas meters. Each unit has access to a shared laundry area that is in the middle of the 2 units. Don't miss out on this opportunity!
-
2026-02-10price $64,900 427-char remark
Show marketing remark (422 chars)
Add this duplex to your portfolio today! Apt A rents for $575 a month, $575 deposit, and is month to month. Apt A has 2 beds and 1.5 Baths. Apt B rents for $550 a month, $550 deposit, and is month to month. Apt B has 2 bedrooms and 1 bath. Owner pays water and trash. Separated electric and gas meters. Each unit has access to a shared laundry area that is in the middle of the 2 units. Don't miss out on this opportunity!
-
2026-02-10price $64,900 422-char remark
Show marketing remark (422 chars)
Add this duplex to your portfolio today! Apt A rents for $575 a month, $575 deposit, and is month to month. Apt A has 2 beds and 1.5 Baths. Apt B rents for $550 a month, $550 deposit, and is month to month. Apt B has 2 bedrooms and 1 bath. Owner pays water and trash. Separated electric and gas meters. Each unit has access to a shared laundry area that is in the middle of the 2 units. Don't miss out on this opportunity!
-
2025-12-01price $69,900 427-char remark
Show marketing remark (422 chars)
Add this duplex to your portfolio today! Apt A rents for $575 a month, $575 deposit, and is month to month. Apt A has 2 beds and 1.5 Baths. Apt B rents for $550 a month, $550 deposit, and is month to month. Apt B has 2 bedrooms and 1 bath. Owner pays water and trash. Separated electric and gas meters. Each unit has access to a shared laundry area that is in the middle of the 2 units. Don't miss out on this opportunity!
-
2025-12-01price $69,900 422-char remark
Show marketing remark (422 chars)
Add this duplex to your portfolio today! Apt A rents for $575 a month, $575 deposit, and is month to month. Apt A has 2 beds and 1.5 Baths. Apt B rents for $550 a month, $550 deposit, and is month to month. Apt B has 2 bedrooms and 1 bath. Owner pays water and trash. Separated electric and gas meters. Each unit has access to a shared laundry area that is in the middle of the 2 units. Don't miss out on this opportunity!
-
2025-10-20$74,900 Active 427-char remark
Show marketing remark (422 chars)
Add this duplex to your portfolio today! Apt A rents for $575 a month, $575 deposit, and is month to month. Apt A has 2 beds and 1.5 Baths. Apt B rents for $550 a month, $550 deposit, and is month to month. Apt B has 2 bedrooms and 1 bath. Owner pays water and trash. Separated electric and gas meters. Each unit has access to a shared laundry area that is in the middle of the 2 units. Don't miss out on this opportunity!
-
2025-10-20$74,900 Active 422-char remark
Show marketing remark (422 chars)
Add this duplex to your portfolio today! Apt A rents for $575 a month, $575 deposit, and is month to month. Apt A has 2 beds and 1.5 Baths. Apt B rents for $550 a month, $550 deposit, and is month to month. Apt B has 2 bedrooms and 1 bath. Owner pays water and trash. Separated electric and gas meters. Each unit has access to a shared laundry area that is in the middle of the 2 units. Don't miss out on this opportunity!
-
2020-04-17soldstatus $43,500
-
2019-08-03$45,400
ⓘ Source: listings_history table (triggers on properties + properties_extension) + one-shot
backfill from property_details.listing_events for pre-trigger history.
Tax reassessment forecast IN · Partial reset (capped growth)
- Current annual tax
- $1,344 · $112/mo
- Projected year-2 tax
- $1,344 · $112/mo
- Expected delta
- $0/yr ($0/mo · 0.0%)
ⓘ Screening estimate from a state-policy table — verify with the county assessor before closing.
Climate risk First Street
- Flood 1/10 Low FEMA zone X (unshaded) · 0% chance over 30 yrs
- Wildfire 1/10 Low
- Heat 3/10 Moderate 7 d/yr ≥100°F today · 18 d/yr by 30 yrs out
- Wind 2/10 Low
- Air quality 2/10 Low 1 unhealthy d/yr today · 3 by 30 yrs out
Nearby sold comps map
Loading sold comps map…
Walkable amenities ~0.75 mi
Loading nearby amenities…
Taxation est. · year 1
- Rental income
- $32,712
- − Mortgage interest
- −$3,467
- − Property taxes
- −$1,344
- − Insurance
- −$310
- − Repairs & maintenance
- −$2,617
- − Management
- −$2,617
- − Depreciation
- −$1,801
- Taxable income
- $20,556
- Est. tax owed @ 24.0%
- −$4,934
- After-tax cash flow
- $15,360/yr
For passive investors: Depreciation is non-cash, so a rental often shows a tax loss while cash-flowing — sheltering income. Rental losses are passive: they offset passive income freely, and up to $25,000/yr can offset ordinary (W-2) income if you actively participate and your MAGI is under $100k (phasing out to $0 by $150k); unused losses carry forward. On sale, claimed depreciation is recaptured at up to 25%, and gains may owe capital-gains tax (a 1031 exchange can defer both). Figures are a year-1 estimate at your 24.0% rate — not tax advice; consult a CPA.
Schools (NCES district)
- District
- Marion Community Schools
- NCES district ID
- 1806390
- Math proficiency
- 18% ▼ -9.00%
- Reading proficiency
- 24% ▼ -6.00%
- Median HH income
- $33,415
- Composite
- 17.13/100
- National rank
- #9115
- State rank
- #277 of 301 in IN
Livability — Marion
- Score
- 65/100
- State rank
- #337
- US rank
- #13006
Category grades
Schools grade is shown separately in the Schools card above.
Census & demographics
- Census place
- Marion, IN
- County
- Grant County · 41,561 people
- City population
- 41,561
- Metro
- Marion, IN
- Population (ZIP)
- 23,372
- Household income
- $46,288
- Rent vs Own
- Severe rent burden
- 597.0
Population outlook (Grant County) Hauer SSP2
- Today (2025)
- 64,394 people
- By 2030
- 62,145 · -3.5%
- By 2040
- 57,252 · -11.1%
- By 2050
- 52,968 · -17.7%
- By 2075
- 45,986 · -28.6%
- By 2100
- 39,400 · -38.8%
Race, ethnicity, and origin ACS 2023
- Neighborhood character
- Predominantly White (77%)
- Race & ethnicity
- White 77% Black 10% Two or more races 9% Hispanic / Latino 6%
- Hispanic origin (detail)
- Mexican 4%
- Common ancestry
- Italian 3% Iranian 1% Slovak 1%
- Foreign-born
- 2% · Canada
- Languages at home
- 96% English-only · Spanish 3%
Political lean MEDSL · Grant
- 2024 margin
- Solid R (+41.8) · D 28.2% · R 70.0% · Other 1.9%
- 2008→2024 swing
- -28.7pp toward R · 2008: -13.1pp · 2024: -41.8pp
- All cycles
- 2024: R+41.8 2020: R+38.8 2016: R+39.5 2012: R+22.0 2008: R+13.1
Not yet ingested
- Civics
- —
Market trends
- HPI YoY
- ▼ -52.47%
- Current HPI
- 171.7246
- Rent YoY
- —
- Metro
- Marion, IN
- State GDP YoY
- ▲ 2.90%
- F500 in state
- 18
Industry mix (Fortune 500 HQ in IN)
| Industry | F500 HQs | Revenue |
|---|---|---|
| Industrial Machinery | 2 | $37B |
|
||
| Healthcare | 1 | $177B |
|
||
| Pharmaceuticals | 1 | $45B |
|
||
| Metals / Steel | 1 | $18B |
|
||
| Agriculture | 1 | $17B |
|
||
| Packaging | 1 | $12B |
|
||
Price history
+38.5% since first listed12 events — show timeline
- 2026-04-09 Price Changed $62,900 IRMLS
- 2026-04-09 Price Changed $62,900 MIBOR as Distributed by MLS Grid
- 2026-04-03 Price Changed $63,900 IRMLS
- 2026-04-03 Price Changed $63,900 MIBOR as Distributed by MLS Grid
- 2026-02-10 Price Changed $64,900 IRMLS
- 2026-02-10 Price Changed $64,900 MIBOR as Distributed by MLS Grid
- 2025-12-01 Price Changed $69,900 IRMLS
- 2025-12-01 Price Changed $69,900 MIBOR as Distributed by MLS Grid
- 2025-10-20 Listed $74,900 IRMLS
- 2025-10-20 Listed $74,900 MIBOR as Distributed by MLS Grid
- 2020-04-17 Sold (MLS) $43,500 IRMLS
- 2019-08-03 Listed $45,400 IRMLS
Property tax history
-3.3%/yrLatest (2025): $1,344 · -2.3% YoY. Source: county tax records.
Cash-flow waterfall
monthlySold comps — $/sqft
last 12 mo · ≤1 miLoading sold comps…