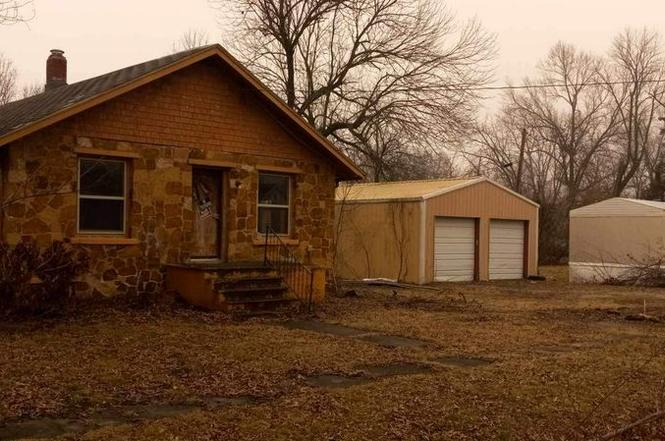
1105 Hicks Ave · Golden City, MO
Flood risk 1/10 · Minimal
- FEMA flood zone
- X (unshaded)
- Chance of flooding over 30 yrs
- 0.0%
- Est. flood insurance / yr
- $473 – $860
Fire risk 1/10 · Minimal
- Est. fire insurance / yr
- $1,054 – $1,958
Heat risk 5/10 · Moderate
- Hot days now (above 107°F)
- 7 days/yr
- Hot days in 30 yrs
- 19 days/yr
Wind risk 2/10 · Minimal
- Chance of severe wind over 30 yrs
- 2.0%
Air-quality risk 2/10 · Minimal
- Unhealthy air days now
- 1 days/yr
- Unhealthy air days in 30 yrs
- 1 days/yr
Risk factors via First Street. Map © Google.
Why this score? — see what drove the B+ grade
The composite is a weighted blend of 9 inputs, each scored 0–100. Each bar is that input's sub-score; the figure is the points it added to the 100-point composite (weight × sub-score).
- Cash flow +30.0/30.0
- DSCR +10.0/10.0
- Appreciation +9.2/10.0
- 1% rule +8.1/10.0
- ARV discount +7.5/15.0
- Schools +3.0/10.0
- Livability +2.8/5.0
- Rent growth +2.5/5.0
- Condition / age +2.5/5.0
$80,000
🖨 Deal sheet 📄 Offer letter ✓ Due diligence
Listing remarks
Selling for my parents. Very nice property the house is a fixer upper it has a full basement making it around 1,000 sq. ft. It also comes with super clean detached garage/work shop with plenty of storage room! The rest of the property can be divided into 14 separate lots with individual electric meter hookups! The property was once a mobile home park. I believe the whole property is around 2.5 acres. It takes up over half the bock. It would be a great place for a business opportunity as is! Or a profitable investment for a home builder! Asking $80,000 More pictures available! my name is Cody my number is (417) 214-1531 call or text anytime thanks!
Key facts
- Storage room
- Business opportunity
- 14 separate lots
Tags
Property features AI
Exterior
- Home design: House
- Construction: Built living area of 936
- Exterior features: 2-acre lot
Neighborhood map
What this means for you Summary
Snapshot
- This is a 2-bed/2.0-bath other listed at $80k.
Deal economics
- At list price, monthly cash flow is $334 ($4k/yr) — positive.
- The deal already cash-flows at list — no discount required.
- Meets the 1% rule at list price ($1k rent vs $80k).
Location & tenants
- Location reads 56/100 on livability (#696 in MO) — a working-class tenant base; expect higher turnover. Strengths: cost of living A+, housing B+; Watch: schools F, crime F, amenities F.
- Golden City R-III (rural): math 30% / reading 35% proficiency, ranked #435 of 535 in MO (top 81%) — families likely to look elsewhere, expect single-tenant / working-renter base with shorter leases.
- Market conditions: 23 active listings in the ZIP; 6 units permitted in Barton County in 2024 (0 in 5+ unit buildings).
Forward outlook
- In year one you build about $7k of equity ($553 loan paydown + $7k appreciation (8.4% local appreciation)).
- Barton County population projected at -21% by 2050 — secular population decline; favor cash flow + early exit over multi-decade hold.
- At projected returns (8.4% appreciation + 3.0% rent growth), your $22k cash investment doubles in ~2 years — after that, you're playing with house money.
- By year 5, paydown + projected appreciation supports a ~$33k cash-out refi (75% LTV) — recoverable capital for the next deal without selling this one.
Negotiation context
- Only 4 days on market — expect competitive offers; lowballing is unlikely to land.
- Current owner paid $16k; list at $80k implies a 388% gain — meaningful room to come down on a strong offer.
Risks & watch-outs
- Watch-outs: built in 1937 — expect roof / HVAC / electrical / plumbing capex.
- Climate carrying-cost: extreme-heat days projected 7→19/yr by 2055 (HVAC capex compounding) — expect insurance premiums to compound above CPI over the hold.
Questions for the listing agent
- Built in 1937 — when were the roof, HVAC, electrical panel, plumbing, and water heater last replaced?
- Is there a deadline driving the sale (1031 exchange, divorce, estate, relocation)? That informs how much negotiation room exists.
- Schools are F-rated, which usually means shorter tenancies and higher turnover. Who's the typical renter profile here, and what's been the actual vacancy rate?
- Crime grade is F in this area — have there been break-ins, vandalism, or insurance claims at this property in the last 3 years? What carrier currently insures it and at what premium?
- What's the average days-on-market for RENTAL listings here right now (not sales)? A rising rental-DOM trend means longer vacancies and softer asking-rent achievability than the comps imply.
- What's the recent tenant-quality profile in this submarket — average credit score on applications, eviction rate, late-payment / NSF rate, and stable-employment percentage? A property-management company in the area should have these aggregated.
- How much new for-sale + rental construction is in the pipeline within 1–3 miles? Heavy new supply typically softens prices + rents 12–24 months out; constrained supply supports both.
Investment metrics
- 1% rule
- 1.31% ✓
- Cap rate
- 11.31%
- Cash-on-cash
- 17.92%
- DSCR
- 1.80
- GRM
- 6.4
CMA / ARV
No comps found within radius.
Projected returns pro-forma
8.37% appreciation · 3.0% rent growth · sell at horizon
- IRR
- 34.7%
- Equity multiple
- 3.51×
- Total profit
- $56,157
- Equity at exit
- $62,819
- IRR
- 30.7%
- Equity multiple
- 7.57×
- Total profit
- $147,183
- Equity at exit
- $126,694
Cash invested: $22,400 (down + closing). Projections, not guarantees.
Landlord ↔ Tenant lean methodology
- Overall (STATE)
- 81 Strongly Landlord-Friendly
- State Missouri
- 81 Strongly Landlord-Friendly · R+10
- County
- — inherits STATE
- City
- — inherits STATE
ZIP-level market 64748
- Home prices YoY
- 5.7%
- Active inventory
- 23
- Price-to-rent
- 6.4×
Monthly cashflow live
- Estimated rent
- $1,048 medium interval (Pro) →
- Mortgage (P&I)
- −$420
- Tax from tax record
- −$41 /mo · $490/yr
- Insurance
- −$33
- HOA
- −$0
- Vacancy / Maint / Mgmt
- −$220
- Net cashflow
- $334
Break-even live
UW: 25.0% down · 7.5% · 30yr · 1.5% tax · 5.0% vac · 8.0% maint · 8.0% mgmt
Financing live
Cash to close
- Down payment
- $20,000
- Closing costs
- $2,400
- Reserves months
- —
- Total cash needed
- —
Loan-product check · same deal, 3 products live
Conventional
25% down · 7.5% · 30yr
- Down + closing
- —
- Monthly P&I
- —
- Monthly cashflow
- —
- DSCR
- —
- Eligible?
- —
Personal DTI + credit; lowest rate.
DSCR
20% down · 8.5% · 30yr
- Down + closing
- —
- Monthly P&I
- —
- Monthly cashflow
- —
- DSCR
- —
- Eligible?
- —
No personal income docs; deal must DSCR.
Hard money
10% down · 12.0% · 12mo
- Down + closing
- —
- Monthly P&I
- —
- Monthly cashflow
- —
- DSCR
- —
- Eligible?
- —
Short-term bridge; refi at stabilization.
Listing history 5 events
-
2026-06-18days on market $80,000 Active 4 DOM
-
2026-06-17days on market $80,000 Active 3 DOM
-
2026-06-16days on market $80,000 Active 2 DOM
-
2026-06-15remarks 656-char remark
-
2026-06-15$80,000 Active 1 DOM
ⓘ Source: listings_history table (triggers on properties + properties_extension) + one-shot
backfill from property_details.listing_events for pre-trigger history.
Tax reassessment forecast MO · Resets to sale price
- Current annual tax
- $490 · $41/mo
- Projected year-2 tax
- $776 · $65/mo
- Expected delta
- +$286/yr (+$24/mo · 58.3%)
ⓘ Screening estimate from a state-policy table — verify with the county assessor before closing.
Climate risk First Street
- Flood 1/10 Low FEMA zone X (unshaded) · 0% chance over 30 yrs
- Wildfire 1/10 Low
- Heat 5/10 Major 7 d/yr ≥107°F today · 19 d/yr by 30 yrs out
- Wind 2/10 Low 2% chance of damaging wind over 30 yrs
- Air quality 2/10 Low 1 unhealthy d/yr today · 1 by 30 yrs out
Nearby sold comps map
Loading sold comps map…
Walkable amenities ~0.75 mi
Loading nearby amenities…
Taxation est. · year 1
- Rental income
- $12,580
- − Mortgage interest
- −$4,481
- − Property taxes
- −$490
- − Insurance
- −$400
- − Repairs & maintenance
- −$1,006
- − Management
- −$1,006
- − Depreciation
- −$2,327
- Taxable income
- $2,869
- Est. tax owed @ 24.0%
- −$688
- After-tax cash flow
- $3,325/yr
For passive investors: Depreciation is non-cash, so a rental often shows a tax loss while cash-flowing — sheltering income. Rental losses are passive: they offset passive income freely, and up to $25,000/yr can offset ordinary (W-2) income if you actively participate and your MAGI is under $100k (phasing out to $0 by $150k); unused losses carry forward. On sale, claimed depreciation is recaptured at up to 25%, and gains may owe capital-gains tax (a 1031 exchange can defer both). Figures are a year-1 estimate at your 24.0% rate — not tax advice; consult a CPA.
Schools (NCES district)
- District
- Golden City R-III
- NCES district ID
- 2912930
- Math proficiency
- 30% ▼ -5.00%
- Reading proficiency
- 35% ▼ -10.00%
- Median HH income
- $36,261
- Composite
- 29.69/100
- National rank
- #11740
- State rank
- #435 of 535 in MO
Livability — Golden City
- Score
- 56/100
- State rank
- #696
- US rank
- #22723
Category grades
Schools grade is shown separately in the Schools card above.
Census & demographics
- Census place
- Golden City, MO
- Population (ZIP)
- 1,270
Population outlook (Barton County) Hauer SSP2
- Today (2025)
- 10,977 people
- By 2030
- 10,496 · -4.4%
- By 2040
- 9,537 · -13.1%
- By 2050
- 8,668 · -21.0%
- By 2075
- 7,557 · -31.2%
- By 2100
- 6,921 · -36.9%
Race, ethnicity, and origin ACS 2023
- Neighborhood character
- Predominantly White (93%)
- Race & ethnicity
- White 93% Two or more races 6% Hispanic / Latino 2%
- Common ancestry
- Lithuanian 3% Slovak 3% Scottish 2%
- Foreign-born
- 1%
- Languages at home
- 99% English-only · Chinese 1%
Political lean MEDSL · Barton
- 2024 margin
- Solid R (+72.2) · D 13.6% · R 85.8%
- 2008→2024 swing
- -22.4pp toward R · 2008: -49.8pp · 2024: -72.2pp
- All cycles
- 2024: R+72.2 2020: R+71.2 2016: R+70.2 2012: R+55.4 2008: R+49.8
Not yet ingested
- Civics
- —
Market trends
- HPI YoY
- ▲ 8.37%
- Current HPI
- 154.6946
- Rent YoY
- —
- Metro
- —
- State GDP YoY
- ▲ 1.84%
- F500 in state
- 20
Industry mix (Fortune 500 HQ in MO)
| Industry | F500 HQs | Revenue |
|---|---|---|
| Healthcare | 1 | $163B |
|
||
| Insurance | 1 | $21B |
|
||
| Industrial Technology | 1 | $17B |
|
||
| Retail | 1 | $16B |
|
||
| Industrial Distribution | 1 | $10B |
|
||
| Utilities | 1 | $9B |
|
||
Price history
+387.8% since first listed2 events — show timeline
- 2026-06-14 Listed $80,000 ForSaleByOwner.com
- 2017-11-14 Sold (Public Records) $16,400 Public Records
Property tax history
+0.2%/yrLatest (2025): $490 · +11.1% YoY. Source: county tax records.
Cash-flow waterfall
monthlySold comps — $/sqft
last 12 mo · ≤1 miLoading sold comps…