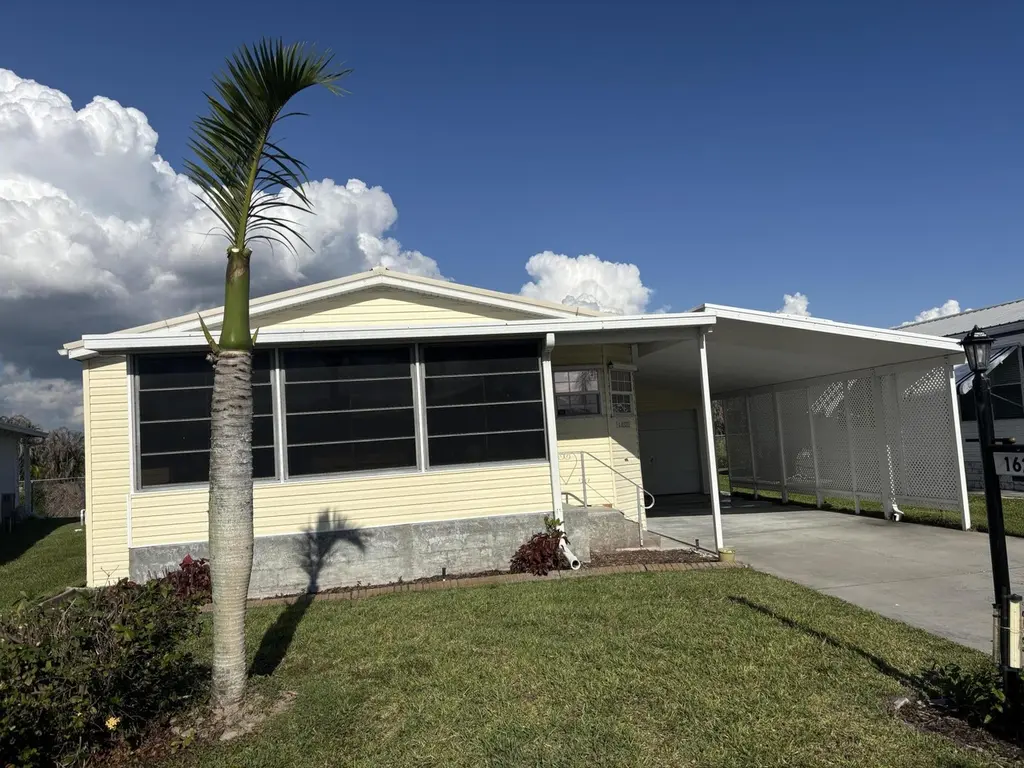
1621 SW 35th Cir · Okeechobee, FL
Flood risk 1/10 · Minimal
- FEMA flood zone
- X (shaded)
- Chance of flooding over 30 yrs
- 0.0%
- Est. flood insurance / yr
- $507 – $1,088
Fire risk 3/10 · Minor
- Est. fire insurance / yr
- $947 – $1,759
Heat risk 9/10 · Severe
- Hot days now (above 108°F)
- 7 days/yr
- Hot days in 30 yrs
- 24 days/yr
Wind risk 10/10 · Severe
- Chance of severe wind over 30 yrs
- 99.0%
Air-quality risk 2/10 · Minimal
- Unhealthy air days now
- 1 days/yr
- Unhealthy air days in 30 yrs
- 2 days/yr
Risk factors via First Street. Map © Google.
Why this score? — see what drove the D+ grade
The composite is a weighted blend of 9 inputs, each scored 0–100. Each bar is that input's sub-score; the figure is the points it added to the 100-point composite (weight × sub-score).
- ARV discount +13.8/15.0
- Cash flow +12.6/30.0
- 1% rule +4.8/10.0
- Livability +3.9/5.0
- DSCR +3.8/10.0
- Schools +3.6/10.0
- Rent growth +2.5/5.0
- Condition / age +2.5/5.0
- Appreciation +0.0/10.0
$150,000
🖨 Deal sheet (PDF) 📄 Offer letter ✓ Due diligence
Listing remarks
Seminole Cove, Wonderful 55+ Community! Lovely 2 Bedroom 2 Bath home with a water view and gorgeous sunsets! One car garage. Homes of Merritt on a concrete slab. Sprinkler system with a well. Community pool, clubhouse, shuffle board and many activities.
Key facts
- Clubhouse
- Community pool
- Shuffle board
Tags
Property features AI
Finance
- Financial info: Pets allowed (size limit)
- HOA & community: Active association with monthly fee ($114); Association maintains grounds; Community amenities: clubhouse, pool, shuffleboard court; Senior community
Exterior
- Parking: 2 total parking spaces; Attached 1-car garage; Attached carport with 1 space; Covered parking; Concrete surfaces
- Utilities: Public water; Public sewer; Electricity connected; Water connected; Cable available
- Home design: Manufactured home; One story; Resale condition; Faces west
- Construction: Vinyl siding; Metal roof; Slab foundation; Built as a single-story structure
- Exterior features: Paved road access; No waterfront
Interior
- Kitchen: Dishwasher; Electric range; Microwave; Refrigerator
- Bedrooms: 2 bedrooms on the main level
- Flooring: Carpet; Linoleum
- Bathrooms: 2 full bathrooms on the main level
- Heating & cooling: Central heating; Central air; Ceiling fans
- Interior features: Closet cabinetry
- Laundry & utility: Indoor laundry room
Neighborhood map
What this means for you Summary
Snapshot
- This is a 2-bed/2.0-bath manufactured listed at $150k.
Deal economics
- At list price, monthly cash flow is $-20 ($-234/yr) — negative.
- To cash-flow at today's rent, offer at most $147k (2.3% below list).
- To meet the 1% rule (rent ≥ 1% of price), the offer needs to be $147k (1.7% below list).
- Recommended offer: $146k (3.0% below list) — sets the bar for market timing.
- Cap rate 6.1% vs local median 4.3% in Okeechobee — top-decile yield for the area; either an underpriced asset or a hidden risk that comps aren't pricing in. Stress-test before assuming the spread holds.
Location & tenants
- Location reads 77/100 on livability (#210 in FL, #3,234 nationally) — a middle-class / working-renter tenant base. Strengths: cost of living A+, housing A+, health & safety A+; Watch: employment C-, amenities F, commute F.
- Okeechobee (town): math 44% / reading 42% proficiency, ranked #58 of 73 in FL (top 80%) — families likely to look elsewhere, expect single-tenant / working-renter base with shorter leases; 72% free/reduced lunch — lower-income household profile, screen leases tightly.
- Zoned schools: South Elementary School (math 38% / reading 49%, grade F, #1,345 of 2,144 statewide, top 64%, 573 students, 61% FRL); Osceola Middle School (math 53% / reading 36%, grade D, #320 of 571 statewide, top 57%, 753 students, 67% FRL); Okeechobee High School (math 30% / reading 42%, grade F, #359 of 667 statewide, top 55%, 1,692 students, 62% FRL).
- Market conditions: 406 active listings in the ZIP; 18 units permitted in Okeechobee County in 2024 (0 in 5+ unit buildings).
- This rent runs 33% of the median local income ($53k/yr) — at the standard rent-burdened threshold; future hikes will face affordability resistance.
Forward outlook
- Local home prices are declining (-3.0%/yr); year-one equity from $1k of loan paydown is wiped out by about $4k of value loss. Plan a longer hold.
- Okeechobee County population projected at -21% by 2050 — secular population decline; favor cash flow + early exit over multi-decade hold.
Negotiation context
- It's been on market 58 days — a 3% lower offer ($146k) is reasonable based on typical stale-listing flexibility.
- Current owner paid $5k; list at $150k implies a 3025% gain — meaningful room to come down on a strong offer.
Risks & watch-outs
- Climate carrying-cost: severe wind risk, 99% chance of damaging wind over 30y; extreme-heat days projected 7→24/yr by 2055 (HVAC capex compounding) — expect insurance premiums to compound above CPI over the hold.
Questions for the listing agent
- What do current leases actually rent for vs. the listed asking? Can we see a recent rent roll and the last 12 months of T-12 income?
- It's been on market 58 days. Have you received any prior offers? Is the seller open to a 3% concession, seller financing, or rate buy-down credit?
- What does the HOA fee cover, when was the last increase, and are there any pending special assessments or reserve-fund shortfalls?
- Is there a deadline driving the sale (1031 exchange, divorce, estate, relocation)? That informs how much negotiation room exists.
- The area grade is low — what's the realistic commute time and amenity access for the typical tenant pool here? Any planned neighborhood developments (good or bad) we should know about?
- What's the average days-on-market for RENTAL listings here right now (not sales)? A rising rental-DOM trend means longer vacancies and softer asking-rent achievability than the comps imply.
- What's the recent tenant-quality profile in this submarket — average credit score on applications, eviction rate, late-payment / NSF rate, and stable-employment percentage? A property-management company in the area should have these aggregated.
- How much new for-sale + rental construction is in the pipeline within 1–3 miles? Heavy new supply typically softens prices + rents 12–24 months out; constrained supply supports both.
Investment metrics
- 1% rule
- 0.98% ✗
- Cap rate
- 6.14%
- Cash-on-cash
- -0.56%
- DSCR
- 0.98
- GRM
- 8.5
CMA / ARV
- ARV (on-the-fly)
- $174,342
- Comps found
- 9
Show comp detail 9 sales within ~0.75 mi
| Address | Dist | Beds/Ba | Sqft | Sold | Price | $/sf | Match |
|---|---|---|---|---|---|---|---|
| 1625 SW 35th Cir | 0.02mi | 2/2.0 | 1,152 (-3%) | 2mo | $160,000 | $139 | 93 |
| 1575 SW 35th Cir | 0.17mi | 2/2.0 | 1,181 (-0%) | 18mo | $162,650 | $138 | 77 |
| 1692 SW 35th Cir | 0.18mi | 2/2.0 | 1,078 (-9%) | 2mo | $159,000 | $147 | 75 |
| 1628 SW 35 Cir | 0.05mi | 3/2.0 (+1) | 1,320 (+11%) | 13mo | $210,000 | $159 | 63 |
| 1517 SW 35th Cir | 0.42mi | 2/2.0 | 1,150 (-3%) | 20mo | $160,000 | $139 | 59 |
| 1300 SW 44th Blvd | 0.56mi | 2/2.0 | 1,325 (+12%) | 16mo | $238,000 | $180 | 41 |
| 4330 SW 13th Ave | 0.49mi | 2/2.0 | 1,054 (-11%) | 22mo | $166,250 | $158 | 40 |
| 1100 SW 44th Blvd | 0.51mi | 3/2.0 (+1) | 1,296 (+9%) | 19mo | $279,000 | $215 | 40 |
| 4350 SW 13th Ave | 0.51mi | 3/2.0 (+1) | 1,076 (-9%) | 20mo | $154,000 | $143 | 39 |
Match score weights: distance 35% · size 25% · config 20% · recency 20%. Top-matched comps best support the ARV.
Projected returns pro-forma
-3.0% appreciation · 3.0% rent growth · sell at horizon
- IRR
- -17.1%
- Equity multiple
- 0.39×
- Total profit
- $-25,437
- Equity at exit
- $22,365
- IRR
- -8.9%
- Equity multiple
- 0.45×
- Total profit
- $-23,292
- Equity at exit
- $12,969
Cash invested: $42,000 (down + closing). Projections, not guarantees.
Landlord ↔ Tenant lean methodology
- Overall (STATE)
- 87 Strongly Landlord-Friendly
- State Florida
- 87 Strongly Landlord-Friendly · R+3
- County
- — inherits STATE
- City
- — inherits STATE
ZIP-level market 34974
- Home prices YoY
- -15.6%
- Active inventory
- 406
- Price-to-rent
- 8.5×
Monthly cashflow live
- Estimated rent
- $1,474 medium interval (Pro) →
- Mortgage (P&I)
- −$787
- Tax from tax record
- −$221 /mo · $2,650/yr
- Insurance
- −$62
- HOA
- −$114
- Vacancy / Maint / Mgmt
- −$310
- Net cashflow
- $-20
Break-even live
Sensitivity live
| Price | -10% $65 | -5% $23 | +0% $-20 | +5% $-62 | +10% $-104 |
|---|---|---|---|---|---|
| Rent | -10% $-136 | -5% $-78 | +0% $-20 | +5% $39 | +10% $97 |
| Rate | -1.0pp $56 | -0.5pp $19 | base $-20 | +0.5pp $-58 | +1.0pp $-98 |
UW: 25.0% down · 7.5% · 30yr · 1.5% tax · 5.0% vac · 8.0% maint · 8.0% mgmt
Financing live
Cash to close
- Down payment
- $37,500
- Closing costs
- $4,500
- Reserves months
- —
- Total cash needed
- —
Loan-product check · same deal, 3 products live
Conventional
25% down · 7.5% · 30yr
- Down + closing
- —
- Monthly P&I
- —
- Monthly cashflow
- —
- DSCR
- —
- Eligible?
- —
Personal DTI + credit; lowest rate.
DSCR
20% down · 8.5% · 30yr
- Down + closing
- —
- Monthly P&I
- —
- Monthly cashflow
- —
- DSCR
- —
- Eligible?
- —
No personal income docs; deal must DSCR.
Hard money
10% down · 12.0% · 12mo
- Down + closing
- —
- Monthly P&I
- —
- Monthly cashflow
- —
- DSCR
- —
- Eligible?
- —
Short-term bridge; refi at stabilization.
HOA detail
- Monthly dues
- $114 · $1,368/yr
- Likely covers
- waterpool
Listing history 19 events
-
2026-06-22days on market $150,000 Active 58 DOM
-
2026-06-19days on market $150,000 Active 56 DOM
-
2026-06-18days on market $150,000 Active 55 DOM
-
2026-06-17days on market $150,000 Active 54 DOM
-
2026-06-16days on market $150,000 Active 53 DOM
-
2026-06-15days on market $150,000 Active 52 DOM
-
2026-06-14days on market $150,000 Active 50 DOM
-
2026-06-10days on market $150,000 Active 47 DOM
-
2026-06-09days on market $150,000 Active 46 DOM
-
2026-06-08days on market $150,000 Active 45 DOM
-
2026-06-07days on market $150,000 Active 44 DOM
-
2026-06-05days on market $150,000 Active 41 DOM
-
2026-06-03days on market $150,000 Active 40 DOM
-
2026-06-02days on market $150,000 Active 39 DOM
-
2026-06-01days on market $150,000 Active 38 DOM
-
2026-05-31days on market $150,000 Active 37 DOM
-
2026-05-30days on market $150,000 Active 36 DOM
-
2026-04-24$150,000 Active
-
1995-02-01soldstatus $4,800
ⓘ Source: listings_history table (triggers on properties + properties_extension) + one-shot
backfill from property_details.listing_events for pre-trigger history.
Tax reassessment forecast FL · Resets to sale price
- Current annual tax
- $2,650 · $221/mo
- Projected year-2 tax
- $2,650 · $221/mo
- Expected delta
- $0/yr ($0/mo · -0.0%)
ⓘ Screening estimate from a state-policy table — verify with the county assessor before closing.
Climate risk First Street
- Flood 1/10 Low FEMA zone X (shaded) · 0% chance over 30 yrs
- Wildfire 3/10 Moderate
- Heat 9/10 Extreme 7 d/yr ≥108°F today · 24 d/yr by 30 yrs out
- Wind 10/10 Extreme 99% chance of damaging wind over 30 yrs
- Air quality 2/10 Low 1 unhealthy d/yr today · 2 by 30 yrs out
Nearby sold comps map
Loading sold comps map…
Walkable amenities ~0.75 mi
Loading nearby amenities…
Taxation est. · year 1
- Rental income
- $17,688
- − Mortgage interest
- −$8,402
- − Property taxes
- −$2,650
- − Insurance
- −$750
- − Repairs & maintenance
- −$1,415
- − Management
- −$1,415
- − HOA
- −$1,368
- − Depreciation
- −$4,364
- Taxable loss
- −$2,676
- Est. tax savings @ 24.0%
- +$642
- After-tax cash flow
- $408/yr
For passive investors: Depreciation is non-cash, so a rental often shows a tax loss while cash-flowing — sheltering income. Rental losses are passive: they offset passive income freely, and up to $25,000/yr can offset ordinary (W-2) income if you actively participate and your MAGI is under $100k (phasing out to $0 by $150k); unused losses carry forward. On sale, claimed depreciation is recaptured at up to 25%, and gains may owe capital-gains tax (a 1031 exchange can defer both). Figures are a year-1 estimate at your 24.0% rate — not tax advice; consult a CPA.
Schools (NCES district)
- District
- Okeechobee
- NCES district ID
- 1201410
- Math proficiency
- 44% ▼ -12.00%
- Reading proficiency
- 42% ▼ -4.00%
- Median HH income
- $36,710
- Composite
- 35.73/100
- National rank
- #4855
- State rank
- #58 of 73 in FL
Livability — Okeechobee
- Score
- 77/100
- State rank
- #210
- US rank
- #3234
Category grades
Schools grade is shown separately in the Schools card above.
Census & demographics
- County
- Okeechobee County · 23,975 people
- City population
- 23,975
- Metro
- Okeechobee, FL
- Population (ZIP)
- 23,975
- Household income
- $53,013
- Rent vs Own
- Severe rent burden
- 399.0
Population outlook (Okeechobee County) Hauer SSP2
- Today (2025)
- 37,273 people
- By 2030
- 35,885 · -3.7%
- By 2040
- 32,931 · -11.6%
- By 2050
- 29,433 · -21.0%
- By 2075
- 19,607 · -47.4%
- By 2100
- 11,814 · -68.3%
Race, ethnicity, and origin ACS 2023
- Neighborhood character
- Predominantly White (74%)
- Race & ethnicity
- White 74% Hispanic / Latino 19% Two or more races 8% Asian 2% Black 2% Native American 1%
- Hispanic origin (detail)
- Mexican 12% Puerto Rican 1% Cuban 2%
- Common ancestry
- Lithuanian 2% Iranian 2% Italian 2%
- Foreign-born
- 11% · Canada, Jamaica
- Languages at home
- 81% English-only · Spanish 16% French/Haitian/Cajun 1% Other Indo-European 1%
Political lean MEDSL · Okeechobee
- 2024 margin
- Solid R (+53.8) · D 22.9% · R 76.7%
- 2008→2024 swing
- -34.6pp toward R · 2008: -19.2pp · 2024: -53.8pp
- All cycles
- 2024: R+53.8 2020: R+44.4 2016: R+39.5 2012: R+20.0 2008: R+19.2
Not yet ingested
- Civics
- —
Market trends
- HPI YoY
- ▼ -64.47%
- Current HPI
- 348.6692
- Rent YoY
- —
- Metro
- Okeechobee, FL
- State GDP YoY
- ▲ 3.28%
- F500 in state
- 36
Industry mix (Fortune 500 HQ in FL)
| Industry | F500 HQs | Revenue |
|---|---|---|
| Industrial Technology | 2 | $29B |
|
||
| Insurance | 2 | $17B |
|
||
| Retail | 1 | $60B |
|
||
| Technology Distribution | 1 | $58B |
|
||
| Homebuilding | 1 | $35B |
|
||
| Technology Manufacturing | 1 | $35B |
|
||
Price history
+3025.0% since first listed2 events — show timeline
- 2026-04-24 Listed $150,000 Beaches MLS
- 1995-02-01 Sold (Public Records) $4,800 Public Records
Property tax history
+6.8%/yrLatest (2025): $2,650 · +3.4% YoY. Source: county tax records.
Cash-flow waterfall
monthlySold comps — $/sqft
last 12 mo · ≤1 miLoading sold comps…