 19-Plex
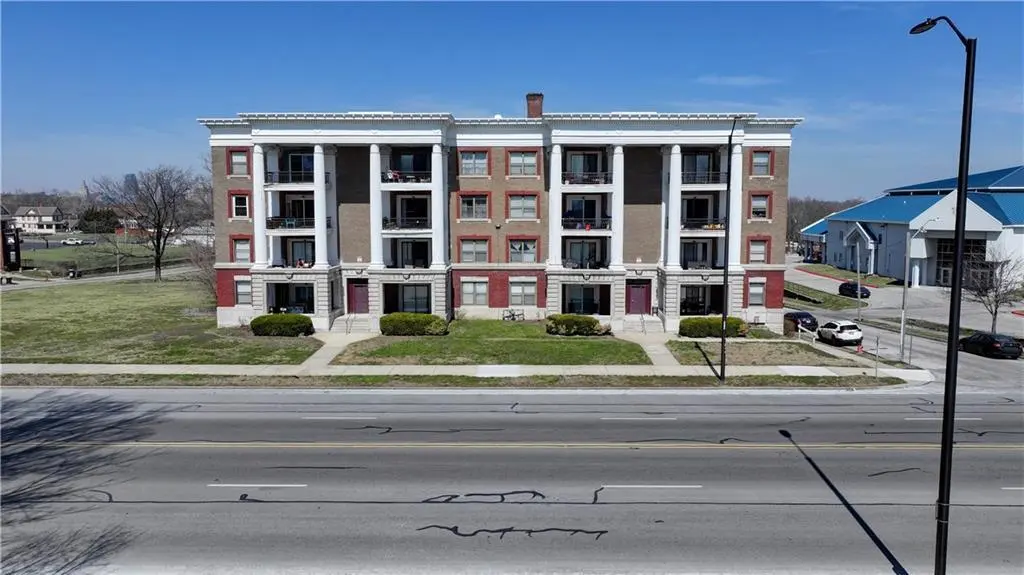
1614 E Linwood Blvd · Kansas City, MO
Flood risk 1/10 · Minimal
- FEMA flood zone
- X (unshaded)
- Chance of flooding over 30 yrs
- 0.0%
- Est. flood insurance / yr
- $507 – $1,088
Fire risk 1/10 · Minimal
- Est. fire insurance / yr
- $1,054 – $1,958
Heat risk 4/10 · Minor
- Hot days now (above 106°F)
- 7 days/yr
- Hot days in 30 yrs
- 17 days/yr
Wind risk 2/10 · Minimal
- Chance of severe wind over 30 yrs
- —
Air-quality risk 3/10 · Minor
- Unhealthy air days now
- 2 days/yr
- Unhealthy air days in 30 yrs
- 3 days/yr
Risk factors via First Street. Map © Google.
Why this score? — see what drove the C+ grade
The composite is a weighted blend of 9 inputs, each scored 0–100. Each bar is that input's sub-score; the figure is the points it added to the 100-point composite (weight × sub-score).
- Cash flow +30.0/30.0
- 1% rule +10.0/10.0
- DSCR +10.0/10.0
- Rent growth +4.9/5.0
- Livability +3.9/5.0
- Condition / age +2.5/5.0
- Schools +1.5/10.0
- ARV discount +0.0/15.0
- Appreciation +0.0/10.0
$2,150,000
🖨 Deal sheet 📄 Offer letter ✓ Due diligence
Multi-family units
County records classify this as Multi-Family (5+ Unit). Listing-text estimate: 19 units. confirmed
5+ unit building — per-unit beds/baths from public records are typically unavailable; the breakdown below (if shown) is an estimate from the listing text.
Listing remarks MLS
1614-1620 E. Linwood Blvd. is a 19-unit multifamily asset located in Midtown just east of the urban core with immediate proximity to Crown Center, The Crossroads Arts District, and Downtown Kansas City. The location provides residents with convenient access to major employment hubs, dining, retail, and entertainment options throughout the city. The property features a mix of oversized studio and two-bedroom floor plans, with two-bedroom units 1,200 + SF. These larger layouts offer a competitive advantage with the potential to add a bedroom and create 3-bedroom 1 bathroom units. The property gives local or regional investors the opportunity to acquire a fully occupied asset with room to increase rents through potential unit reconfiguration and strategic exterior upgrades.
Key facts
- Fully occupied asset
- Midtown location
- 0.44 acre lot
Tags
Neighborhood map
What this means for you Summary
Snapshot
- This is a 19 × 32-bed/19.0-bath units multifamily listed at $2.15M.
Deal economics
- At list price, monthly cash flow is $13k ($156k/yr) — positive. Per door: $683/mo.
- The deal already cash-flows at list — no discount required.
- Meets the 1% rule at list price ($33k rent vs $2.15M).
- Recommended offer: $2.02M (6.0% below list) — sets the bar for market timing.
- Cap rate 13.5% vs local median 3.9% in Kansas City — top-decile yield for the area; either an underpriced asset or a hidden risk that comps aren't pricing in. Stress-test before assuming the spread holds.
Location & tenants
- Location reads 78/100 on livability (#28 in MO, #2,671 nationally) — a middle-class / working-renter tenant base. Strengths: amenities A+, commute A+, cost of living A+; Watch: schools C-, crime F.
- Kansas City 33 (urban): math 12% / reading 24% proficiency, ranked #308 of 324 in MO (top 95%) — low school quality limits family demand, transient renter base, plan for 1-2y turnover; 75% free/reduced lunch — lower-income household profile, screen leases tightly.
- Market conditions: Rents rising fast (+9.5%/yr); 97 active listings in the ZIP; lower-income renter base — watch delinquency; 4,002 units permitted in Jackson County in 2024 (2,271 in 5+ unit buildings).
- At $33,328/mo this rent would consume 954% of the median local household income ($42k/yr) (locally 853% of renters already pay >50% of income on rent) — very limited rent-growth headroom before tenants either downsize or default.
Forward outlook
- Local home prices are declining (-3.0%/yr); year-one equity from $15k of loan paydown is wiped out by about $64k of value loss. Plan a longer hold.
- Jackson County population projected at +4% by 2050 — modest demand growth; plan on rents tracking national, not racing it.
- At projected returns (-3.0% appreciation + 8.0% rent growth), your $602k cash investment doubles in ~5 years — after that, you're playing with house money.
Negotiation context
- It's been on market 76 days — a 6% lower offer ($2.02M) is reasonable based on typical stale-listing flexibility.
- 9 sale attempts since 4y ago with the ask held roughly flat each time — persistent listings suggest the price (not the market) is what's stuck; bring a comps-based counter.
Risks & watch-outs
- Watch-outs: built in 1910 — expect roof / HVAC / electrical / plumbing capex.
Questions for the listing agent
- It's been on market 76 days. Have you received any prior offers? Is the seller open to a 6% concession, seller financing, or rate buy-down credit?
- Can we see the unit-by-unit rent roll, current vacancy, and any below-market leases? What's the average tenancy length?
- What capital expenditures (roof, boiler, parking lot, exteriors) have been made in the last 5 years, and what's planned in the next 2?
- Built in 1910 — when were the roof, HVAC, electrical panel, plumbing, and water heater last replaced?
- Why hasn't it sold? Are there any deal-killer items the seller is aware of (foundation, flood, title, zoning, code violations)?
- Is there a deadline driving the sale (1031 exchange, divorce, estate, relocation)? That informs how much negotiation room exists.
- Crime grade is F in this area — have there been break-ins, vandalism, or insurance claims at this property in the last 3 years? What carrier currently insures it and at what premium?
- What's the average days-on-market for RENTAL listings here right now (not sales)? A rising rental-DOM trend means longer vacancies and softer asking-rent achievability than the comps imply.
- What's the recent tenant-quality profile in this submarket — average credit score on applications, eviction rate, late-payment / NSF rate, and stable-employment percentage? A property-management company in the area should have these aggregated.
- How much new apartment / multifamily construction is in the pipeline within 1–3 miles? Heavy new supply (>2% of stock underway) typically softens rents 12–24 months out; light construction supports rent growth.
Investment metrics
- 1% rule
- 1.55% ✓
- Cap rate
- 13.53%
- Cash-on-cash
- 25.86%
- DSCR
- 2.15
- GRM
- 5.4
CMA / ARV
- ARV (median comp)
- $1,822,824
- List price
- $2,150,000
- Delta
- 17.95%
- Verdict
- OVERPRICED
- Comps
- 1 within 2.0 mi
Projected returns pro-forma
-3.0% appreciation · 8.0% rent growth · sell at horizon
- IRR
- 24.8%
- Equity multiple
- 2.09×
- Total profit
- $653,566
- Equity at exit
- $320,572
- IRR
- 35.4%
- Equity multiple
- 5.04×
- Total profit
- $2,432,978
- Equity at exit
- $185,893
Cash invested: $602,000 (down + closing). Projections, not guarantees.
Landlord ↔ Tenant lean methodology
- Overall (STATE)
- 81 Strongly Landlord-Friendly
- State Missouri
- 81 Strongly Landlord-Friendly · R+10
- County
- — inherits STATE
- City
- — inherits STATE
ZIP-level market 64109
- Rents YoY
- 9.5%
- Active inventory
- 97
- Price-to-rent
- 102.1×
Monthly cashflow live
- Estimated rent
- $33,328 medium interval (Pro) →
- Mortgage (P&I)
- −$11,275
- Tax from tax record
- −$1,186 /mo · $14,227/yr
- Insurance
- −$896
- HOA
- −$0
- Vacancy / Maint / Mgmt
- −$6,999
- Net cashflow
- $12,973
Break-even live
19-unit breakdown (identical units grouped — click to expand)
| Units | Beds | Baths | Est. rent |
|---|---|---|---|
| 19× units | 32 | 19 | $33,326 |
| #1 | 32 | 19 | $1,754 |
| #2 | 32 | 19 | $1,754 |
| #3 | 32 | 19 | $1,754 |
| #4 | 32 | 19 | $1,754 |
| #5 | 32 | 19 | $1,754 |
| #6 | 32 | 19 | $1,754 |
| #7 | 32 | 19 | $1,754 |
| #8 | 32 | 19 | $1,754 |
| #9 | 32 | 19 | $1,754 |
| #10 | 32 | 19 | $1,754 |
| #11 | 32 | 19 | $1,754 |
| #12 | 32 | 19 | $1,754 |
| #13 | 32 | 19 | $1,754 |
| #14 | 32 | 19 | $1,754 |
| #15 | 32 | 19 | $1,754 |
| #16 | 32 | 19 | $1,754 |
| #17 | 32 | 19 | $1,754 |
| #18 | 32 | 19 | $1,754 |
| #19 | 32 | 19 | $1,754 |
| Total (19 units) | $33,328 | ||
UW: 25.0% down · 7.5% · 30yr · 1.5% tax · 5.0% vac · 8.0% maint · 8.0% mgmt
Financing live
Cash to close
- Down payment
- $537,500
- Closing costs
- $64,500
- Reserves months
- —
- Total cash needed
- —
Loan-product check · same deal, 3 products live
Conventional
25% down · 7.5% · 30yr
- Down + closing
- —
- Monthly P&I
- —
- Monthly cashflow
- —
- DSCR
- —
- Eligible?
- —
Personal DTI + credit; lowest rate.
DSCR
20% down · 8.5% · 30yr
- Down + closing
- —
- Monthly P&I
- —
- Monthly cashflow
- —
- DSCR
- —
- Eligible?
- —
No personal income docs; deal must DSCR.
Hard money
10% down · 12.0% · 12mo
- Down + closing
- —
- Monthly P&I
- —
- Monthly cashflow
- —
- DSCR
- —
- Eligible?
- —
Short-term bridge; refi at stabilization.
Listing history 38 events
-
2026-06-18days on market $2,150,000 Active 76 DOM
-
2026-06-17days on market $2,150,000 Active 75 DOM
-
2026-06-16days on market $2,150,000 Active 74 DOM
-
2026-06-15days on market $2,150,000 Active 73 DOM
-
2026-06-13days on market $2,150,000 Active 71 DOM
-
2026-06-09days on market $2,150,000 Active 67 DOM
-
2026-06-08days on market $2,150,000 Active 66 DOM
-
2026-06-07days on market $2,150,000 Active 65 DOM
-
2026-06-05days on market $2,150,000 Active 62 DOM
-
2026-06-03days on market $2,150,000 Active 61 DOM
-
2026-06-02days on market $2,150,000 Active 60 DOM
-
2026-06-01days on market $2,150,000 Active 59 DOM
-
2026-05-31days on market $2,150,000 Active 58 DOM
-
2026-04-03$2,150,000 Active 781-char remark
Show marketing remark (781 chars)
1614-1620 E. Linwood Blvd. is a 19-unit multifamily asset located in Midtown just east of the urban core with immediate proximity to Crown Center, The Crossroads Arts District, and Downtown Kansas City. The location provides residents with convenient access to major employment hubs, dining, retail, and entertainment options throughout the city. The property features a mix of oversized studio and two-bedroom floor plans, with two-bedroom units 1,200 + SF. These larger layouts offer a competitive advantage with the potential to add a bedroom and create 3-bedroom 1 bathroom units. The property gives local or regional investors the opportunity to acquire a fully occupied asset with room to increase rents through potential unit reconfiguration and strategic exterior upgrades.
-
2024-10-19historical $975
-
2024-09-13$975
-
2024-08-25historical $995
-
2024-08-09$995
-
2024-07-31historical
-
2024-05-24historical $950
-
2024-05-07$950
-
2024-04-04$2,100,000 Active
-
2023-10-01historical $695
-
2023-09-25$695
-
2023-09-16historical $695
-
2023-09-15$695
-
2022-05-20soldstatus Closed
-
2022-05-20soldstatus
-
2022-04-02status Pending
-
2022-03-29status Active
-
2022-03-29price $1,720,000
-
2022-02-23status Pending
-
2022-02-03$1,790,000 Active
-
2006-01-26soldstatus
-
2001-03-05soldstatus
-
2000-10-26soldstatus
-
2000-05-02soldstatus
-
1995-01-03soldstatus
ⓘ Source: listings_history table (triggers on properties + properties_extension) + one-shot
backfill from property_details.listing_events for pre-trigger history.
Tax reassessment forecast MO · Resets to sale price
- Current annual tax
- $14,227 · $1,186/mo
- Projected year-2 tax
- $20,855 · $1,738/mo
- Expected delta
- +$6,628/yr (+$552/mo · 46.6%)
ⓘ Screening estimate from a state-policy table — verify with the county assessor before closing.
Climate risk First Street
- Flood 1/10 Low FEMA zone X (unshaded) · 0% chance over 30 yrs
- Wildfire 1/10 Low
- Heat 4/10 Moderate 7 d/yr ≥106°F today · 17 d/yr by 30 yrs out
- Wind 2/10 Low
- Air quality 3/10 Moderate 2 unhealthy d/yr today · 3 by 30 yrs out
Nearby sold comps map
Loading sold comps map…
Walkable amenities ~0.75 mi
Loading nearby amenities…
Taxation est. · year 1
- Rental income
- $399,936
- − Mortgage interest
- −$120,433
- − Property taxes
- −$14,227
- − Insurance
- −$10,750
- − Repairs & maintenance
- −$31,995
- − Management
- −$31,995
- − Depreciation
- −$62,545
- Taxable income
- $127,990
- Est. tax owed @ 24.0%
- −$30,718
- After-tax cash flow
- $124,957/yr
For passive investors: Depreciation is non-cash, so a rental often shows a tax loss while cash-flowing — sheltering income. Rental losses are passive: they offset passive income freely, and up to $25,000/yr can offset ordinary (W-2) income if you actively participate and your MAGI is under $100k (phasing out to $0 by $150k); unused losses carry forward. On sale, claimed depreciation is recaptured at up to 25%, and gains may owe capital-gains tax (a 1031 exchange can defer both). Figures are a year-1 estimate at your 24.0% rate — not tax advice; consult a CPA.
Schools (NCES district)
- District
- Kansas City 33
- NCES district ID
- 2916400
- Math proficiency
- 12% ▼ -8.00%
- Reading proficiency
- 24% ▬ 0.00%
- Median HH income
- $35,227
- Composite
- 14.8/100
- National rank
- #9387
- State rank
- #308 of 324 in MO
Livability — Kansas City
- Score
- 78/100
- State rank
- #28
- US rank
- #2671
Category grades
Schools grade is shown separately in the Schools card above.
Census & demographics
- Census place
- Kansas City, MO
- County
- Jackson County · 687,798 people
- City population
- 439,467
- Metro
- Kansas City, MO-KS
- Population (ZIP)
- 10,043
- Household income
- $41,943
- Rent vs Own
- Severe rent burden
- 853.0
Population outlook (Jackson County) Hauer SSP2
- Today (2025)
- 719,589 people
- By 2030
- 731,456 · +1.6%
- By 2040
- 746,689 · +3.8%
- By 2050
- 749,289 · +4.1%
- By 2075
- 736,227 · +2.3%
- By 2100
- 668,210 · -7.1%
Race, ethnicity, and origin ACS 2023
- Neighborhood character
- Diverse neighborhood (Simpson 0.64)
- Race & ethnicity
- Black 45% White 39% Hispanic / Latino 9% Two or more races 4% Asian 2%
- Hispanic origin (detail)
- Mexican 7%
- Common ancestry
- Slovak 1% Romanian 1% Lithuanian 1%
- Foreign-born
- 7% · Canada, Philippines, China
- Languages at home
- 88% English-only · Spanish 5% Other Asian/Pacific 3% Arabic 1%
Political lean MEDSL · Jackson
- 2024 margin
- D (+19.3) · D 58.9% · R 39.5% · Other 1.6%
- 2008→2024 swing
- -6.1pp toward R · 2008: 25.4pp · 2024: 19.3pp
- All cycles
- 2024: D+19.3 2020: D+22.0 2016: D+16.6 2012: D+19.0 2008: D+25.4
Not yet ingested
- Civics
- —
Market trends
- HPI YoY
- ▼ -275.12%
- Current HPI
- 243.6094
- Rent YoY
- ▲ 9.50%
- Metro
- Kansas City, MO-KS
- State GDP YoY
- ▲ 1.84%
- F500 in state
- 20
Industry mix (Fortune 500 HQ in MO)
| Industry | F500 HQs | Revenue |
|---|---|---|
| Healthcare | 1 | $163B |
|
||
| Insurance | 1 | $21B |
|
||
| Industrial Technology | 1 | $17B |
|
||
| Retail | 1 | $16B |
|
||
| Industrial Distribution | 1 | $10B |
|
||
| Utilities | 1 | $9B |
|
||
Price history
+20.1% since first listed25 events — show timeline
- 2026-04-03 Listed $2,150,000 Heartland MLS as Distributed by MLS Grid
- 2024-10-19 Rental Removed $975 APPFOLIO
- 2024-09-13 Listed for Rent $975 APPFOLIO
- 2024-08-25 Rental Removed $995 APPFOLIO
- 2024-08-09 Listed for Rent $995 APPFOLIO
- 2024-07-31 Listing Removed — Heartland MLS as Distributed by MLS Grid
- 2024-05-24 Rental Removed $950 APPFOLIO
- 2024-05-07 Listed for Rent $950 APPFOLIO
- 2024-04-04 Listed $2,100,000 Heartland MLS as Distributed by MLS Grid
- 2023-10-01 Rental Removed $695 APPFOLIO
- 2023-09-25 Listed for Rent $695 APPFOLIO
- 2023-09-16 Rental Removed $695 APPFOLIO
- 2023-09-15 Listed for Rent $695 APPFOLIO
- 2022-05-20 Sold (Public Records) — Public Records
- 2022-05-20 Sold (MLS) — Heartland MLS as Distributed by MLS Grid
- 2022-04-02 Pending — Heartland MLS as Distributed by MLS Grid
- 2022-03-29 Relisted — Heartland MLS as Distributed by MLS Grid
- 2022-03-29 Price Changed $1,720,000 Heartland MLS as Distributed by MLS Grid
- 2022-02-23 Pending — Heartland MLS as Distributed by MLS Grid
- 2022-02-03 Listed $1,790,000 Heartland MLS as Distributed by MLS Grid
- 2006-01-26 Sold (Public Records) — Public Records
- 2001-03-05 Sold (Public Records) — Public Records
- 2000-10-26 Sold (Public Records) — Public Records
- 2000-05-02 Sold (Public Records) — Public Records
- 1995-01-03 Sold (Public Records) — Public Records
Property tax history
+13.6%/yrLatest (2025): $14,227 · -36.8% YoY. Source: county tax records.
Cash-flow waterfall
monthlySold comps — $/sqft
last 12 mo · ≤1 miLoading sold comps…