2223 Fairgreen Dr · Missouri City, TX
Flood risk 7/10 · Major
- FEMA flood zone
- X (unshaded)
- Chance of flooding over 30 yrs
- 0.99%
- Est. flood insurance / yr
- $507 – $1,088
Fire risk 2/10 · Minimal
- Est. fire insurance / yr
- $1,222 – $2,270
Heat risk 9/10 · Severe
- Hot days now (above 110°F)
- 7 days/yr
- Hot days in 30 yrs
- 23 days/yr
Wind risk 9/10 · Severe
- Chance of severe wind over 30 yrs
- 99.0%
Air-quality risk 3/10 · Minor
- Unhealthy air days now
- 2 days/yr
- Unhealthy air days in 30 yrs
- 3 days/yr
Risk factors via First Street. Map © Google.
Why this score? — see what drove the D+ grade
The composite is a weighted blend of 9 inputs, each scored 0–100. Each bar is that input's sub-score; the figure is the points it added to the 100-point composite (weight × sub-score).
- ARV discount +11.8/15.0
- Cash flow +11.2/30.0
- Appreciation +4.7/10.0
- Schools +4.5/10.0
- 1% rule +4.1/10.0
- Livability +3.4/5.0
- DSCR +3.3/10.0
- Rent growth +2.6/5.0
- Condition / age +2.5/5.0
$235,000
🖨 Deal sheet 📄 Offer letter ✓ Due diligence
Listing remarks
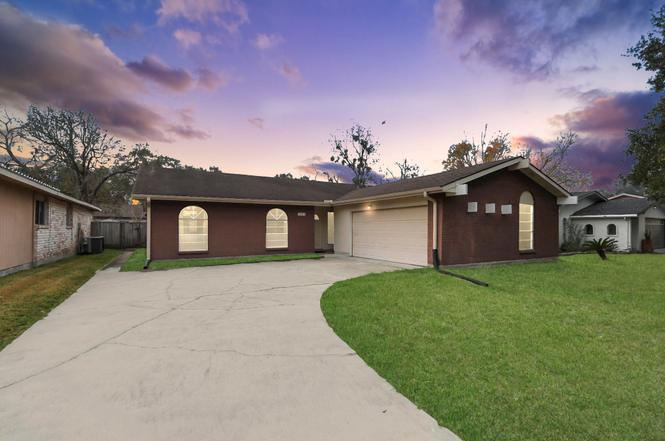
Spacious one-story in Quail Valley East ready for immediate move-in. Pristine and well cared for home offers spacious living areas, a covered rear screened porch and large backyard with fruit trees. Convenient access in all directions to major freeways or tollways. Perfect home for first time home buyers or investors - Come live where you play!
Key facts
- Large backyard
- Convenient access
- One-story
Tags
Neighborhood map
What this means for you Summary
Snapshot
- This is a 3-bed/2.0-bath single-family listed at $235k.
Deal economics
- At list price, monthly cash flow is $-158 ($-2k/yr) — negative.
- To cash-flow at today's rent, offer at most $207k (11.9% below list).
- To meet the 1% rule (rent ≥ 1% of price), the offer needs to be $214k (8.9% below list).
- Recommended offer: $207k (11.9% below list) — sets the bar for cash-flow.
- Cap rate 5.8% vs local median 3.5% in Missouri City — top-decile yield for the area; either an underpriced asset or a hidden risk that comps aren't pricing in. Stress-test before assuming the spread holds.
Location & tenants
- Location reads 67/100 on livability (#526 in TX) — a middle-class / working-renter tenant base. Strengths: housing A+, crime A, employment A; Watch: amenities F, commute F, health & safety F.
- Fort Bend ISD (suburban): math 44% / reading 53% proficiency, ranked #140 of 826 in TX (top 17%) — families likely to look elsewhere, expect single-tenant / working-renter base with shorter leases.
- Zoned schools: Lantern Lane El (math 17% / reading 37%, grade F, #2,791 of 4,322 statewide, top 68%, 472 students, 77% FRL); Quail Valley Middle (math 55% / reading 57%, grade B-, #234 of 1,662 statewide, top 14%, 1,043 students, 45% FRL) — zoned schools average 61% FRL vs 35% district-wide (26 pts higher); higher-poverty schools than district average — tighter screening recommended.
- Market conditions: Rents flat; 186 active listings in the ZIP; 12 comparable units currently listed for rent nearby; rentals at typical pace (median 22d on market — plan ~3-4 weeks tenant-placement turnaround); 12,093 units permitted in Fort Bend County in 2024 (815 in 5+ unit buildings).
- This rent runs 34% of the median local income ($75k/yr) — at the standard rent-burdened threshold; future hikes will face affordability resistance.
Forward outlook
- In year one you build about $330 of equity ($2k loan paydown + $-1k appreciation (-0.6% local appreciation)).
- Fort Bend County population projected at +75% by 2050 — long-run rental-demand tailwind backs the buy-and-hold thesis.
Negotiation context
- It's been on market 108 days — a 9% lower offer ($214k) is reasonable based on typical stale-listing flexibility.
- 3 sale attempts since 5y ago; this cycle's ask has dropped $19k (7%) from the opening price — seller is motivated, your offer sets the floor, not the list.
Risks & watch-outs
- Watch-outs: flood insurance adds $66/mo.
- Climate carrying-cost: major flood risk; severe wind risk, 99% chance of damaging wind over 30y; extreme-heat days projected 7→23/yr by 2055 (HVAC capex compounding) — expect insurance premiums to compound above CPI over the hold.
Questions for the listing agent
- What do current leases actually rent for vs. the listed asking? Can we see a recent rent roll and the last 12 months of T-12 income?
- It's been on market 108 days. Have you received any prior offers? Is the seller open to a 12% concession, seller financing, or rate buy-down credit?
- Built in 1975 — when were the roof, HVAC, electrical panel, plumbing, and water heater last replaced?
- What's the actual annual flood-insurance premium (NFIP or private), and is the property in a SFHA with mandatory coverage?
- What does the HOA fee cover, when was the last increase, and are there any pending special assessments or reserve-fund shortfalls?
- Why hasn't it sold? Are there any deal-killer items the seller is aware of (foundation, flood, title, zoning, code violations)?
- Is there a deadline driving the sale (1031 exchange, divorce, estate, relocation)? That informs how much negotiation room exists.
- Schools are B-rated — typically a magnet for longer-tenancy family renters. What's the average tenant stay here, and is there a school-zone premium baked into asking?
- The area grade is low — what's the realistic commute time and amenity access for the typical tenant pool here? Any planned neighborhood developments (good or bad) we should know about?
- What's the average days-on-market for RENTAL listings here right now (not sales)? A rising rental-DOM trend means longer vacancies and softer asking-rent achievability than the comps imply.
- What's the recent tenant-quality profile in this submarket — average credit score on applications, eviction rate, late-payment / NSF rate, and stable-employment percentage? A property-management company in the area should have these aggregated.
- How much new for-sale + rental construction is in the pipeline within 1–3 miles? Heavy new supply typically softens prices + rents 12–24 months out; constrained supply supports both.
Investment metrics
- 1% rule
- 0.91% ✗
- Cap rate
- 5.82%
- Cash-on-cash
- -1.67%
- DSCR
- 0.93
- GRM
- 9.2
CMA / ARV
- ARV (on-the-fly)
- $259,652
- Comps found
- 12
Show comp detail 12 sales within ~0.75 mi
| Address | Dist | Beds/Ba | Sqft | Sold | Price | $/sf | Match |
|---|---|---|---|---|---|---|---|
| 2726 Valley Forest Dr | 0.17mi | 4/2.0 (+1) | 1,937 (+4%) | 4mo | $298,000 | $154 | 78 |
| 3019 Quail Valley East Dr | 0.29mi | 4/2.0 (+1) | 1,868 (0%) | 4mo | $264,900 | $142 | 78 |
| 2230 Quail Valley East Dr | 0.49mi | 3/2.0 | 1,838 (-2%) | 2mo | $224,900 | $122 | 72 |
| 3131 Quail Valley East Dr | 0.33mi | 3/2.0 | 1,997 (+7%) | 2mo | $289,500 | $145 | 71 |
| 1731 Gray Hawk Dr | 0.59mi | 3/2.0 | 1,740 (-7%) | 3mo | $310,000 | $178 | 58 |
| 2503 Ashmont Dr | 0.42mi | 3/2.0 | 2,139 (+14%) | 0mo | $220,000 | $103 | 56 |
| 2818 Eaglerock Cir | 0.28mi | 4/2.0 (+1) | 2,146 (+15%) | 2mo | $289,000 | $135 | 55 |
| 2914 Quail Valley East Dr | 0.27mi | 4/2.5 (+1) | 2,146 (+15%) | 2mo | $299,000 | $139 | 54 |
| 3290 Hunters Glen Dr | 0.64mi | 3/2.0 | 1,676 (-10%) | 1mo | $210,000 | $125 | 52 |
| 2207 Cottonwood Ct | 0.71mi | 3/2.0 | 1,700 (-9%) | 4mo | $225,000 | $132 | 49 |
| 1747 Hilton Head Dr | 0.72mi | 4/2.5 (+1) | 2,030 (+9%) | 2mo | $300,000 | $148 | 44 |
| 2850 Creekway Cir | 0.74mi | 3/2.0 | 2,072 (+11%) | 5mo | $269,000 | $130 | 43 |
Match score weights: distance 35% · size 25% · config 20% · recency 20%. Top-matched comps best support the ARV.
Projected returns pro-forma
-0.55% appreciation · 0.34% rent growth · sell at horizon
- IRR
- -9.8%
- Equity multiple
- 0.57×
- Total profit
- $-28,376
- Equity at exit
- $61,832
- IRR
- -5.8%
- Equity multiple
- 0.48×
- Total profit
- $-34,497
- Equity at exit
- $69,389
Cash invested: $65,800 (down + closing). Projections, not guarantees.
Landlord ↔ Tenant lean methodology
- Overall (STATE)
- 87 Strongly Landlord-Friendly
- State Texas
- 87 Strongly Landlord-Friendly · R+5
- County
- — inherits STATE
- City
- — inherits STATE
ZIP-level market 77489
- Home prices YoY
- -0.2%
- Rents YoY
- 0.3%
- Active inventory
- 186
- Price-to-rent
- 9.2×
Monthly cashflow live
- Estimated rent
- $2,140 high interval (Pro) →
- Mortgage (P&I)
- −$1,232
- Tax from tax record
- −$427 /mo · $5,121/yr
- Insurance
- −$98
- Flood insurance flood zone
- −$66 /mo · $798/yr
- HOA
- −$25
- Vacancy / Maint / Mgmt
- −$449
- Net cashflow
- $-158
Break-even live
UW: 25.0% down · 7.5% · 30yr · 1.5% tax · 5.0% vac · 8.0% maint · 8.0% mgmt
Financing live
Cash to close
- Down payment
- $58,750
- Closing costs
- $7,050
- Reserves months
- —
- Total cash needed
- —
Loan-product check · same deal, 3 products live
Conventional
25% down · 7.5% · 30yr
- Down + closing
- —
- Monthly P&I
- —
- Monthly cashflow
- —
- DSCR
- —
- Eligible?
- —
Personal DTI + credit; lowest rate.
DSCR
20% down · 8.5% · 30yr
- Down + closing
- —
- Monthly P&I
- —
- Monthly cashflow
- —
- DSCR
- —
- Eligible?
- —
No personal income docs; deal must DSCR.
Hard money
10% down · 12.0% · 12mo
- Down + closing
- —
- Monthly P&I
- —
- Monthly cashflow
- —
- DSCR
- —
- Eligible?
- —
Short-term bridge; refi at stabilization.
Rent comps 12 comps
| Address | Beds | Baths | Sqft | Rent | $/sqft | DOM | Units | Dist |
|---|---|---|---|---|---|---|---|---|
| 1919 Doliver Cir Missouri City, TX | 3.0 | 2.0 | 1515 | $2,000 | $1.32 | 43d | 1 | 0.27mi |
| 2307 Hilton Head Dr Missouri City, TX | 4.0 | 2.0 | 2606 | $2,239 | $0.86 | 16d | 1 | 0.37mi |
| 2910 Fawn Ct Missouri City, TX | 4.0 | 2.5 | 2330 | $2,220 | $0.95 | 43d | 1 | 0.67mi |
| 3618 Quail Meadow Dr Missouri City, TX | 3.0 | 2.0 | 1618 | $1,966 | $1.22 | 43d | 1 | 0.93mi |
| 2026 Summer Place Dr Missouri City, TX | 3.0 | 2.0 | 1837 | $1,861 | $1.01 | 20d | 1 | 0.95mi |
| 1806 Courtside Place Dr Missouri City, TX | 4.0 | 2.5 | 1974 | $1,915 | $0.97 | 12d | 1 | 1.02mi |
| 17318 Edgehaven Dr Missouri City, TX | 3.0 | 2.0 | 1448 | $1,695 | $1.17 | 20d | 1 | 1.20mi |
| 3327 Shady Glen Ln Missouri City, TX | 4.0 | 2.5 | 2232 | $2,250 | $1.01 | 12d | 1 | 1.28mi |
| 2120 Bermuda Dunes Dr Missouri City, TX | 3.0 | 2.5 | 2100 | $2,200 | $1.05 | 24d | 1 | 1.30mi |
| 4039 Mission Valley Dr Missouri City, TX | 4.0 | 2.5 | 2364 | $2,495 | $1.06 | 21d | 1 | 1.33mi |
| 22 Chapparal Ct Missouri City, TX | 3.0 | 2.0 | 1504 | $2,000 | $1.33 | 43d | 1 | 1.41mi |
| 1215 New Tree Ln Missouri City, TX | 3.0 | 2.0 | 1323 | $1,725 | $1.30 | 12d | 1 | 1.42mi |
HOA detail
- Monthly dues
- $25 · $300/yr
Listing history 11 events
-
2026-04-17status Pending
-
2026-04-13status Pending
-
2026-04-03price $235,000
-
2025-12-30$254,000 Active
-
2022-02-21historical
-
2022-02-09status Active
-
2022-02-03price $2,270
-
2022-01-30status Pending
-
2021-12-21$245,000 Active
-
2012-10-04soldstatus
-
1999-11-12soldstatus
ⓘ Source: listings_history table (triggers on properties + properties_extension) + one-shot
backfill from property_details.listing_events for pre-trigger history.
Tax reassessment forecast TX · Resets to sale price
- Current annual tax
- $5,121 · $427/mo
- Projected year-2 tax
- $5,121 · $427/mo
- Expected delta
- $0/yr ($0/mo · 0.0%)
ⓘ Screening estimate from a state-policy table — verify with the county assessor before closing.
Climate risk First Street
- Flood 7/10 Severe FEMA zone X (unshaded) · 99% chance over 30 yrs
- Wildfire 2/10 Low
- Heat 9/10 Extreme 7 d/yr ≥110°F today · 23 d/yr by 30 yrs out
- Wind 9/10 Extreme 99% chance of damaging wind over 30 yrs
- Air quality 3/10 Moderate 2 unhealthy d/yr today · 3 by 30 yrs out
Nearby sold comps map
Loading sold comps map…
Walkable amenities ~0.75 mi
Loading nearby amenities…
Taxation est. · year 1
- Rental income
- $25,677
- − Mortgage interest
- −$13,164
- − Property taxes
- −$5,121
- − Insurance
- −$1,972
- − Repairs & maintenance
- −$2,054
- − Management
- −$2,054
- − HOA
- −$300
- − Depreciation
- −$6,836
- Taxable loss
- −$5,826
- Est. tax savings @ 24.0%
- +$1,398
- After-tax cash flow
- $-500/yr
For passive investors: Depreciation is non-cash, so a rental often shows a tax loss while cash-flowing — sheltering income. Rental losses are passive: they offset passive income freely, and up to $25,000/yr can offset ordinary (W-2) income if you actively participate and your MAGI is under $100k (phasing out to $0 by $150k); unused losses carry forward. On sale, claimed depreciation is recaptured at up to 25%, and gains may owe capital-gains tax (a 1031 exchange can defer both). Figures are a year-1 estimate at your 24.0% rate — not tax advice; consult a CPA.
Schools (NCES district)
- District
- Fort Bend ISD
- NCES district ID
- 4819650
- Math proficiency
- 44% ▼ -15.00%
- Reading proficiency
- 53% ▼ -4.00%
- Median HH income
- $82,360
- Composite
- 44.61/100
- National rank
- #2779
- State rank
- #140 of 826 in TX
Livability — Missouri City
- Score
- 67/100
- State rank
- #526
- US rank
- #10308
Category grades
Schools grade is shown separately in the Schools card above.
Census & demographics
- Census place
- Missouri City, TX
- County
- Fort Bend County · 836,777 people
- City population
- 123,513
- Metro
- Houston-The Woodlands-Sugar Land, TX
- Population (ZIP)
- 39,292
- Household income
- $74,689
- Rent vs Own
- Severe rent burden
- 1121.0
Population outlook (Fort Bend County) Hauer SSP2
- Today (2025)
- 1,004,526 people
- By 2030
- 1,153,104 · +14.8%
- By 2040
- 1,453,718 · +44.7%
- By 2050
- 1,753,781 · +74.6%
- By 2075
- 2,455,772 · +144.5%
- By 2100
- 2,930,528 · +191.7%
Race, ethnicity, and origin ACS 2023
- Neighborhood character
- Majority Black (60%)
- Race & ethnicity
- Black 60% Hispanic / Latino 29% Two or more races 13% White 4% Asian 3%
- Hispanic origin (detail)
- Mexican 17%
- Foreign-born
- 16% · Canada, Vietnam
- Languages at home
- 73% English-only · Spanish 22% Vietnamese 1% Other Asian/Pacific 1%
Political lean MEDSL · Fort Bend
- 2024 margin
- Toss-up / Even · D 49.5% · R 47.9% · Other 2.6%
- 2008→2024 swing
- +4.0pp toward D · 2008: -2.4pp · 2024: 1.6pp
- All cycles
- 2024: D+1.6 2020: D+10.6 2016: D+6.6 2012: R+6.8 2008: R+2.4
Not yet ingested
- Civics
- —
Market trends
- HPI YoY
- ▼ -0.55%
- Current HPI
- 288.1306
- Rent YoY
- ▲ 0.34%
- Metro
- Houston-The Woodlands-Sugar Land, TX
- State GDP YoY
- ▲ 3.95%
- F500 in state
- 110
Industry mix (Fortune 500 HQ in TX)
| Industry | F500 HQs | Revenue |
|---|---|---|
| Energy | 16 | $1,198B |
|
||
| Technology | 5 | $198B |
|
||
| Engineering / Construction | 4 | $72B |
|
||
| Energy Services | 3 | $60B |
|
||
| Utilities | 3 | $41B |
|
||
| Healthcare | 2 | $330B |
|
||
Price history
-4.1% since first listed11 events — show timeline
- 2026-04-17 Pending — HARMLS
- 2026-04-13 Pending — HARMLS
- 2026-04-03 Price Changed $235,000 HARMLS
- 2025-12-30 Listed $254,000 HARMLS
- 2022-02-21 Listing Removed — HARMLS
- 2022-02-09 Relisted — HARMLS
- 2022-02-03 Price Changed $2,270 RENT.
- 2022-01-30 Pending — HARMLS
- 2021-12-21 Listed $245,000 HARMLS
- 2012-10-04 Sold (Public Records) — Public Records
- 1999-11-12 Sold (Public Records) — Public Records
Property tax history
+4.8%/yrLatest (2025): $5,121 · -8.3% YoY. Source: county tax records.
Cash-flow waterfall
monthlySold comps — $/sqft
last 12 mo · ≤1 miLoading sold comps…