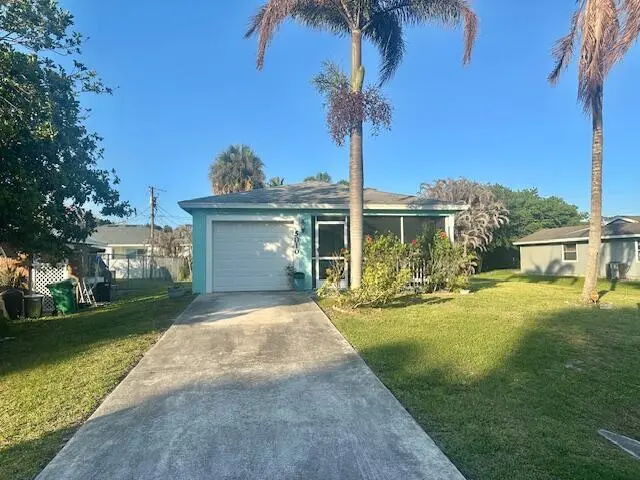
5010 Birch Dr · Indian River Estates, FL
Flood risk 1/10 · Minimal
- FEMA flood zone
- X (unshaded)
- Chance of flooding over 30 yrs
- 0.0%
- Est. flood insurance / yr
- $507 – $1,088
Fire risk 3/10 · Minor
- Est. fire insurance / yr
- $947 – $1,759
Heat risk 10/10 · Severe
- Hot days now (above 106°F)
- 7 days/yr
- Hot days in 30 yrs
- 25 days/yr
Wind risk 10/10 · Severe
- Chance of severe wind over 30 yrs
- 99.0%
Air-quality risk 2/10 · Minimal
- Unhealthy air days now
- 1 days/yr
- Unhealthy air days in 30 yrs
- 1 days/yr
Risk factors via First Street. Map © Google.
Why this score? — see what drove the D- grade
The composite is a weighted blend of 9 inputs, each scored 0–100. Each bar is that input's sub-score; the figure is the points it added to the 100-point composite (weight × sub-score).
- Cash flow +11.7/30.0
- ARV discount +7.9/15.0
- Rent growth +4.4/5.0
- Schools +3.7/10.0
- DSCR +3.4/10.0
- Livability +3.2/5.0
- Condition / age +2.5/5.0
- 1% rule +2.1/10.0
- Appreciation +0.0/10.0
$315,000
🖨 Deal sheet 📄 Offer letter ✓ Due diligence
Listing remarks
Cute cozy home in the heart of Indian River Estates! NO HOA. Built in 2012, this home has many upgrades and amenities throughout including stainless steel appliances, private screened porch and beautiful nature filled rear yard with plenty of room for a pool. Walk across the street to gorgeous park with scenic lakes, patio tables, walking & bike trails and playground. Centrally located close to restaurants, highways and shopping.
Key facts
- Walking bike trails
- Private screen porch
- Playground
Tags
Property features AI
Finance
- Financial info: No land lease
Exterior
- Parking: Attached garage (1 space); Detached carport; Driveway; Covered parking (1 space)
- Utilities: Public water; Public sewer; Sewer connected; Water available
- Home design: Single-family residence; One story; Resale property; Faces north; Solar energy generation
- Construction: Stucco and CBS construction; Shingle roof
- Exterior features: Screened porch; Porch; Fenced backyard
Interior
- Kitchen: Disposal; Dishwasher; Electric range; Microwave; Refrigerator
- Bedrooms: One bedroom on the main level
- Flooring: Carpet; Tile; Wood
- Bathrooms: Two full bathrooms; One bathroom on the main level
- Heating & cooling: Central heating; Central air; Ceiling fan(s)
- Interior features: Built-in features; Kitchen island; Blinds; Sliding windows
- Laundry & utility: Laundry room
Neighborhood map
What this means for you Summary
Snapshot
- This is a 3-bed/2.0-bath single-family listed at $315k.
Deal economics
- At list price, monthly cash flow is $-95 ($-1k/yr) — negative.
- To cash-flow at today's rent, offer at most $298k (5.3% below list).
- To meet the 1% rule (rent ≥ 1% of price), the offer needs to be $225k (28.7% below list).
- Recommended offer: $225k (28.7% below list) — sets the bar for 1% rule.
Location & tenants
- Location reads 65/100 on livability (#653 in FL) — a middle-class / working-renter tenant base. Strengths: cost of living A+, housing A+, crime B+; Watch: employment D+, schools F, amenities F.
- St. Lucie (urban): math 40% / reading 48% proficiency, ranked #51 of 73 in FL (top 70%) — families likely to look elsewhere, expect single-tenant / working-renter base with shorter leases.
- Market conditions: Rents rising fast (+7.4%/yr); 336 active listings in the ZIP; 10 comparable units currently listed for rent nearby; rentals at typical pace (median 23d on market — plan ~3-4 weeks tenant-placement turnaround); 4,868 units permitted in St. Lucie County in 2024 (268 in 5+ unit buildings).
- At $2,246/mo this rent would consume 50% of the median local household income ($54k/yr) (locally 1086% of renters already pay >50% of income on rent) — very limited rent-growth headroom before tenants either downsize or default.
Forward outlook
- Local home prices are declining (-3.0%/yr); year-one equity from $2k of loan paydown is wiped out by about $9k of value loss. Plan a longer hold.
- St. Lucie County population projected at +20% by 2050 — long-run rental-demand tailwind backs the buy-and-hold thesis.
Negotiation context
- It's been on market 53 days — a 3% lower offer ($306k) is reasonable based on typical stale-listing flexibility.
- 7 sale attempts since 24y ago; this cycle's ask has dropped $34k (10%) from the opening price — seller is motivated, your offer sets the floor, not the list.
- Current owner paid $50k; list at $315k implies a 536% gain — meaningful room to come down on a strong offer.
Risks & watch-outs
- Climate carrying-cost: severe wind risk, 99% chance of damaging wind over 30y; extreme-heat days projected 7→25/yr by 2055 (HVAC capex compounding) — expect insurance premiums to compound above CPI over the hold.
Questions for the listing agent
- What do current leases actually rent for vs. the listed asking? Can we see a recent rent roll and the last 12 months of T-12 income?
- It's been on market 53 days. Have you received any prior offers? Is the seller open to a 29% concession, seller financing, or rate buy-down credit?
- Is there a deadline driving the sale (1031 exchange, divorce, estate, relocation)? That informs how much negotiation room exists.
- Schools are F-rated, which usually means shorter tenancies and higher turnover. Who's the typical renter profile here, and what's been the actual vacancy rate?
- The area grade is low — what's the realistic commute time and amenity access for the typical tenant pool here? Any planned neighborhood developments (good or bad) we should know about?
- What's the average days-on-market for RENTAL listings here right now (not sales)? A rising rental-DOM trend means longer vacancies and softer asking-rent achievability than the comps imply.
- What's the recent tenant-quality profile in this submarket — average credit score on applications, eviction rate, late-payment / NSF rate, and stable-employment percentage? A property-management company in the area should have these aggregated.
- How much new for-sale + rental construction is in the pipeline within 1–3 miles? Heavy new supply typically softens prices + rents 12–24 months out; constrained supply supports both.
Investment metrics
- 1% rule
- 0.71% ✗
- Cap rate
- 5.93%
- Cash-on-cash
- -1.29%
- DSCR
- 0.94
- GRM
- 11.7
CMA / ARV
- ARV (on-the-fly)
- $317,898
- Comps found
- 8
Show comp detail 8 sales within ~0.75 mi
| Address | Dist | Beds/Ba | Sqft | Sold | Price | $/sf | Match |
|---|---|---|---|---|---|---|---|
| 5505 Myrtle Dr | 0.60mi | 3/2.0 | 1,206 (-1%) | 1mo | $369,900 | $307 | 69 |
| 5207 Birch Dr | 0.23mi | 3/2.0 | 1,092 (-10%) | 4mo | $285,000 | $261 | 69 |
| 5409 Sunset Blvd | 0.52mi | 2/2.0 (-1) | 1,184 (-3%) | 5mo | $255,000 | $215 | 62 |
| 5406 Sunset Blvd | 0.52mi | 3/2.0 | 1,320 (+8%) | 1mo | $255,000 | $193 | 61 |
| 4711 Myrtle Dr | 0.37mi | 3/1.5 | 1,194 (-2%) | 21mo | $285,000 | $239 | 60 |
| 5502 Hickory Dr | 0.58mi | 2/2.0 (-1) | 1,174 (-4%) | 11mo | $290,000 | $247 | 53 |
| 5406 Myrtle Dr | 0.51mi | 3/2.0 | 1,334 (+10%) | 23mo | $350,000 | $262 | 41 |
| 5413 Palm Dr | 0.55mi | 2/2.0 (-1) | 1,066 (-12%) | 24mo | $280,000 | $263 | 29 |
Match score weights: distance 35% · size 25% · config 20% · recency 20%. Top-matched comps best support the ARV.
Projected returns pro-forma
-3.0% appreciation · 7.42% rent growth · sell at horizon
- IRR
- -14.3%
- Equity multiple
- 0.47×
- Total profit
- $-46,798
- Equity at exit
- $46,968
- IRR
- -0.3%
- Equity multiple
- 0.97×
- Total profit
- $-2,234
- Equity at exit
- $27,235
Cash invested: $88,200 (down + closing). Projections, not guarantees.
Landlord ↔ Tenant lean methodology
- Overall (STATE)
- 87 Strongly Landlord-Friendly
- State Florida
- 87 Strongly Landlord-Friendly · R+3
- County
- — inherits STATE
- City
- — inherits STATE
ZIP-level market 34982
- Home prices YoY
- -33.4%
- Rents YoY
- 7.4%
- Active inventory
- 336
- Price-to-rent
- 11.7×
Monthly cashflow live
- Estimated rent
- $2,246 high interval (Pro) →
- Mortgage (P&I)
- −$1,652
- Tax from tax record
- −$86 /mo · $1,036/yr
- Insurance
- −$131
- HOA
- −$0
- Vacancy / Maint / Mgmt
- −$472
- Net cashflow
- $-95
Break-even live
UW: 25.0% down · 7.5% · 30yr · 1.5% tax · 5.0% vac · 8.0% maint · 8.0% mgmt
Financing live
Cash to close
- Down payment
- $78,750
- Closing costs
- $9,450
- Reserves months
- —
- Total cash needed
- —
Loan-product check · same deal, 3 products live
Conventional
25% down · 7.5% · 30yr
- Down + closing
- —
- Monthly P&I
- —
- Monthly cashflow
- —
- DSCR
- —
- Eligible?
- —
Personal DTI + credit; lowest rate.
DSCR
20% down · 8.5% · 30yr
- Down + closing
- —
- Monthly P&I
- —
- Monthly cashflow
- —
- DSCR
- —
- Eligible?
- —
No personal income docs; deal must DSCR.
Hard money
10% down · 12.0% · 12mo
- Down + closing
- —
- Monthly P&I
- —
- Monthly cashflow
- —
- DSCR
- —
- Eligible?
- —
Short-term bridge; refi at stabilization.
Rent comps 10 comps
| Address | Beds | Baths | Sqft | Rent | $/sqft | DOM | Units | Dist |
|---|---|---|---|---|---|---|---|---|
| 5300 Seagrape Dr Fort Pierce, FL | 3.0 | 2.0 | 1300 | $2,450 | $1.88 | 23d | 1 | 0.36mi |
| 5315 Hickory Dr Fort Pierce, FL | 3.0 | 2.0 | 1400 | $2,045 | $1.46 | 23d | 1 | 0.41mi |
| 330 Borraclough St Fort Pierce, FL | 3.0 | 2.0 | 1404 | $2,175 | $1.55 | 13d | 1 | 0.75mi |
| 341 Ashley St Fort Pierce, FL | 3.0 | 2.0 | 1128 | $2,460 | $2.18 | 23d | 1 | 0.82mi |
| 4210 Gator Trace Cir Fort Pierce, FL | 2.0 | 2.0 | 1316 | $2,100 | $1.60 | 13d | 1 | 0.84mi |
| 352 Johnston St Fort Pierce, FL | 3.0 | 2.0 | 936 | $2,100 | $2.24 | 23d | 1 | 0.87mi |
| 355 Johnston St Fort Pierce, FL | 3.0 | 1.5 | 1118 | $2,500 | $2.24 | 23d | 1 | 0.89mi |
| 203 Melton Dr Unit B Fort Pierce, FL | 2.0 | 1.0 | 1200 | $1,800 | $1.50 | 23d | 1 | 1.03mi |
| 4215 Gator Trace Ave Unit G Fort Pierce, FL | 2.0 | 2.0 | 1200 | $2,200 | $1.83 | 23d | 1 | 1.18mi |
| 4166 Gator Trace Villas Cir Unit B Fort Pierce, FL | 3.0 | 2.0 | 1336 | $2,200 | $1.65 | 23d | 1 | 1.31mi |
Listing history 38 events
-
2026-06-18days on market $315,000 Active 53 DOM
-
2026-06-17days on market $315,000 Active 52 DOM
-
2026-06-16days on market $315,000 Active 51 DOM
-
2026-06-15days on market $315,000 Active 50 DOM
-
2026-06-14days on market $315,000 Active 48 DOM
-
2026-06-13days on market $315,000 Active 47 DOM
-
2026-06-10days on market $315,000 Active 45 DOM
-
2026-06-09days on market $315,000 Active 44 DOM
-
2026-06-08days on market $315,000 Active 43 DOM
-
2026-06-07days on market $315,000 Active 42 DOM
-
2026-06-05days on market $315,000 Active 39 DOM
-
2026-06-03days on market $315,000 Active 38 DOM
-
2026-06-02days on market $315,000 Active 37 DOM
-
2026-06-01days on market $315,000 Active 36 DOM
-
2026-05-31days on market $315,000 Active 35 DOM
-
2026-05-30days on market $315,000 Active 34 DOM
-
2026-05-24price $315,000
-
2026-05-06price $339,000
-
2026-04-26$349,000 Active
-
2026-04-24historical
-
2026-04-08$359,000 Active
-
2026-03-31historical
-
2026-01-11price $330,000
-
2025-11-30price $355,000
-
2025-11-01price $358,000
-
2025-09-26$359,999 Active
-
2014-10-20historical
-
2010-07-09soldstatus $49,500
-
2010-06-07historical
-
2010-05-14$49,900
-
2006-01-12soldstatus $189,900
-
2006-01-06soldstatus $189,900
-
2005-07-06$189,900
-
2005-07-06$189,900
-
2002-04-22soldstatus $74,900
-
2002-04-17soldstatus $74,900
-
2002-02-13historical
-
2002-02-01$73,900
ⓘ Source: listings_history table (triggers on properties + properties_extension) + one-shot
backfill from property_details.listing_events for pre-trigger history.
Tax reassessment forecast FL · Resets to sale price
- Current annual tax
- $1,036 · $86/mo
- Projected year-2 tax
- $2,614 · $218/mo
- Expected delta
- +$1,579/yr (+$132/mo · 152.4%)
ⓘ Screening estimate from a state-policy table — verify with the county assessor before closing.
Climate risk First Street
- Flood 1/10 Low FEMA zone X (unshaded) · 0% chance over 30 yrs
- Wildfire 3/10 Moderate
- Heat 10/10 Extreme 7 d/yr ≥106°F today · 25 d/yr by 30 yrs out
- Wind 10/10 Extreme 99% chance of damaging wind over 30 yrs
- Air quality 2/10 Low 1 unhealthy d/yr today · 1 by 30 yrs out
Nearby sold comps map
Loading sold comps map…
Walkable amenities ~0.75 mi
Loading nearby amenities…
Taxation est. · year 1
- Rental income
- $26,958
- − Mortgage interest
- −$17,645
- − Property taxes
- −$1,036
- − Insurance
- −$1,575
- − Repairs & maintenance
- −$2,157
- − Management
- −$2,157
- − Depreciation
- −$9,164
- Taxable loss
- −$6,775
- Est. tax savings @ 24.0%
- +$1,626
- After-tax cash flow
- $489/yr
For passive investors: Depreciation is non-cash, so a rental often shows a tax loss while cash-flowing — sheltering income. Rental losses are passive: they offset passive income freely, and up to $25,000/yr can offset ordinary (W-2) income if you actively participate and your MAGI is under $100k (phasing out to $0 by $150k); unused losses carry forward. On sale, claimed depreciation is recaptured at up to 25%, and gains may owe capital-gains tax (a 1031 exchange can defer both). Figures are a year-1 estimate at your 24.0% rate — not tax advice; consult a CPA.
Schools (NCES district)
- District
- St. Lucie
- NCES district ID
- 1201770
- Math proficiency
- 40% ▼ -11.00%
- Reading proficiency
- 48% ▼ -4.00%
- Median HH income
- $44,737
- Composite
- 37.28/100
- National rank
- #4449
- State rank
- #51 of 73 in FL
Livability — Indian River Estates
- Score
- 65/100
- State rank
- #653
- US rank
- #12946
Category grades
Schools grade is shown separately in the Schools card above.
Census & demographics
- Census place
- Indian River Estates, FL
- County
- Saint Lucie County · 337,150 people
- City population
- 27,447
- Metro
- Port St. Lucie, FL
- Population (ZIP)
- 31,143
- Household income
- $54,082
- Rent vs Own
- Severe rent burden
- 1086.0
Population outlook (St. Lucie County) Hauer SSP2
- Today (2025)
- 338,016 people
- By 2030
- 355,687 · +5.2%
- By 2040
- 385,521 · +14.1%
- By 2050
- 406,106 · +20.1%
- By 2075
- 441,054 · +30.5%
- By 2100
- 436,885 · +29.2%
Race, ethnicity, and origin ACS 2023
- Neighborhood character
- Majority White (62%)
- Race & ethnicity
- White 62% Hispanic / Latino 22% Two or more races 12% Black 12%
- Hispanic origin (detail)
- Mexican 10% Puerto Rican 3% Cuban 3%
- Common ancestry
- Italian 7% Hispanic 2% Lithuanian 1%
- Foreign-born
- 12% · Canada
- Languages at home
- 80% English-only · Spanish 16% French/Haitian/Cajun 3%
Political lean MEDSL · St. Lucie
- 2024 margin
- Lean R (+9.1) · D 45.1% · R 54.2%
- 2008→2024 swing
- -21.2pp toward R · 2008: 12.1pp · 2024: -9.1pp
- All cycles
- 2024: R+9.1 2020: R+1.6 2016: R+2.5 2012: D+7.9 2008: D+12.1
Not yet ingested
- Civics
- —
Market trends
- HPI YoY
- ▼ -199.47%
- Current HPI
- 397.2649
- Rent YoY
- ▲ 7.42%
- Metro
- Port St. Lucie, FL
- State GDP YoY
- ▲ 3.28%
- F500 in state
- 36
Industry mix (Fortune 500 HQ in FL)
| Industry | F500 HQs | Revenue |
|---|---|---|
| Industrial Technology | 2 | $29B |
|
||
| Insurance | 2 | $17B |
|
||
| Retail | 1 | $60B |
|
||
| Technology Distribution | 1 | $58B |
|
||
| Homebuilding | 1 | $35B |
|
||
| Technology Manufacturing | 1 | $35B |
|
||
Price history
+326.3% since first listed22 events — show timeline
- 2026-05-24 Price Changed $315,000 Beaches MLS
- 2026-05-06 Price Changed $339,000 Beaches MLS
- 2026-04-26 Listed $349,000 Beaches MLS
- 2026-04-24 Listing Removed — Stellar MLS as Distributed by MLS Grid
- 2026-04-08 Listed $359,000 Stellar MLS as Distributed by MLS Grid
- 2026-03-31 Listing Removed — Stellar MLS as Distributed by MLS Grid
- 2026-01-11 Price Changed $330,000 Stellar MLS as Distributed by MLS Grid
- 2025-11-30 Price Changed $355,000 Stellar MLS as Distributed by MLS Grid
- 2025-11-01 Price Changed $358,000 Stellar MLS as Distributed by MLS Grid
- 2025-09-26 Listed $359,999 Stellar MLS as Distributed by MLS Grid
- 2014-10-20 Listing Removed — Beaches MLS
- 2010-07-09 Sold (MLS) $49,500 Beaches MLS
- 2010-06-07 Listing Removed — Beaches MLS
- 2010-05-14 Listed $49,900 Beaches MLS
- 2006-01-12 Sold (Public Records) $189,900 Public Records
- 2006-01-06 Sold (MLS) $189,900 MCRTC
- 2005-07-06 Listed $189,900 MCRTC
- 2005-07-06 Listed $189,900 Beaches MLS
- 2002-04-22 Sold (Public Records) $74,900 Public Records
- 2002-04-17 Sold (MLS) $74,900 Beaches MLS
- 2002-02-13 Listing Removed — Beaches MLS
- 2002-02-01 Listed $73,900 Beaches MLS
Property tax history
+1.4%/yrLatest (2025): $1,036 · +13.2% YoY. Source: county tax records.
Cash-flow waterfall
monthlySold comps — $/sqft
last 12 mo · ≤1 miLoading sold comps…