 Duplex
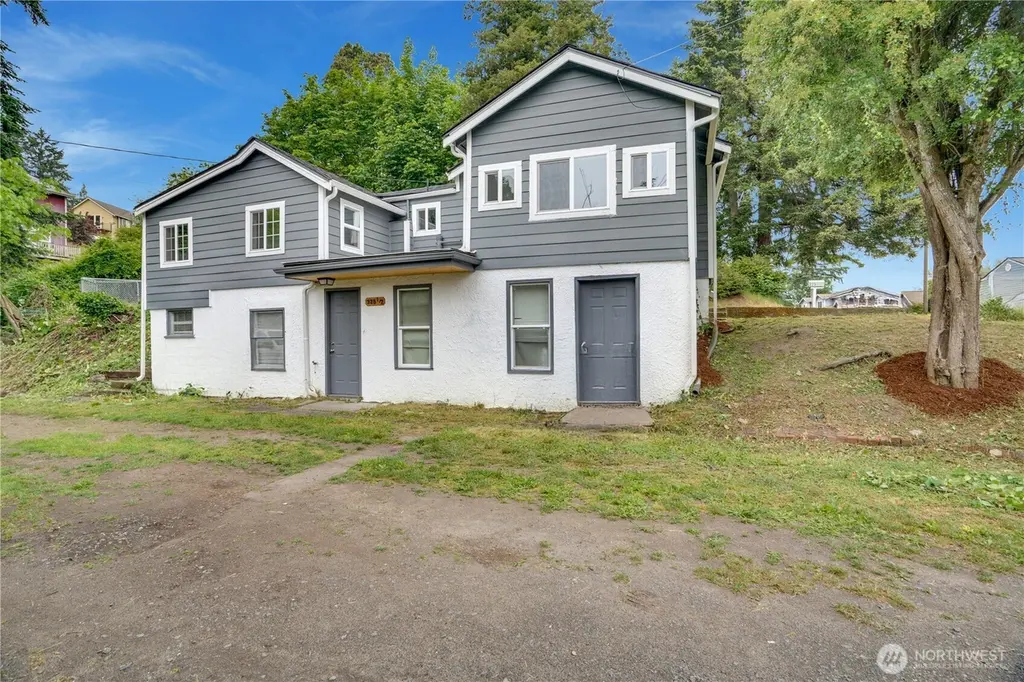
325 N Cambrian · Bremerton, WA
Flood risk 1/10 · Minimal
- FEMA flood zone
- X (unshaded)
- Chance of flooding over 30 yrs
- 0.0%
- Est. flood insurance / yr
- $473 – $860
Fire risk 1/10 · Minimal
- Est. fire insurance / yr
- $604 – $1,122
Heat risk 4/10 · Minor
- Hot days now (above 86°F)
- 7 days/yr
- Hot days in 30 yrs
- 14 days/yr
Wind risk 1/10 · Minimal
- Chance of severe wind over 30 yrs
- —
Air-quality risk 7/10 · Major
- Unhealthy air days now
- 10 days/yr
- Unhealthy air days in 30 yrs
- 10 days/yr
Risk factors via First Street. Map © Google.
Why this score? — see what drove the D grade
The composite is a weighted blend of 9 inputs, each scored 0–100. Each bar is that input's sub-score; the figure is the points it added to the 100-point composite (weight × sub-score).
- Cash flow +15.6/30.0
- ARV discount +7.5/15.0
- DSCR +4.8/10.0
- Livability +4.3/5.0
- Schools +3.9/10.0
- 1% rule +3.5/10.0
- Rent growth +2.6/5.0
- Condition / age +2.5/5.0
- Appreciation +0.0/10.0
$429,000
🖨 Deal sheet (PDF) 📄 Offer letter ✓ Due diligence
Multi-family units
County records classify this as Multi-Family (2-4 Unit). Listing-text estimate: 2 units. confirmed
Listing remarks
Excellent investment opportunity with owner-occupant flexibility and future upside. This duplex sits on a large lot with potential for at least one DADU, creating even more income potential or re-sale value down the road. Each unit offers 2 bedrooms and 1 bathroom, with recent updates including newer vinyl windows, waterproof flooring, fresh interior paint, updated fixtures, new exterior door, chain link fencing, and slope-support between backyards to ensure tenant safety. The lower unit is occupied by a long-term tenant who would love to stay, providing immediate rental stability. Extensive off-street parking and two separate garages add convenience and value for both tenants and owners. I
Key facts
- Newer vinyl windows
- Waterproof flooring
- Large lot
Tags
Property features AI
Finance
- Financial info: Gross scheduled income: $43,200 annually; Gross adjusted income: $43,200; Total monthly income: $3,600; Net operating income: $37,337; Total expenses: $5,863.30; Insurance expense: $2,534; Gross rent multiplier: 9.9; Actual rents reported: Unit 325 $1,850; Unit 325 1/2 $1,750; Financing accepted: Cash, Conventional, FHA, VA
Exterior
- Parking: Three covered spaces; Three carport spaces; Ten uncovered parking spaces
- Utilities: Electric service; Public water (Bremerton Utility); Sewer connected (Bremerton Utility); Power by PSE; Water/sewer/garbage fee listed
- Home design: Duplex (residential income, multi-family); Two stories
- Construction: Cement plank and wood construction; Composition roof
- Exterior features: Cement plank and wood exterior; Wood products detailing; Paved lot
Interior
- Kitchen: Each unit has a range/oven; Each unit has a refrigerator; No units list a dishwasher
- Bedrooms: Two 2-bedroom units (Unit 325 and Unit 325 1/2)
- Flooring: Vinyl plank
- Bathrooms: Each unit has 1 bathroom
- Heating & cooling: Baseboard heating; No central cooling
- Interior features: Vinyl plank flooring; Baseboard heating
- Laundry & utility: Units do not include washer/dryer (no in-unit laundry)
Neighborhood map
What this means for you Summary
Snapshot
- This is a 2 × 2-bed/1.0-bath units multifamily listed at $429k.
Deal economics
- At list price, monthly cash flow is $180 ($2k/yr) — positive. Per door: $90/mo.
- The deal already cash-flows at list — no discount required.
- To meet the 1% rule (rent ≥ 1% of price), the offer needs to be $363k (15.3% below list).
- Recommended offer: $363k (15.3% below list) — sets the bar for 1% rule.
- Cap rate 6.8% vs local median 3.5% in Bremerton — top-decile yield for the area; either an underpriced asset or a hidden risk that comps aren't pricing in. Stress-test before assuming the spread holds.
Location & tenants
- Location reads 86/100 on livability (#22 in WA, #431 nationally) — a professional / high-income tenant draw. Strengths: amenities A+, commute A+, housing A+; Watch: crime F.
- Bremerton School District (urban): math 36% / reading 51% proficiency, ranked #194 of 291 in WA (top 67%) — families likely to look elsewhere, expect single-tenant / working-renter base with shorter leases.
- Zoned schools: West Hills S.T.E.M. Academy (313 students, 74% FRL); Mountain View Middle School (844 students, 71% FRL); Bremerton High School (1,221 students, 66% FRL) — zoned schools average 70% FRL vs 55% district-wide (15 pts higher); higher-poverty schools than district average — tighter screening recommended.
- Market conditions: Rents flat; 352 active listings in the ZIP; 15 comparable units currently listed for rent nearby; rentals lingering (median 46d on market — plan ~5-8 weeks vacancy on turnover, expect pricing pressure); 53% of comp listings sitting > 30 days — soft ceiling on asking rent; solid renter incomes; 1,294 units permitted in Kitsap County in 2024 (302 in 5+ unit buildings).
- At $3,632/mo this rent would consume 48% of the median local household income ($90k/yr) (locally 993% of renters already pay >50% of income on rent) — very limited rent-growth headroom before tenants either downsize or default.
Forward outlook
- Local home prices are declining (-3.0%/yr); year-one equity from $3k of loan paydown is wiped out by about $13k of value loss. Plan a longer hold.
- Kitsap County population projected at +8% by 2050 — modest demand growth; plan on rents tracking national, not racing it.
Negotiation context
- Only 5 days on market — expect competitive offers; lowballing is unlikely to land.
- 7 sale attempts since 24y ago with the ask held roughly flat each time — persistent listings suggest the price (not the market) is what's stuck; bring a comps-based counter.
- Current owner paid $245k; list at $429k implies a 75% gain — meaningful room to come down on a strong offer.
Risks & watch-outs
- Watch-outs: built in 1939 — expect roof / HVAC / electrical / plumbing capex.
Questions for the listing agent
- Can we see the unit-by-unit rent roll, current vacancy, and any below-market leases? What's the average tenancy length?
- What capital expenditures (roof, boiler, parking lot, exteriors) have been made in the last 5 years, and what's planned in the next 2?
- Built in 1939 — when were the roof, HVAC, electrical panel, plumbing, and water heater last replaced?
- Is there a deadline driving the sale (1031 exchange, divorce, estate, relocation)? That informs how much negotiation room exists.
- Schools are B-rated — typically a magnet for longer-tenancy family renters. What's the average tenant stay here, and is there a school-zone premium baked into asking?
- Crime grade is F in this area — have there been break-ins, vandalism, or insurance claims at this property in the last 3 years? What carrier currently insures it and at what premium?
- The area grade is low — what's the realistic commute time and amenity access for the typical tenant pool here? Any planned neighborhood developments (good or bad) we should know about?
- What's the average days-on-market for RENTAL listings here right now (not sales)? A rising rental-DOM trend means longer vacancies and softer asking-rent achievability than the comps imply.
- What's the recent tenant-quality profile in this submarket — average credit score on applications, eviction rate, late-payment / NSF rate, and stable-employment percentage? A property-management company in the area should have these aggregated.
- How much new apartment / multifamily construction is in the pipeline within 1–3 miles? Heavy new supply (>2% of stock underway) typically softens rents 12–24 months out; light construction supports rent growth.
Investment metrics
- 1% rule
- 0.85% ✗
- Cap rate
- 6.80%
- Cash-on-cash
- 1.80%
- DSCR
- 1.08
- GRM
- 9.8
CMA / ARV
No comps found within radius.
Projected returns pro-forma
-3.0% appreciation · 0.28% rent growth · sell at horizon
- IRR
- -16.3%
- Equity multiple
- 0.44×
- Total profit
- $-67,852
- Equity at exit
- $63,965
- IRR
- -13.2%
- Equity multiple
- 0.31×
- Total profit
- $-82,404
- Equity at exit
- $37,092
Cash invested: $120,120 (down + closing). Projections, not guarantees.
Landlord ↔ Tenant lean methodology
- Overall (STATE)
- 28 Tenant-Leaning
- State Washington
- 28 Tenant-Leaning · D+8
- County
- — inherits STATE
- City
- — inherits STATE
ZIP-level market 98312
- Rents YoY
- 0.3%
- Active inventory
- 352
- Price-to-rent
- 19.7×
Monthly cashflow live
- Estimated rent
- $3,632 high interval (Pro) →
- Mortgage (P&I)
- −$2,250
- Tax from tax record
- −$261 /mo · $3,131/yr
- Insurance
- −$179
- HOA
- −$0
- Vacancy / Maint / Mgmt
- −$763
- Net cashflow
- $180
Break-even live
Sensitivity live
| Price | -10% $423 | -5% $301 | +0% $180 | +5% $58 | +10% $-63 |
|---|---|---|---|---|---|
| Rent | -10% $-107 | -5% $36 | +0% $180 | +5% $323 | +10% $467 |
| Rate | -1.0pp $396 | -0.5pp $289 | base $180 | +0.5pp $69 | +1.0pp $-44 |
2-unit breakdown (identical units grouped — click to expand)
| Units | Beds | Baths | Est. rent |
|---|---|---|---|
| 2× units | 2 | 1 | $3,632 |
| #1 | 2 | 1 | $1,816 |
| #2 | 2 | 1 | $1,816 |
| Total (2 units) | $3,632 | ||
UW: 25.0% down · 7.5% · 30yr · 1.5% tax · 5.0% vac · 8.0% maint · 8.0% mgmt
Financing live
Cash to close
- Down payment
- $107,250
- Closing costs
- $12,870
- Reserves months
- —
- Total cash needed
- —
Loan-product check · same deal, 3 products live
Conventional
25% down · 7.5% · 30yr
- Down + closing
- —
- Monthly P&I
- —
- Monthly cashflow
- —
- DSCR
- —
- Eligible?
- —
Personal DTI + credit; lowest rate.
DSCR
20% down · 8.5% · 30yr
- Down + closing
- —
- Monthly P&I
- —
- Monthly cashflow
- —
- DSCR
- —
- Eligible?
- —
No personal income docs; deal must DSCR.
Hard money
10% down · 12.0% · 12mo
- Down + closing
- —
- Monthly P&I
- —
- Monthly cashflow
- —
- DSCR
- —
- Eligible?
- —
Short-term bridge; refi at stabilization.
Rent comps 15 comps
| Address | Beds | Baths | Sqft | Rent | $/sqft | DOM | Units | Dist |
|---|---|---|---|---|---|---|---|---|
| 2318 10th St Bremerton, WA | 3.0 | 1.0 | 1840 | $1,900 | $1.03 | 45d | 1 | 0.37mi |
| 341 Bertha Ave Bremerton, WA | 3.0 | 2.0 | 1614 | $2,595 | $1.61 | 15d | 1 | 0.42mi |
| 1919 5th St Bremerton, WA | 3.0 | 1.0 | 1521 | $2,399 | $1.58 | 23d | 1 | 0.53mi |
| 3202 Farragut Ave Unit 2 Bremerton, WA | 3.0 | 2.0 | 1226 | $2,450 | $2.00 | 23d | 1 | 0.56mi |
| 3202 Farragut Ave Unit 2 Bremerton, WA | 3.0 | 2.0 | 1226 | $2,450 | $2.00 | 45d | 1 | 0.56mi |
| 1117 Marguerite Ave Bremerton, WA | 3.0 | 2.5 | 1404 | $2,875 | $2.05 | 45d | 1 | 0.62mi |
| 1720 N Wycoff Ave Bremerton, WA | 3.0 | 2.0 | 1300 | $2,400 | $1.85 | 45d | 1 | 0.70mi |
| 4520 Bay Vista Blvd Bremerton, WA | 1.0–3.0 | 1.0–2.0 | 927 | $2,875 | $3.10 | 15d | 9 | 0.94mi |
| 4508 Sand Dollar St Bremerton, WA | 5.0 | 3.0 | 2175 | $3,195 | $1.47 | 23d | 1 | 0.95mi |
| 4535 Sand Dollar St Bremerton, WA | 3.0 | 2.0 | 1319 | $2,600 | $1.97 | 23d | 1 | 0.97mi |
| 4772 Deadwood St Bremerton, WA | 4.0 | 2.5 | 1843 | $2,950 | $1.60 | 45d | 1 | 1.01mi |
| 4114 McCall Blvd W Bremerton, WA | 3.0 | 2.0 | 1800 | $2,500 | $1.39 | 15d | 1 | 1.30mi |
| 1212 Evans Ave W Bremerton, WA | 3.0 | 1.5 | 1856 | $2,600 | $1.40 | 45d | 1 | 1.30mi |
| 1185 Shorewood Dr Bremerton, WA | 3.0 | 2.0 | 1528 | $2,500 | $1.64 | 45d | 1 | 1.32mi |
| 1216 Humphrey Ave W Bremerton, WA | 3.0 | 2.5 | 1800 | $2,799 | $1.55 | 45d | 1 | 1.36mi |
Listing history 23 events
-
2026-06-03status $429,000 Pending 5 DOM
-
2026-06-02days on market $429,000 Active 5 DOM
-
2026-06-01days on market $429,000 Active 4 DOM
-
2026-05-31days on market $429,000 Active 3 DOM
-
2026-05-30days on market $429,000 Active 2 DOM
-
2026-05-28$429,000 Active
-
2025-05-17historical $1,600
-
2025-05-02$1,600
-
2025-05-02historical $1,600
-
2025-05-02$1,600
-
2020-05-27soldstatus $245,000 Sold
-
2020-04-15status Pending Inspection
-
2020-03-29price $249,950
-
2020-02-25$289,950 Active
-
2006-06-01soldstatus $208,000
-
2006-05-31soldstatus $208,000
-
2006-01-26$208,500
-
2003-07-28soldstatus $111,200
-
2003-07-28soldstatus $111,200
-
2003-06-01$119,900
-
2003-02-13soldstatus $61,000
-
2003-02-12soldstatus $61,000
-
2002-12-06$59,900
ⓘ Source: listings_history table (triggers on properties + properties_extension) + one-shot
backfill from property_details.listing_events for pre-trigger history.
Tax reassessment forecast WA · Resets to sale price
- Current annual tax
- $3,131 · $261/mo
- Projected year-2 tax
- $4,204 · $350/mo
- Expected delta
- +$1,073/yr (+$89/mo · 34.3%)
ⓘ Screening estimate from a state-policy table — verify with the county assessor before closing.
Climate risk First Street
- Flood 1/10 Low FEMA zone X (unshaded) · 0% chance over 30 yrs
- Wildfire 1/10 Low
- Heat 4/10 Moderate 7 d/yr ≥86°F today · 14 d/yr by 30 yrs out
- Wind 1/10 Low
- Air quality 7/10 Severe 10 unhealthy d/yr today · 10 by 30 yrs out
Nearby sold comps map
Loading sold comps map…
Walkable amenities ~0.75 mi
Loading nearby amenities…
Taxation est. · year 1
- Rental income
- $43,584
- − Mortgage interest
- −$24,031
- − Property taxes
- −$3,131
- − Insurance
- −$2,145
- − Repairs & maintenance
- −$3,487
- − Management
- −$3,487
- − Depreciation
- −$12,480
- Taxable loss
- −$5,176
- Est. tax savings @ 24.0%
- +$1,242
- After-tax cash flow
- $3,401/yr
For passive investors: Depreciation is non-cash, so a rental often shows a tax loss while cash-flowing — sheltering income. Rental losses are passive: they offset passive income freely, and up to $25,000/yr can offset ordinary (W-2) income if you actively participate and your MAGI is under $100k (phasing out to $0 by $150k); unused losses carry forward. On sale, claimed depreciation is recaptured at up to 25%, and gains may owe capital-gains tax (a 1031 exchange can defer both). Figures are a year-1 estimate at your 24.0% rate — not tax advice; consult a CPA.
Schools (NCES district)
- District
- Bremerton School District
- NCES district ID
- 5300660
- Math proficiency
- 36% ▼ -3.00%
- Reading proficiency
- 51% ▲ 1.00%
- Median HH income
- $46,765
- Composite
- 39.34/100
- National rank
- #8163
- State rank
- #194 of 291 in WA
Livability — Bremerton
- Score
- 86/100
- State rank
- #22
- US rank
- #431
Category grades
Schools grade is shown separately in the Schools card above.
Census & demographics
- Census place
- Bremerton, WA
- County
- Kitsap County · 243,099 people
- City population
- 94,488
- Metro
- Bremerton-Silverdale-Port Orchard, WA
- Population (ZIP)
- 36,307
- Household income
- $90,449
- Rent vs Own
- Severe rent burden
- 993.0
Population outlook (Kitsap County) Hauer SSP2
- Today (2025)
- 277,525 people
- By 2030
- 285,040 · +2.7%
- By 2040
- 294,957 · +6.3%
- By 2050
- 300,622 · +8.3%
- By 2075
- 315,580 · +13.7%
- By 2100
- 304,340 · +9.7%
Race, ethnicity, and origin ACS 2023
- Neighborhood character
- Predominantly White (68%)
- Race & ethnicity
- White 68% Two or more races 13% Hispanic / Latino 12% Asian 4% Black 4% Native American 1%
- Hispanic origin (detail)
- Mexican 6% Puerto Rican 1%
- Common ancestry
- Italian 7% Portuguese 5% Slovak 4%
- Foreign-born
- 6% · Canada, China
- Languages at home
- 91% English-only · Spanish 4% Tagalog/Filipino 2% Other Asian/Pacific 1%
Political lean MEDSL · Kitsap
- 2024 margin
- Strong D (+20.9) · D 58.8% · R 37.9% · Other 3.3%
- 2008→2024 swing
- +8.6pp toward D · 2008: 12.3pp · 2024: 20.9pp
- All cycles
- 2024: D+20.9 2020: D+18.1 2016: D+11.6 2012: D+11.1 2008: D+12.3
Not yet ingested
- Civics
- —
Market trends
- HPI YoY
- ▼ -436.68%
- Current HPI
- 379.2342
- Rent YoY
- ▲ 0.28%
- Metro
- Bremerton-Silverdale-Port Orchard, WA
- State GDP YoY
- ▲ 4.65%
- F500 in state
- 22
Industry mix (Fortune 500 HQ in WA)
| Industry | F500 HQs | Revenue |
|---|---|---|
| Retail | 2 | $269B |
|
||
| Technology / Retail | 1 | $638B |
|
||
| Technology | 1 | $245B |
|
||
| Telecommunications | 1 | $38B |
|
||
| Food / Beverage | 1 | $36B |
|
||
| Automotive / Trucks | 1 | $34B |
|
||
Price history
+616.2% since first listed18 events — show timeline
- 2026-05-28 Listed $429,000 NWMLS as Distributed by MLS Grid
- 2025-05-17 Rental Removed $1,600 SHOWMOJO
- 2025-05-02 Listed for Rent $1,600 SHOWMOJO
- 2025-05-02 Rental Removed $1,600 SHOWMOJO2
- 2025-05-02 Listed for Rent $1,600 SHOWMOJO2
- 2020-05-27 Sold (MLS) $245,000 NWMLS as Distributed by MLS Grid
- 2020-04-15 Pending — NWMLS as Distributed by MLS Grid
- 2020-03-29 Price Changed $249,950 NWMLS as Distributed by MLS Grid
- 2020-02-25 Listed $289,950 NWMLS as Distributed by MLS Grid
- 2006-06-01 Sold (MLS) $208,000 NWMLS as Distributed by MLS Grid
- 2006-05-31 Sold (Public Records) $208,000 Public Records
- 2006-01-26 Listed $208,500 NWMLS as Distributed by MLS Grid
- 2003-07-28 Sold (Public Records) $111,200 Public Records
- 2003-07-28 Sold (MLS) $111,200 NWMLS as Distributed by MLS Grid
- 2003-06-01 Listed $119,900 NWMLS as Distributed by MLS Grid
- 2003-02-13 Sold (Public Records) $61,000 Public Records
- 2003-02-12 Sold (MLS) $61,000 NWMLS as Distributed by MLS Grid
- 2002-12-06 Listed $59,900 NWMLS as Distributed by MLS Grid
Property tax history
+3.1%/yrLatest (2026): $3,131 · +0.5% YoY. Source: county tax records.
Cash-flow waterfall
monthlySold comps — $/sqft
last 12 mo · ≤1 miLoading sold comps…