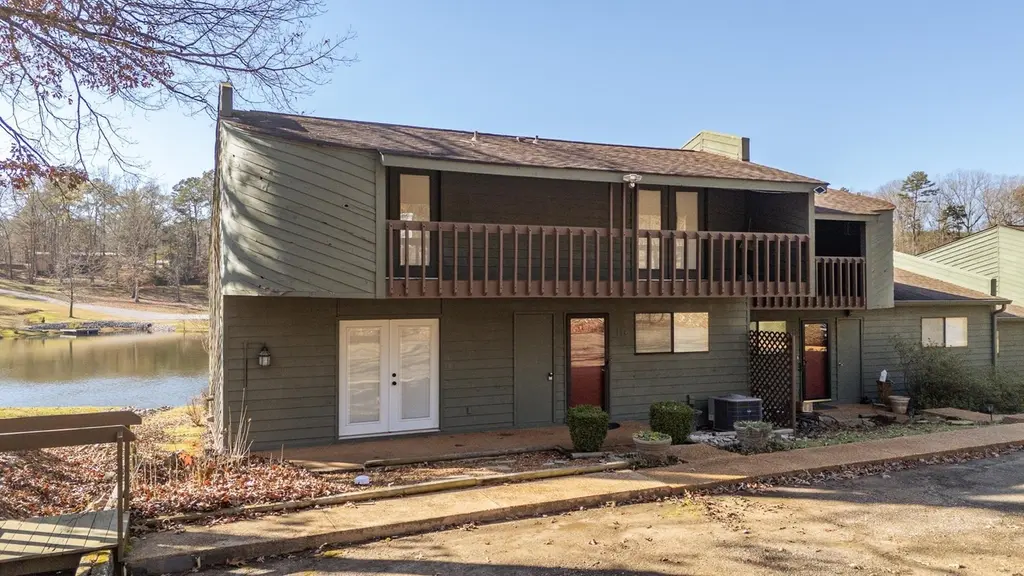
116 Driftwood Rd · Counce, TN
Flood risk 8/10 · Major
- FEMA flood zone
- X (unshaded)
- Chance of flooding over 30 yrs
- 0.99%
- Est. flood insurance / yr
- $507 – $1,088
Fire risk 4/10 · Minor
- Est. fire insurance / yr
- $949 – $1,763
Heat risk 6/10 · Moderate
- Hot days now (above 108°F)
- 7 days/yr
- Hot days in 30 yrs
- 20 days/yr
Wind risk 4/10 · Minor
- Chance of severe wind over 30 yrs
- 19.0%
Air-quality risk 1/10 · Minimal
- Unhealthy air days now
- 0 days/yr
- Unhealthy air days in 30 yrs
- 0 days/yr
Risk factors via First Street. Map © Google.
Why this score? — see what drove the C- grade
The composite is a weighted blend of 9 inputs, each scored 0–100. Each bar is that input's sub-score; the figure is the points it added to the 100-point composite (weight × sub-score).
- Cash flow +16.8/30.0
- Appreciation +8.6/10.0
- ARV discount +7.5/15.0
- DSCR +5.2/10.0
- 1% rule +3.4/10.0
- Rent growth +2.5/5.0
- Livability +2.5/5.0
- Condition / age +2.5/5.0
- Schools +2.3/10.0
$219,900
🖨 Deal sheet 📄 Offer letter ✓ Due diligence
Listing remarks MLS
This charming 3br 2ba condo offers a perfect blend of comfort and convenience with stunning views of the spring-fed lake. The main level features a spacious, vaulted living with cozy gas fireplace and stylish LVP flooring. A convenient bar area complements the open layout, perfect for entertaining. The kitchen is efficiently designed for all your culinary needs, while the master suite provides a private haven. Upstairs you will find a guest bedroom, a loft-style bedroom, a shared bath and access onto a large walk-out balcony. The condo association handles all exterior and grounds/maintenance along with city water, insurance on the building and the community pool. Sold partially furnished.
Key facts
- Cozy gas fireplace
- Stunning views
- Vaulted living
Tags
Neighborhood map
What this means for you Summary
Snapshot
- This is a 3-bed/2.0-bath condo listed at $220k.
Deal economics
- At list price, monthly cash flow is $76 ($908/yr) — positive.
- The deal already cash-flows at list — no discount required.
- To meet the 1% rule (rent ≥ 1% of price), the offer needs to be $184k (16.5% below list).
- Recommended offer: $184k (16.5% below list) — sets the bar for 1% rule.
- Cap rate 7.1% vs local median 2.5% in Counce — top-decile yield for the area; either an underpriced asset or a hidden risk that comps aren't pricing in. Stress-test before assuming the spread holds.
Location & tenants
- Location reads: area grade C — affects rentability + tenant quality, not the cash-flow math above.
- Hardin County (rural): math 27% / reading 28% proficiency, ranked #76 of 139 in TN (top 55%) — low school quality limits family demand, transient renter base, plan for 1-2y turnover.
- Market conditions: 125 active listings in the ZIP; 24 units permitted in Hardin County in 2024 (0 in 5+ unit buildings).
Forward outlook
- In year one you build about $17k of equity ($2k loan paydown + $16k appreciation (7.2% local appreciation)).
- Hardin County population projected at -17% by 2050 — secular population decline; favor cash flow + early exit over multi-decade hold.
- At projected returns (7.2% appreciation + 3.0% rent growth), your $62k cash investment doubles in ~4 years — after that, you're playing with house money.
- By year 3, paydown + projected appreciation supports a ~$43k cash-out refi (75% LTV) — recoverable capital for the next deal without selling this one.
Negotiation context
- It's been on market 188 days — a 12% lower offer ($194k) is reasonable based on typical stale-listing flexibility.
- 2 sale attempts with the ask held roughly flat each time — persistent listings suggest the price (not the market) is what's stuck; bring a comps-based counter.
- Current owner paid $70k; list at $220k implies a 214% gain — meaningful room to come down on a strong offer.
Risks & watch-outs
- Watch-outs: flood insurance adds $66/mo.
- Climate carrying-cost: severe flood risk; extreme-heat days projected 7→20/yr by 2055 (HVAC capex compounding) — expect insurance premiums to compound above CPI over the hold.
Questions for the listing agent
- It's been on market 188 days. Have you received any prior offers? Is the seller open to a 16% concession, seller financing, or rate buy-down credit?
- What's the actual annual flood-insurance premium (NFIP or private), and is the property in a SFHA with mandatory coverage?
- Any open or pending special assessments — roof, HVAC, plumbing, elevator, façade? What's the per-unit balance and payoff schedule, and is the seller paying it off at close or rolling it to the buyer?
- Why hasn't it sold? Are there any deal-killer items the seller is aware of (foundation, flood, title, zoning, code violations)?
- Is there a deadline driving the sale (1031 exchange, divorce, estate, relocation)? That informs how much negotiation room exists.
- What's the average days-on-market for RENTAL listings here right now (not sales)? A rising rental-DOM trend means longer vacancies and softer asking-rent achievability than the comps imply.
- What's the recent tenant-quality profile in this submarket — average credit score on applications, eviction rate, late-payment / NSF rate, and stable-employment percentage? A property-management company in the area should have these aggregated.
- How much new apartment / multifamily construction is in the pipeline within 1–3 miles? Heavy new supply (>2% of stock underway) typically softens rents 12–24 months out; light construction supports rent growth.
Investment metrics
- 1% rule
- 0.84% ✗
- Cap rate
- 7.07%
- Cash-on-cash
- 2.77%
- DSCR
- 1.12
- GRM
- 10.0
CMA / ARV
- ARV (median comp)
- $772,500
- List price
- $219,900
- Delta
- -71.53%
- Verdict
- UNDERPRICED
- Comps
- 1 within 2.0 mi
Projected returns pro-forma
7.21% appreciation · 3.0% rent growth · sell at horizon
- IRR
- 19.3%
- Equity multiple
- 2.37×
- Total profit
- $84,390
- Equity at exit
- $155,412
- IRR
- 18.3%
- Equity multiple
- 4.92×
- Total profit
- $241,312
- Equity at exit
- $297,995
Cash invested: $61,572 (down + closing). Projections, not guarantees.
Landlord ↔ Tenant lean methodology
- Overall (STATE)
- 87 Strongly Landlord-Friendly
- State Tennessee
- 87 Strongly Landlord-Friendly · R+13
- County
- — inherits STATE
- City
- — inherits STATE
ZIP-level market 38326
- Home prices YoY
- 2.4%
- Active inventory
- 125
- Price-to-rent
- 10.0×
Monthly cashflow live
- Estimated rent
- $1,836 medium interval (Pro) →
- Mortgage (P&I)
- −$1,153
- Tax from tax record
- −$64 /mo · $764/yr
- Insurance
- −$92
- Flood insurance flood zone
- −$66 /mo · $798/yr
- HOA
- −$0
- Vacancy / Maint / Mgmt
- −$386
- Net cashflow
- $76
Break-even live
UW: 25.0% down · 7.5% · 30yr · 1.5% tax · 5.0% vac · 8.0% maint · 8.0% mgmt
Financing live
Cash to close
- Down payment
- $54,975
- Closing costs
- $6,597
- Reserves months
- —
- Total cash needed
- —
Loan-product check · same deal, 3 products live
Conventional
25% down · 7.5% · 30yr
- Down + closing
- —
- Monthly P&I
- —
- Monthly cashflow
- —
- DSCR
- —
- Eligible?
- —
Personal DTI + credit; lowest rate.
DSCR
20% down · 8.5% · 30yr
- Down + closing
- —
- Monthly P&I
- —
- Monthly cashflow
- —
- DSCR
- —
- Eligible?
- —
No personal income docs; deal must DSCR.
Hard money
10% down · 12.0% · 12mo
- Down + closing
- —
- Monthly P&I
- —
- Monthly cashflow
- —
- DSCR
- —
- Eligible?
- —
Short-term bridge; refi at stabilization.
HOA detail condo
- Monthly dues
- $0 · $0/yr
- Likely covers
- watergaslandscapingpool
- Assessments
- None detected in remarks — confirm with the listing agent.
Listing history 18 events
-
2026-06-18days on market $219,900 Active 188 DOM
-
2026-06-17days on market $219,900 Active 187 DOM
-
2026-06-16days on market $219,900 Active 186 DOM
-
2026-06-15days on market $219,900 Active 185 DOM
-
2026-06-13days on market $219,900 Active 183 DOM
-
2026-06-12days on market $219,900 Active 182 DOM
-
2026-06-09days on market $219,900 Active 179 DOM
-
2026-06-08days on market $219,900 Active 178 DOM
-
2026-06-08days on market $219,900 Active 177 DOM
-
2026-06-07days on market $219,900 Active 176 DOM
-
2026-06-03days on market $219,900 Active 173 DOM
-
2026-06-02days on market $219,900 Active 172 DOM
-
2026-06-01days on market $219,900 Active 171 DOM
-
2026-05-31days on market $219,900 Active 170 DOM
-
2025-12-12$219,900 Active 697-char remark
Show marketing remark (697 chars)
This charming 3br 2ba condo offers a perfect blend of comfort and convenience with stunning views of the spring-fed lake. The main level features a spacious, vaulted living with cozy gas fireplace and stylish LVP flooring. A convenient bar area complements the open layout, perfect for entertaining. The kitchen is efficiently designed for all your culinary needs, while the master suite provides a private haven. Upstairs you will find a guest bedroom, a loft-style bedroom, a shared bath and access onto a large walk-out balcony. The condo association handles all exterior and grounds/maintenance along with city water, insurance on the building and the community pool. Sold partially furnished.
-
2004-01-09soldstatus $70,000
-
1998-11-23soldstatus $115,000
ⓘ Source: listings_history table (triggers on properties + properties_extension) + one-shot
backfill from property_details.listing_events for pre-trigger history.
Tax reassessment forecast TN · Resets to sale price
- Current annual tax
- $764 · $64/mo
- Projected year-2 tax
- $1,561 · $130/mo
- Expected delta
- +$797/yr (+$66/mo · 104.4%)
ⓘ Screening estimate from a state-policy table — verify with the county assessor before closing.
Climate risk First Street
- Flood 8/10 Severe FEMA zone X (unshaded) · 99% chance over 30 yrs
- Wildfire 4/10 Moderate
- Heat 6/10 Major 7 d/yr ≥108°F today · 20 d/yr by 30 yrs out
- Wind 4/10 Moderate 19% chance of damaging wind over 30 yrs
- Air quality 1/10 Low 0 unhealthy d/yr today · 0 by 30 yrs out
Nearby sold comps map
Loading sold comps map…
Walkable amenities ~0.75 mi
Loading nearby amenities…
Taxation est. · year 1
- Rental income
- $22,034
- − Mortgage interest
- −$12,318
- − Property taxes
- −$764
- − Insurance
- −$1,897
- − Repairs & maintenance
- −$1,763
- − Management
- −$1,763
- − Depreciation
- −$6,397
- Taxable loss
- −$2,867
- Est. tax savings @ 24.0%
- +$688
- After-tax cash flow
- $1,596/yr
For passive investors: Depreciation is non-cash, so a rental often shows a tax loss while cash-flowing — sheltering income. Rental losses are passive: they offset passive income freely, and up to $25,000/yr can offset ordinary (W-2) income if you actively participate and your MAGI is under $100k (phasing out to $0 by $150k); unused losses carry forward. On sale, claimed depreciation is recaptured at up to 25%, and gains may owe capital-gains tax (a 1031 exchange can defer both). Figures are a year-1 estimate at your 24.0% rate — not tax advice; consult a CPA.
Schools (NCES district)
- District
- Hardin County
- NCES district ID
- 4701680
- Math proficiency
- 27% ▼ -1.00%
- Reading proficiency
- 28% ▼ -1.00%
- Median HH income
- $34,404
- Composite
- 22.64/100
- National rank
- #8061
- State rank
- #76 of 139 in TN
Livability — Counce
No livability data for this city. (Only ~50 U.S. cities are tracked.)
Census & demographics
- Population (ZIP)
- 2,566
Population outlook (Hardin County) Hauer SSP2
- Today (2025)
- 24,740 people
- By 2030
- 23,971 · -3.1%
- By 2040
- 22,284 · -9.9%
- By 2050
- 20,612 · -16.7%
- By 2075
- 17,072 · -31.0%
- By 2100
- 13,723 · -44.5%
Race, ethnicity, and origin ACS 2023
- Neighborhood character
- Predominantly White (97%)
- Race & ethnicity
- White 97% Two or more races 3%
- Common ancestry
- Italian 5% Lithuanian 3% Slovak 3%
- Foreign-born
- 0%
- Languages at home
- 99% English-only · Spanish 1%
Political lean MEDSL · Hardin
- 2024 margin
- Solid R (+71.0) · D 14.1% · R 85.1%
- 2008→2024 swing
- -28.3pp toward R · 2008: -42.7pp · 2024: -71.0pp
- All cycles
- 2024: R+71.0 2020: R+67.5 2016: R+64.2 2012: R+51.6 2008: R+42.7
Not yet ingested
- Civics
- —
Market trends
- HPI YoY
- ▲ 7.21%
- Current HPI
- 303.1462
- Rent YoY
- —
- Metro
- —
- State GDP YoY
- ▲ 2.78%
- F500 in state
- 22
Industry mix (Fortune 500 HQ in TN)
| Industry | F500 HQs | Revenue |
|---|---|---|
| Healthcare | 3 | $91B |
|
||
| Retail | 3 | $72B |
|
||
| Transportation / Logistics | 1 | $88B |
|
||
| Paper / Packaging | 1 | $19B |
|
||
| Insurance | 1 | $13B |
|
||
| Energy | 1 | $12B |
|
||
Price history
+91.2% since first listed4 events — show timeline
- 2025-12-12 Listed $219,900 REALTRACS as Distributed by MLS Grid
- 2025-12-12 Listed $219,900 Memphis Area Association of Realtors(R) MLS
- 2004-01-09 Sold (Public Records) $70,000 Public Records
- 1998-11-23 Sold (Public Records) $115,000 Public Records
Property tax history
+3.2%/yrLatest (2025): $764 · +0.0% YoY. Source: county tax records.
Cash-flow waterfall
monthlySold comps — $/sqft
last 12 mo · ≤1 miLoading sold comps…