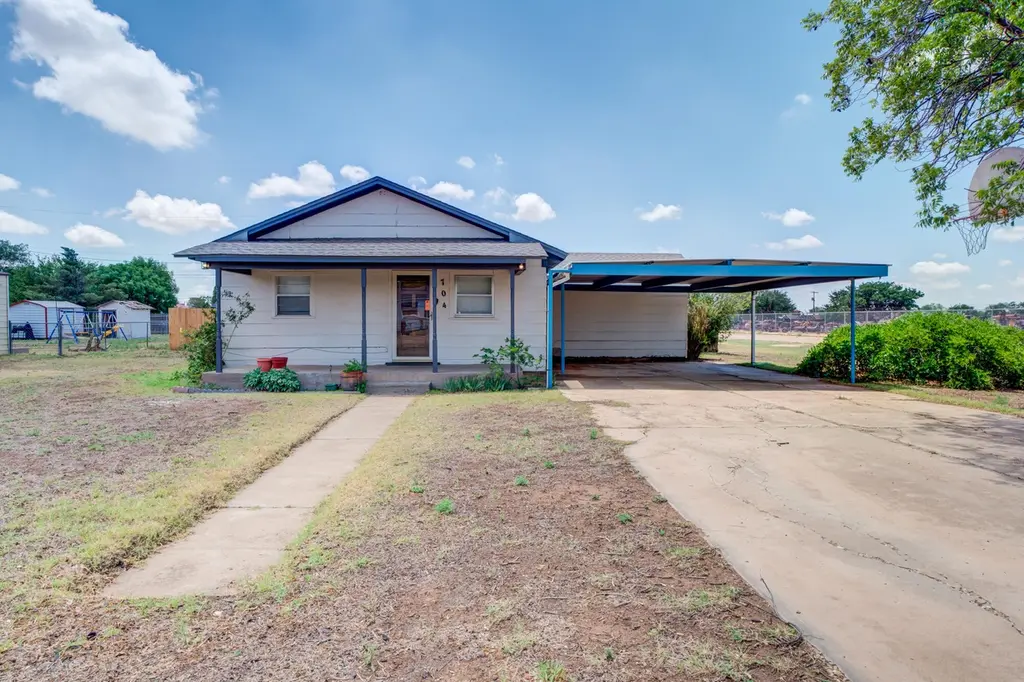
704 11th St · Shallowater, TX
Flood risk 1/10 · Minimal
- FEMA flood zone
- X (unshaded)
- Chance of flooding over 30 yrs
- 0.0%
- Est. flood insurance / yr
- $507 – $1,088
Fire risk 7/10 · Major
- Est. fire insurance / yr
- $1,222 – $2,270
Heat risk 5/10 · Moderate
- Hot days now (above 99°F)
- 6 days/yr
- Hot days in 30 yrs
- 18 days/yr
Wind risk 2/10 · Minimal
- Chance of severe wind over 30 yrs
- —
Air-quality risk 2/10 · Minimal
- Unhealthy air days now
- 1 days/yr
- Unhealthy air days in 30 yrs
- 1 days/yr
Risk factors via First Street. Map © Google.
Why this score? — see what drove the C+ grade
The composite is a weighted blend of 9 inputs, each scored 0–100. Each bar is that input's sub-score; the figure is the points it added to the 100-point composite (weight × sub-score).
- Cash flow +19.5/30.0
- Appreciation +10.0/10.0
- ARV discount +7.5/15.0
- DSCR +6.2/10.0
- Schools +6.0/10.0
- 1% rule +4.8/10.0
- Livability +3.7/5.0
- Rent growth +2.5/5.0
- Condition / age +2.5/5.0
$154,900
🖨 Deal sheet 📄 Offer letter ✓ Due diligence
Listing remarks
Fully remodeled and move-in ready, this 2 bedroom, 2 bathroom home in Shallowater is a rare find at $165,000. Located in the highly desirable Shallowater ISD and close to the school, this home offers the kind of location, updates, and price point that can be hard to find under $180,000, especially for a fully remodeled two bedroom. With a functional layout and fresh updates throughout, it would be a great fit for a first-time buyer, a small family, or anyone looking for an affordable home in Shallowater, Texas. Clean, updated, and priced to sell, this one is hard to beat.
Key facts
- 0.25 acre lot
- Garage
- Built 1953
Property features AI
Exterior
- Parking: Attached carport; Carport with 2 spaces
- Security: Smoke detector(s)
- Utilities: Public water; Public sewer; Natural gas available and connected; Electricity connected; Cable connected; Water connected
- Home design: Single-family residence; Updated / remodeled
- Construction: Built with asbestos, board & batten siding, concrete and fiber cement materials; Pillar/post/pier foundation; Composition roof
- Exterior features: Back yard; Fenced yard; City lot; Corner lot; Landscaped; Paved road frontage; Publicly maintained road; City street frontage
Interior
- Kitchen: Range (gas, free-standing)
- Flooring: Carpet; Vinyl
- Bathrooms: 2 full bathrooms
- Heating & cooling: Central heating; Central air; Ceiling fans
- Interior features: Breakfast bar; Ceiling fans; His and hers closets; Smoke detectors
- Laundry & utility: Washer hookup; Electric dryer hookup; Gas water heater
Neighborhood map
What this means for you Summary
Snapshot
- This is a 3-bed/2.0-bath single-family listed at $155k.
Deal economics
- At list price, monthly cash flow is $176 ($2k/yr) — positive.
- The deal already cash-flows at list — no discount required.
- To meet the 1% rule (rent ≥ 1% of price), the offer needs to be $151k (2.3% below list).
- Recommended offer: $151k (2.3% below list) — sets the bar for 1% rule.
Location & tenants
- Location reads 73/100 on livability (#207 in TX) — a middle-class / working-renter tenant base. Strengths: crime A+, cost of living A+, housing A+; Watch: health & safety C-, amenities F, commute F.
- Shallowater ISD (town): math 73% / reading 66% proficiency, ranked #18 of 826 in TX (top 2%) — acceptable for families but not a draw, mixed tenant base, ~2y average lease.
- Zoned schools: Shallowater El (330 students, 39% FRL); Shallowater Middle (math 75% / reading 64%, grade A, #63 of 1,662 statewide, top 4%, 500 students, 37% FRL); Shallowater H S (math 67% / reading 72%, grade B, #119 of 1,632 statewide, top 9%, 542 students, 37% FRL) — zoned schools at 38% FRL track the district average.
- Market conditions: 116 active listings in the ZIP; 2 comparable units currently listed for rent nearby; 2,219 units permitted in Lubbock County in 2024 (252 in 5+ unit buildings).
Forward outlook
- In year one you build about $17k of equity ($1k loan paydown + $15k appreciation (10.0% local appreciation)).
- Lubbock County population projected at +39% by 2050 — long-run rental-demand tailwind backs the buy-and-hold thesis.
- At projected returns (10.0% appreciation + 3.0% rent growth), your $43k cash investment doubles in ~3 years — after that, you're playing with house money.
- By year 3, paydown + projected appreciation supports a ~$42k cash-out refi (75% LTV) — recoverable capital for the next deal without selling this one.
Negotiation context
- It's been on market 21 days — a 2% lower offer ($153k) is reasonable based on typical stale-listing flexibility.
Risks & watch-outs
- Watch-outs: built in 1953 — expect roof / HVAC / electrical / plumbing capex.
- Climate carrying-cost: major wildfire risk; extreme-heat days projected 6→18/yr by 2055 (HVAC capex compounding) — expect insurance premiums to compound above CPI over the hold.
Questions for the listing agent
- Built in 1953 — when were the roof, HVAC, electrical panel, plumbing, and water heater last replaced?
- Is there a deadline driving the sale (1031 exchange, divorce, estate, relocation)? That informs how much negotiation room exists.
- Schools are A-rated — typically a magnet for longer-tenancy family renters. What's the average tenant stay here, and is there a school-zone premium baked into asking?
- What's the average days-on-market for RENTAL listings here right now (not sales)? A rising rental-DOM trend means longer vacancies and softer asking-rent achievability than the comps imply.
- What's the recent tenant-quality profile in this submarket — average credit score on applications, eviction rate, late-payment / NSF rate, and stable-employment percentage? A property-management company in the area should have these aggregated.
- How much new for-sale + rental construction is in the pipeline within 1–3 miles? Heavy new supply typically softens prices + rents 12–24 months out; constrained supply supports both.
Investment metrics
- 1% rule
- 0.98% ✗
- Cap rate
- 7.65%
- Cash-on-cash
- 4.86%
- DSCR
- 1.22
- GRM
- 8.5
CMA / ARV
No comps found within radius.
Projected returns pro-forma
10.0% appreciation · 3.0% rent growth · sell at horizon
- IRR
- 27.8%
- Equity multiple
- 3.20×
- Total profit
- $95,537
- Equity at exit
- $139,546
- IRR
- 24.2%
- Equity multiple
- 7.28×
- Total profit
- $272,530
- Equity at exit
- $300,937
Cash invested: $43,372 (down + closing). Projections, not guarantees.
Landlord ↔ Tenant lean methodology
- Overall (STATE)
- 87 Strongly Landlord-Friendly
- State Texas
- 87 Strongly Landlord-Friendly · R+5
- County
- — inherits STATE
- City
- — inherits STATE
ZIP-level market 79363
- Home prices YoY
- 7.3%
- Active inventory
- 116
- Price-to-rent
- 8.5×
Monthly cashflow live
- Estimated rent
- $1,513 medium interval (Pro) →
- Mortgage (P&I)
- −$812
- Tax from tax record
- −$143 /mo · $1,710/yr
- Insurance
- −$65
- HOA
- −$0
- Vacancy / Maint / Mgmt
- −$318
- Net cashflow
- $176
Break-even live
UW: 25.0% down · 7.5% · 30yr · 1.5% tax · 5.0% vac · 8.0% maint · 8.0% mgmt
Financing live
Cash to close
- Down payment
- $38,725
- Closing costs
- $4,647
- Reserves months
- —
- Total cash needed
- —
Loan-product check · same deal, 3 products live
Conventional
25% down · 7.5% · 30yr
- Down + closing
- —
- Monthly P&I
- —
- Monthly cashflow
- —
- DSCR
- —
- Eligible?
- —
Personal DTI + credit; lowest rate.
DSCR
20% down · 8.5% · 30yr
- Down + closing
- —
- Monthly P&I
- —
- Monthly cashflow
- —
- DSCR
- —
- Eligible?
- —
No personal income docs; deal must DSCR.
Hard money
10% down · 12.0% · 12mo
- Down + closing
- —
- Monthly P&I
- —
- Monthly cashflow
- —
- DSCR
- —
- Eligible?
- —
Short-term bridge; refi at stabilization.
Rent comps 2 comps
| Address | Beds | Baths | Sqft | Rent | $/sqft | DOM | Units | Dist |
|---|---|---|---|---|---|---|---|---|
| 1405 17th St Unit A Shallowater, TX | 3.0 | 2.0 | 1305 | $1,525 | $1.17 | 13d | 1 | 0.77mi |
| 1407 17th St Unit A Shallowater, TX | 3.0 | 2.0 | 1306 | $1,500 | $1.15 | 21d | 1 | 0.78mi |
Listing history 20 events
-
2026-06-18price $154,900 Active 21 DOM
-
2026-06-18days on market $159,900 Active 21 DOM
-
2026-06-17days on market $159,900 Active 20 DOM
-
2026-06-16days on market $159,900 Active 19 DOM
-
2026-06-15days on market $159,900 Active 18 DOM
-
2026-06-14days on market $159,900 Active 16 DOM
-
2026-06-13pricedays on market $159,900 Active 15 DOM
-
2026-06-10days on market $165,000 Active 13 DOM
-
2026-06-09days on market $165,000 Active 12 DOM
-
2026-06-08days on market $165,000 Active 11 DOM
-
2026-06-07days on market $165,000 Active 10 DOM
-
2026-06-05days on market $165,000 Active 7 DOM
-
2026-06-03days on market $165,000 Active 6 DOM
-
2026-06-02days on market $165,000 Active 5 DOM
-
2026-06-01days on market $165,000 Active 4 DOM
-
2026-05-31days on market $165,000 Active 3 DOM
-
2026-05-30remarks 578-char remark
-
2026-05-30days on market $165,000 Active 2 DOM
-
2026-05-28$165,000 Active
-
2026-03-13soldstatus
ⓘ Source: listings_history table (triggers on properties + properties_extension) + one-shot
backfill from property_details.listing_events for pre-trigger history.
Tax reassessment forecast TX · Resets to sale price
- Current annual tax
- $1,710 · $143/mo
- Projected year-2 tax
- $2,835 · $236/mo
- Expected delta
- +$1,124/yr (+$94/mo · 65.8%)
ⓘ Screening estimate from a state-policy table — verify with the county assessor before closing.
Climate risk First Street
- Flood 1/10 Low FEMA zone X (unshaded) · 0% chance over 30 yrs
- Wildfire 7/10 Severe
- Heat 5/10 Major 6 d/yr ≥99°F today · 18 d/yr by 30 yrs out
- Wind 2/10 Low
- Air quality 2/10 Low 1 unhealthy d/yr today · 1 by 30 yrs out
Nearby sold comps map
Loading sold comps map…
Walkable amenities ~0.75 mi
Loading nearby amenities…
Taxation est. · year 1
- Rental income
- $18,151
- − Mortgage interest
- −$8,677
- − Property taxes
- −$1,710
- − Insurance
- −$774
- − Repairs & maintenance
- −$1,452
- − Management
- −$1,452
- − Depreciation
- −$4,506
- Taxable loss
- −$421
- Est. tax savings @ 24.0%
- +$101
- After-tax cash flow
- $2,208/yr
For passive investors: Depreciation is non-cash, so a rental often shows a tax loss while cash-flowing — sheltering income. Rental losses are passive: they offset passive income freely, and up to $25,000/yr can offset ordinary (W-2) income if you actively participate and your MAGI is under $100k (phasing out to $0 by $150k); unused losses carry forward. On sale, claimed depreciation is recaptured at up to 25%, and gains may owe capital-gains tax (a 1031 exchange can defer both). Figures are a year-1 estimate at your 24.0% rate — not tax advice; consult a CPA.
Schools (NCES district)
- District
- Shallowater ISD
- NCES district ID
- 4839870
- Math proficiency
- 73% ▲ 2.00%
- Reading proficiency
- 66% ▲ 9.00%
- Median HH income
- $57,288
- Composite
- 59.69/100
- National rank
- #903
- State rank
- #18 of 826 in TX
Livability — Shallowater
- Score
- 73/100
- State rank
- #207
- US rank
- #5236
Category grades
Schools grade is shown separately in the Schools card above.
Census & demographics
- Census place
- Shallowater, TX
- Population (ZIP)
- 5,831
Population outlook (Lubbock County) Hauer SSP2
- Today (2025)
- 345,960 people
- By 2030
- 371,449 · +7.4%
- By 2040
- 424,539 · +22.7%
- By 2050
- 481,150 · +39.1%
- By 2075
- 633,467 · +83.1%
- By 2100
- 746,853 · +115.9%
Race, ethnicity, and origin ACS 2023
- Neighborhood character
- Predominantly White (69%)
- Race & ethnicity
- White 69% Hispanic / Latino 27% Two or more races 20%
- Hispanic origin (detail)
- Mexican 23%
- Common ancestry
- Lithuanian 5% Slovak 3% Romanian 2%
- Foreign-born
- 3% · Canada
- Languages at home
- 84% English-only · Spanish 16%
Political lean MEDSL · Lubbock
- 2024 margin
- Solid R (+39.5) · D 29.7% · R 69.2% · Other 1.0%
- 2008→2024 swing
- -2.8pp toward R · 2008: -36.7pp · 2024: -39.5pp
- All cycles
- 2024: R+39.5 2020: R+32.2 2016: R+38.4 2012: R+40.9 2008: R+36.7
Not yet ingested
- Civics
- —
Market trends
- HPI YoY
- ▲ 19.76%
- Current HPI
- 289.7445
- Rent YoY
- —
- Metro
- —
- State GDP YoY
- ▲ 3.95%
- F500 in state
- 110
Industry mix (Fortune 500 HQ in TX)
| Industry | F500 HQs | Revenue |
|---|---|---|
| Energy | 16 | $1,198B |
|
||
| Technology | 5 | $198B |
|
||
| Engineering / Construction | 4 | $72B |
|
||
| Energy Services | 3 | $60B |
|
||
| Utilities | 3 | $41B |
|
||
| Healthcare | 2 | $330B |
|
||
Price history
2 events — show timeline
- 2026-05-28 Listed $165,000 LARMLS
- 2026-03-13 Sold (Public Records) — Public Records
Property tax history
+4.5%/yrLatest (2025): $1,710 · +10.0% YoY. Source: county tax records.
Cash-flow waterfall
monthlySold comps — $/sqft
last 12 mo · ≤1 miLoading sold comps…