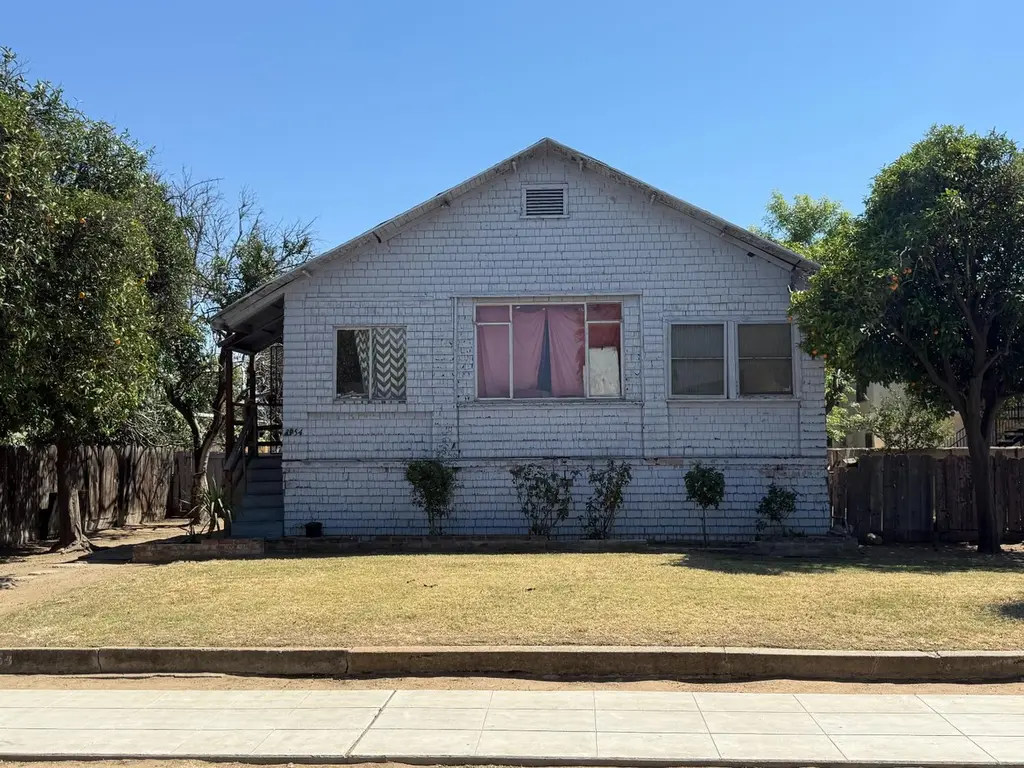
2954 E Illinois Ave · Fresno, CA
Flood risk 1/10 · Minimal
- FEMA flood zone
- X (unshaded)
- Chance of flooding over 30 yrs
- 0.0%
- Est. flood insurance / yr
- $507 – $1,088
Fire risk 1/10 · Minimal
- Est. fire insurance / yr
- $659 – $1,223
Heat risk 8/10 · Major
- Hot days now (above 105°F)
- 7 days/yr
- Hot days in 30 yrs
- 17 days/yr
Wind risk 1/10 · Minimal
- Chance of severe wind over 30 yrs
- —
Air-quality risk 10/10 · Severe
- Unhealthy air days now
- 40 days/yr
- Unhealthy air days in 30 yrs
- 44 days/yr
Risk factors via First Street. Map © Google.
Why this score? — see what drove the C- grade
The composite is a weighted blend of 9 inputs, each scored 0–100. Each bar is that input's sub-score; the figure is the points it added to the 100-point composite (weight × sub-score).
- ARV discount +15.0/15.0
- Cash flow +10.2/30.0
- Appreciation +10.0/10.0
- Livability +3.1/5.0
- DSCR +2.9/10.0
- Schools +2.7/10.0
- Rent growth +2.5/5.0
- Condition / age +2.5/5.0
- 1% rule +1.8/10.0
$175,000
🖨 Deal sheet 📄 Offer letter ✓ Due diligence
Listing remarks MLS
This is a great opportunity for first time home buyer or investor. As you can see from the pictures, this home was built high to be higher than flood water back then. Home needs little TLC but is priced well below market in the area. This home is set up with a room in the back with a closet that was used as a bed room and indoor laundry. This is a sale As Is.
Key facts
- 7,501 sq ft lot
- Built 1911
- Listed 27 days
Property features AI
Exterior
- Utilities: Electric service on; Public sewer; Public utilities
- Home design: Single-family residence; One level
- Construction: Wood siding; Composition roof; Wood subfloor foundation
- Exterior features: Urban lot setting; Lot dimensions approximately 60 x 125
Interior
- Kitchen: Range/oven (full-size)
- Flooring: Vinyl
- Bathrooms: 1 bathroom
- Heating & cooling: Floor or wall heating units; Evaporative cooling; Wall/window cooling unit(s)
- Interior features: Vinyl flooring; Tub/shower bathroom
- Laundry & utility: Laundry inside in a laundry closet
Neighborhood map
What this means for you Summary
Snapshot
- This is a 2-bed/1.0-bath single-family listed at $175k.
Deal economics
- At list price, monthly cash flow is $-101 ($-1k/yr) — negative.
- To cash-flow at today's rent, offer at most $157k (10.2% below list).
- To meet the 1% rule (rent ≥ 1% of price), the offer needs to be $118k (32.4% below list).
- Recommended offer: $118k (32.4% below list) — sets the bar for 1% rule.
- Cap rate 5.6% vs local median 3.7% in Fresno — top-decile yield for the area; either an underpriced asset or a hidden risk that comps aren't pricing in. Stress-test before assuming the spread holds.
Location & tenants
- Location reads 62/100 on livability (#469 in CA) — a middle-class / working-renter tenant base. Strengths: commute A+, housing A+; Watch: amenities D+, employment D+, crime F.
- Fresno Unified (urban): math 18% / reading 47% proficiency, ranked #327 of 517 in CA (top 63%) — families likely to look elsewhere, expect single-tenant / working-renter base with shorter leases; 77% free/reduced lunch — lower-income household profile, screen leases tightly.
- Zoned schools: Jefferson Elementary (454 students, 97% FRL); Tehipite Middle (481 students, 98% FRL); Roosevelt High (math 14% / reading 41%, grade F, #780 of 1,170 statewide, top 67%, 2,228 students, 92% FRL) — zoned schools average 96% FRL vs 77% district-wide (19 pts higher); higher-poverty schools than district average — tighter screening recommended.
- Market conditions: 41 active listings in the ZIP; 25 comparable units currently listed for rent nearby; rentals at typical pace (median 24d on market — plan ~3-4 weeks tenant-placement turnaround); 40% of comp listings sitting > 30 days — soft ceiling on asking rent; lower-income renter base — watch delinquency; 2,426 units permitted in Fresno County in 2024 (296 in 5+ unit buildings).
- This rent runs 43% of the median local income ($33k/yr) — at the standard rent-burdened threshold; future hikes will face affordability resistance.
Forward outlook
- In year one you build about $19k of equity ($1k loan paydown + $18k appreciation (10.0% local appreciation)).
- Fresno County population projected at +11% by 2050 — modest demand growth; plan on rents tracking national, not racing it.
- By year 2, paydown + projected appreciation supports a ~$30k cash-out refi (75% LTV) — recoverable capital for the next deal without selling this one.
Negotiation context
- It's been on market 27 days — a 2% lower offer ($172k) is reasonable based on typical stale-listing flexibility.
- 2 sale attempts since 17y ago with the ask held roughly flat each time — persistent listings suggest the price (not the market) is what's stuck; bring a comps-based counter.
Risks & watch-outs
- Watch-outs: built in 1911 — expect roof / HVAC / electrical / plumbing capex.
- Climate carrying-cost: extreme-heat days projected 7→17/yr by 2055 (HVAC capex compounding) — expect insurance premiums to compound above CPI over the hold.
Questions for the listing agent
- What do current leases actually rent for vs. the listed asking? Can we see a recent rent roll and the last 12 months of T-12 income?
- Built in 1911 — when were the roof, HVAC, electrical panel, plumbing, and water heater last replaced?
- Is there a deadline driving the sale (1031 exchange, divorce, estate, relocation)? That informs how much negotiation room exists.
- Schools are D-rated, which usually means shorter tenancies and higher turnover. Who's the typical renter profile here, and what's been the actual vacancy rate?
- Crime grade is F in this area — have there been break-ins, vandalism, or insurance claims at this property in the last 3 years? What carrier currently insures it and at what premium?
- What's the average days-on-market for RENTAL listings here right now (not sales)? A rising rental-DOM trend means longer vacancies and softer asking-rent achievability than the comps imply.
- What's the recent tenant-quality profile in this submarket — average credit score on applications, eviction rate, late-payment / NSF rate, and stable-employment percentage? A property-management company in the area should have these aggregated.
- How much new for-sale + rental construction is in the pipeline within 1–3 miles? Heavy new supply typically softens prices + rents 12–24 months out; constrained supply supports both.
Investment metrics
- 1% rule
- 0.68% ✗
- Cap rate
- 5.60%
- Cash-on-cash
- -2.46%
- DSCR
- 0.89
- GRM
- 12.3
CMA / ARV
- ARV (on-the-fly)
- $236,440
- Comps found
- 12
Show comp detail 12 sales within ~0.75 mi
| Address | Dist | Beds/Ba | Sqft | Sold | Price | $/sf | Match |
|---|---|---|---|---|---|---|---|
| 3006 E Mckenzie | 0.14mi | 2/1.0 | 938 (+2%) | 6mo | $255,000 | $272 | 85 |
| 2726 E Washington Ave | 0.25mi | 3/1.0 (+1) | 909 (-1%) | 6mo | $262,000 | $288 | 76 |
| 244 N U St | 0.26mi | 3/1.0 (+1) | 1,008 (+10%) | 6mo | $250,000 | $248 | 62 |
| 3004 E Madison | 0.32mi | 2/1.0 | 790 (-14%) | 3mo | $140,000 | $177 | 59 |
| 3348 E Mckenzie Ave | 0.43mi | 2/2.0 | 1,005 (+9%) | 2mo | $265,000 | $264 | 59 |
| 558 N Bond St | 0.63mi | 3/1.0 (+1) | 928 (+1%) | 7mo | $264,000 | $284 | 58 |
| 2524 E Grant Ave | 0.39mi | 2/1.0 | 821 (-11%) | 7mo | $193,000 | $235 | 58 |
| 3644 E Illinois Ave | 0.68mi | 2/1.0 | 936 (+2%) | 10mo | $292,000 | $312 | 57 |
| 3358 E Belmont Ave | 0.56mi | 3/1.0 (+1) | 907 (-1%) | 11mo | $220,000 | $243 | 57 |
| 3539 E Mckenzie Ave | 0.60mi | 2/1.0 | 1,008 (+10%) | 5mo | $238,000 | $236 | 52 |
| 3505 E Madison Ave | 0.64mi | 2/1.0 | 1,056 (+15%) | 7mo | $270,000 | $256 | 40 |
| 607 N 4th St | 0.68mi | 3/1.0 (+1) | 1,052 (+14%) | 8mo | $270,000 | $257 | 33 |
Match score weights: distance 35% · size 25% · config 20% · recency 20%. Top-matched comps best support the ARV.
Projected returns pro-forma
10.0% appreciation · 3.0% rent growth · sell at horizon
- IRR
- 22.5%
- Equity multiple
- 2.81×
- Total profit
- $88,812
- Equity at exit
- $157,654
- IRR
- 20.1%
- Equity multiple
- 6.44×
- Total profit
- $266,397
- Equity at exit
- $339,987
Cash invested: $49,000 (down + closing). Projections, not guarantees.
Landlord ↔ Tenant lean methodology
- Overall (STATE)
- 18 Strongly Tenant-Friendly
- State California
- 18 Strongly Tenant-Friendly · D+13
- County
- — inherits STATE
- City
- — inherits STATE
ZIP-level market 93701
- Home prices YoY
- 6.4%
- Active inventory
- 41
- Price-to-rent
- 12.3×
Monthly cashflow live
- Estimated rent
- $1,182 high interval (Pro) →
- Mortgage (P&I)
- −$918
- Tax from tax record
- −$44 /mo · $528/yr
- Insurance
- −$73
- HOA
- −$0
- Vacancy / Maint / Mgmt
- −$248
- Net cashflow
- $-101
Break-even live
UW: 25.0% down · 7.5% · 30yr · 1.5% tax · 5.0% vac · 8.0% maint · 8.0% mgmt
Financing live
Cash to close
- Down payment
- $43,750
- Closing costs
- $5,250
- Reserves months
- —
- Total cash needed
- —
Loan-product check · same deal, 3 products live
Conventional
25% down · 7.5% · 30yr
- Down + closing
- —
- Monthly P&I
- —
- Monthly cashflow
- —
- DSCR
- —
- Eligible?
- —
Personal DTI + credit; lowest rate.
DSCR
20% down · 8.5% · 30yr
- Down + closing
- —
- Monthly P&I
- —
- Monthly cashflow
- —
- DSCR
- —
- Eligible?
- —
No personal income docs; deal must DSCR.
Hard money
10% down · 12.0% · 12mo
- Down + closing
- —
- Monthly P&I
- —
- Monthly cashflow
- —
- DSCR
- —
- Eligible?
- —
Short-term bridge; refi at stabilization.
Rent comps 25 comps
| Address | Beds | Baths | Sqft | Rent | $/sqft | DOM | Units | Dist |
|---|---|---|---|---|---|---|---|---|
| 2995 E Nevada Ave Apt D Fresno, CA | 2.0 | 1.0 | 850 | $1,150 | $1.35 | 44d | 1 | 0.10mi |
| 3033 E Platt Ave Fresno, CA | 2.0 | 1.0 | 975 | $1,016 | $1.04 | 2d | 1 | 0.23mi |
| 293 S Callisch Ave Unit 224-110F Fresno, CA | 1.0 | 1.0 | 780 | $1,095 | $1.40 | 12d | 1 | 0.30mi |
| 2510 E Washington Ave Unit 2512 Fresno, CA | 1.0 | 1.0 | 550 | $995 | $1.81 | 44d | 1 | 0.34mi |
| 453 N Orchard St Apt C Fresno, CA | 2.0 | 1.0 | 630 | $1,250 | $1.98 | 3d | 1 | 0.34mi |
| 2909 Huntington Blvd Fresno, CA | 1.0 | 1.0 | 696 | $1,250 | $1.80 | 3d | 3 | 0.35mi |
| 2881 Huntington Blvd #101 Fresno, CA | 1.0 | 1.0 | 860 | $1,295 | $1.51 | 11d | 1 | 0.49mi |
| 1310 P St Unit 1314 Fresno, CA | 1.0 | 1.0 | 600 | $1,050 | $1.75 | 3d | 1 | 0.67mi |
| 2056 E White Ave Apt B Fresno, CA | 2.0 | 1.0 | 1050 | $1,250 | $1.19 | 44d | 1 | 0.69mi |
| 3634 E Madison Ave Unit 2 Fresno, CA | 1.0 | 1.0 | 600 | $1,000 | $1.67 | 44d | 1 | 0.76mi |
| 3254 E Olive Ave Apt D Fresno, CA | 2.0 | 1.0 | 750 | $1,300 | $1.73 | 21d | 1 | 0.92mi |
| 230 N Glenn Ave Fresno, CA | 1.0 | 1.0 | 613 | $1,195 | $1.95 | 23d | 1 | 0.95mi |
| 230 N Glenn Ave Fresno, CA | 1.0 | 1.0 | 613 | $1,195 | $1.95 | 44d | 1 | 0.95mi |
| 236 N Glenn Ave Fresno, CA | 1.0 | 1.0 | 613 | $1,195 | $1.95 | 23d | 1 | 0.95mi |
| 109 N Glenn Ave Fresno, CA | 2.0 | 1.5 | 1100 | $1,050 | $0.95 | 2d | 1 | 0.99mi |
| 1525 Van Ness Ave Unit 109FB Fresno, CA | 1.0 | 1.0 | 661 | $1,495 | $2.26 | 44d | 1 | 1.11mi |
| 3568 E Lowe Ave Fresno, CA | 2.0 | 1.0 | 946 | $1,600 | $1.69 | 14d | 1 | 1.13mi |
| 3655 E Lowe Ave Apt 103 Fresno, CA | 3.0 | 2.0 | 850 | $1,500 | $1.76 | 21d | 1 | 1.17mi |
| 1759 Fulton St Fresno, CA | 2.0 | 1.0–2.5 | 882 | $1,900 | $2.15 | 2d | 1 | 1.29mi |
| 1404 E Olive Ave Fresno, CA | 1.0 | 1.0 | 824 | $1,395 | $1.69 | 44d | 1 | 1.34mi |
| 116 N Yosemite Ave Unit 204 Fresno, CA | 1.0 | 1.0 | 600 | $1,100 | $1.83 | 44d | 1 | 1.41mi |
| 938 N Van Ness Ave Fresno, CA | 2.0 | 1.0 | 628 | $1,575 | $2.51 | 16d | 1 | 1.41mi |
| 960 N Van Ness Ave Fresno, CA | 3.0 | 1.0 | 900 | $1,350 | $1.50 | 44d | 1 | 1.42mi |
| 122 N Barton Ave Fresno, CA | 1.0 | 1.0 | 600 | $925 | $1.54 | 44d | 1 | 1.46mi |
| 3403 E Normal Ave Unit 2 Fresno, CA | 1.0 | 1.0 | 665 | $1,000 | $1.50 | 23d | 1 | 1.48mi |
Listing history 20 events
-
2026-06-18days on market $175,000 Active 27 DOM
-
2026-06-17days on market $175,000 Active 26 DOM
-
2026-06-16days on market $175,000 Active 25 DOM
-
2026-06-15days on market $175,000 Active 24 DOM
-
2026-06-13days on market $175,000 Active 22 DOM
-
2026-06-10days on market $175,000 Active 19 DOM
-
2026-06-09days on market $175,000 Active 18 DOM
-
2026-06-08days on market $175,000 Active 17 DOM
-
2026-06-07days on market $175,000 Active 16 DOM
-
2026-06-05days on market $175,000 Active 13 DOM
-
2026-06-03days on market $175,000 Active 12 DOM
-
2026-06-02days on market $175,000 Active 11 DOM
-
2026-06-01days on market $175,000 Active 10 DOM
-
2026-05-31days on market $175,000 Active 9 DOM
-
2026-05-22$175,000 Active
-
2026-03-24soldstatus $6,600,000
-
2009-09-11soldstatus $35,500 361-char remark
Show marketing remark (361 chars)
This is a great opportunity for first time home buyer or investor. As you can see from the pictures, this home was built high to be higher than flood water back then. Home needs little TLC but is priced well below market in the area. This home is set up with a room in the back with a closet that was used as a bed room and indoor laundry. This is a sale As Is.
-
2009-08-05historical 361-char remark
Show marketing remark (361 chars)
This is a great opportunity for first time home buyer or investor. As you can see from the pictures, this home was built high to be higher than flood water back then. Home needs little TLC but is priced well below market in the area. This home is set up with a room in the back with a closet that was used as a bed room and indoor laundry. This is a sale As Is.
-
2009-08-05price $45,000 361-char remark
Show marketing remark (361 chars)
This is a great opportunity for first time home buyer or investor. As you can see from the pictures, this home was built high to be higher than flood water back then. Home needs little TLC but is priced well below market in the area. This home is set up with a room in the back with a closet that was used as a bed room and indoor laundry. This is a sale As Is.
-
2009-06-08$35,500 361-char remark
Show marketing remark (361 chars)
This is a great opportunity for first time home buyer or investor. As you can see from the pictures, this home was built high to be higher than flood water back then. Home needs little TLC but is priced well below market in the area. This home is set up with a room in the back with a closet that was used as a bed room and indoor laundry. This is a sale As Is.
ⓘ Source: listings_history table (triggers on properties + properties_extension) + one-shot
backfill from property_details.listing_events for pre-trigger history.
Tax reassessment forecast CA · Resets to sale price
- Current annual tax
- $528 · $44/mo
- Projected year-2 tax
- $1,330 · $111/mo
- Expected delta
- +$802/yr (+$67/mo · 152.0%)
ⓘ Screening estimate from a state-policy table — verify with the county assessor before closing.
Climate risk First Street
- Flood 1/10 Low FEMA zone X (unshaded) · 0% chance over 30 yrs
- Wildfire 1/10 Low
- Heat 8/10 Severe 7 d/yr ≥105°F today · 17 d/yr by 30 yrs out
- Wind 1/10 Low
- Air quality 10/10 Extreme 40 unhealthy d/yr today · 44 by 30 yrs out
Nearby sold comps map
Loading sold comps map…
Walkable amenities ~0.75 mi
Loading nearby amenities…
Taxation est. · year 1
- Rental income
- $14,187
- − Mortgage interest
- −$9,803
- − Property taxes
- −$528
- − Insurance
- −$875
- − Repairs & maintenance
- −$1,135
- − Management
- −$1,135
- − Depreciation
- −$5,091
- Taxable loss
- −$4,379
- Est. tax savings @ 24.0%
- +$1,051
- After-tax cash flow
- $-156/yr
For passive investors: Depreciation is non-cash, so a rental often shows a tax loss while cash-flowing — sheltering income. Rental losses are passive: they offset passive income freely, and up to $25,000/yr can offset ordinary (W-2) income if you actively participate and your MAGI is under $100k (phasing out to $0 by $150k); unused losses carry forward. On sale, claimed depreciation is recaptured at up to 25%, and gains may owe capital-gains tax (a 1031 exchange can defer both). Figures are a year-1 estimate at your 24.0% rate — not tax advice; consult a CPA.
Schools (NCES district)
- District
- Fresno Unified
- NCES district ID
- 0614550
- Math proficiency
- 18% ▼ -12.00%
- Reading proficiency
- 47% ▲ 9.00%
- Median HH income
- $36,095
- Composite
- 26.83/100
- National rank
- #7111
- State rank
- #327 of 517 in CA
Livability — Fresno
- Score
- 62/100
- State rank
- #469
- US rank
- #15907
Category grades
Schools grade is shown separately in the Schools card above.
Census & demographics
- Census place
- Fresno, CA
- County
- Fresno County · 834,801 people
- City population
- 593,114
- Metro
- Fresno, CA
- Population (ZIP)
- 9,808
- Household income
- $32,768
- Rent vs Own
- Severe rent burden
- 1072.0
Population outlook (Fresno County) Hauer SSP2
- Today (2025)
- 1,042,971 people
- By 2030
- 1,072,198 · +2.8%
- By 2040
- 1,122,408 · +7.6%
- By 2050
- 1,157,251 · +11.0%
- By 2075
- 1,182,575 · +13.4%
- By 2100
- 1,105,899 · +6.0%
Race, ethnicity, and origin ACS 2023
- Neighborhood character
- Predominantly Hispanic (77%)
- Race & ethnicity
- Hispanic / Latino 77% Two or more races 23% White 10% Black 6% Asian 4% Native American 3%
- Hispanic origin (detail)
- Mexican 75%
- Common ancestry
- Scotch-Irish 1% Italian 1%
- Foreign-born
- 32% · Canada
- Languages at home
- 33% English-only · Spanish 61% Other Asian/Pacific 3%
Political lean MEDSL · Fresno
- 2024 margin
- Toss-up / Even · D 46.5% · R 50.9% · Other 2.6%
- 2008→2024 swing
- -6.5pp toward R · 2008: 2.1pp · 2024: -4.4pp
- All cycles
- 2024: R+4.4 2020: D+7.8 2016: D+3.9 2012: R+2.9 2008: D+2.1
Not yet ingested
- Civics
- —
Market trends
- HPI YoY
- ▲ 27.24%
- Current HPI
- 452.1844
- Rent YoY
- —
- Metro
- Fresno, CA
- State GDP YoY
- ▲ 3.21%
- F500 in state
- 116
Industry mix (Fortune 500 HQ in CA)
| Industry | F500 HQs | Revenue |
|---|---|---|
| Technology | 27 | $1,492B |
|
||
| Financial Services | 3 | $174B |
|
||
| Retail | 3 | $44B |
|
||
| Insurance | 3 | $26B |
|
||
| Media / Entertainment | 2 | $115B |
|
||
| Pharmaceuticals / Biotech | 2 | $62B |
|
||
Price history
+393.0% since first listed6 events — show timeline
- 2026-05-22 Listed $175,000 FRESNOMLS
- 2026-03-24 Sold (Public Records) $6,600,000 Public Records
- 2009-09-11 Sold (MLS) $35,500 FRESNOMLS
- 2009-08-05 Price Changed $45,000 FRESNOMLS
- 2009-08-05 Delisted — FRESNOMLS
- 2009-06-08 Listed $35,500 FRESNOMLS
Property tax history
+2.3%/yrLatest (2025): $528 · +3.9% YoY. Source: county tax records.
Cash-flow waterfall
monthlySold comps — $/sqft
last 12 mo · ≤1 miLoading sold comps…