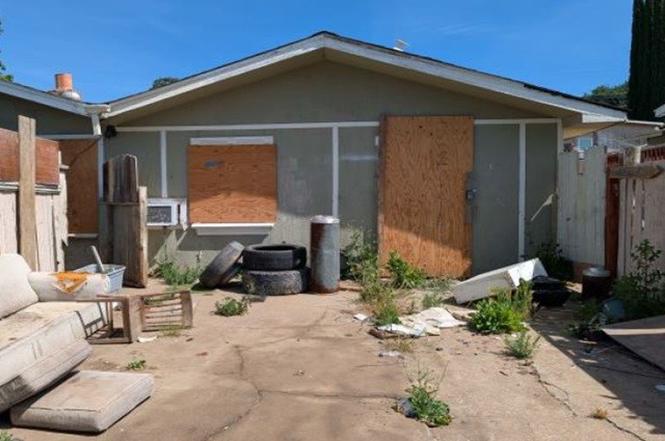
15926 40th Ave · Clearlake, CA
Flood risk 1/10 · Minimal
- FEMA flood zone
- D
- Chance of flooding over 30 yrs
- 0.0%
- Est. flood insurance / yr
- $544 – $1,084
Fire risk 10/10 · Severe
- Est. fire insurance / yr
- $659 – $1,223
Heat risk 6/10 · Moderate
- Hot days now (above 100°F)
- 7 days/yr
- Hot days in 30 yrs
- 14 days/yr
Wind risk 1/10 · Minimal
- Chance of severe wind over 30 yrs
- —
Air-quality risk 10/10 · Severe
- Unhealthy air days now
- 31 days/yr
- Unhealthy air days in 30 yrs
- 33 days/yr
Risk factors via First Street. Map © Google.
Why this score? — see what drove the C- grade
The composite is a weighted blend of 9 inputs, each scored 0–100. Each bar is that input's sub-score; the figure is the points it added to the 100-point composite (weight × sub-score).
- Cash flow +21.6/30.0
- 1% rule +8.3/10.0
- ARV discount +7.5/15.0
- DSCR +6.9/10.0
- Livability +3.1/5.0
- Rent growth +2.5/5.0
- Condition / age +2.5/5.0
- Schools +1.2/10.0
- Appreciation +0.0/10.0
$105,000
🖨 Deal sheet 📄 Offer letter ✓ Due diligence
Listing remarks MLS
CLEAN 4 BR. 2 BA. WITH LARGE FAMILY RM. FORMAL DINING AREA. WOOD STOVE, FENCED PARCEL, CARPORT
Key facts
- 0.34 acre lot
- Built 1972
- Listed 7 days
Property features AI
Finance
- Other: Zoning: SFR; Total units: 1; No ADU; Lot described as 0-1 unit/acre
Exterior
- Utilities: Public sewer; District/Public water
- Home design: Single-family house; Single-story; Entry on main level; Property faces a view
- Construction: Composition roof; Other construction materials; Concrete slab foundation; Year built source: Appraiser
- Exterior features: Rural setting; No pool
Interior
- Kitchen: No appliances listed
- Bedrooms: Four main-level bedrooms
- Bathrooms: Two full bathrooms
- Heating & cooling: Heating present (details: see remarks); Cooling present (details: see remarks)
- Interior features: One-level home; Main-level entry; Living room; Kitchen; Has heating (see remarks); Has cooling (see remarks); Has fireplace (see remarks)
- Laundry & utility: No laundry features listed
Neighborhood map
What this means for you Summary
Snapshot
- This is a 4-bed/2.0-bath single-family listed at $105k.
Deal economics
- At list price, monthly cash flow is $159 ($2k/yr) — positive.
- The deal already cash-flows at list — no discount required.
- Meets the 1% rule at list price ($1k rent vs $105k).
- Cap rate 8.1% vs local median 3.8% in Clearlake — top-decile yield for the area; either an underpriced asset or a hidden risk that comps aren't pricing in. Stress-test before assuming the spread holds.
Location & tenants
- Location reads 61/100 on livability (#549 in CA) — a middle-class / working-renter tenant base. Strengths: housing A+, health & safety A+; Watch: schools F, crime F, amenities F.
- Konocti Unified (town): math 9% / reading 21% proficiency, ranked #494 of 517 in CA (top 96%) — low school quality limits family demand, transient renter base, plan for 1-2y turnover; 77% free/reduced lunch — lower-income household profile, screen leases tightly.
- Market conditions: 292 active listings in the ZIP; 1 comparable units currently listed for rent nearby; 107 units permitted in Lake County in 2024 (40 in 5+ unit buildings).
Forward outlook
- Local home prices are declining (-3.0%/yr); year-one equity from $726 of loan paydown is wiped out by about $3k of value loss. Plan a longer hold.
- Lake County population projected at -15% by 2050 — secular population decline; favor cash flow + early exit over multi-decade hold.
Negotiation context
- Only 8 days on market — expect competitive offers; lowballing is unlikely to land.
- 4 sale attempts since 26y ago with the ask held roughly flat each time — persistent listings suggest the price (not the market) is what's stuck; bring a comps-based counter.
Risks & watch-outs
- Watch-outs: property tax is 4.0% of price.
- Climate carrying-cost: severe wildfire risk; extreme-heat days projected 7→14/yr by 2055 (HVAC capex compounding) — expect insurance premiums to compound above CPI over the hold.
Questions for the listing agent
- Built in 1972 — when were the roof, HVAC, electrical panel, plumbing, and water heater last replaced?
- Property tax is high relative to price — has the assessment been appealed recently, and will the sale trigger a re-assessment?
- Is there a deadline driving the sale (1031 exchange, divorce, estate, relocation)? That informs how much negotiation room exists.
- Schools are F-rated, which usually means shorter tenancies and higher turnover. Who's the typical renter profile here, and what's been the actual vacancy rate?
- Crime grade is F in this area — have there been break-ins, vandalism, or insurance claims at this property in the last 3 years? What carrier currently insures it and at what premium?
- What's the average days-on-market for RENTAL listings here right now (not sales)? A rising rental-DOM trend means longer vacancies and softer asking-rent achievability than the comps imply.
- What's the recent tenant-quality profile in this submarket — average credit score on applications, eviction rate, late-payment / NSF rate, and stable-employment percentage? A property-management company in the area should have these aggregated.
- How much new for-sale + rental construction is in the pipeline within 1–3 miles? Heavy new supply typically softens prices + rents 12–24 months out; constrained supply supports both.
Investment metrics
- 1% rule
- 1.33% ✓
- Cap rate
- 8.11%
- Cash-on-cash
- 6.49%
- DSCR
- 1.29
- GRM
- 6.2
CMA / ARV
- ARV (on-the-fly)
- $335,016
- Comps found
- 6
Show comp detail 6 sales within ~0.75 mi
| Address | Dist | Beds/Ba | Sqft | Sold | Price | $/sf | Match |
|---|---|---|---|---|---|---|---|
| 16182 43rd Ave | 0.30mi | 3/2.0 (-1) | 1,885 (+6%) | 9mo | $355,000 | $188 | 63 |
| 16223 31st Ave | 0.55mi | 4/3.0 | 1,848 (+4%) | 3mo | $420,000 | $227 | 62 |
| 3884 Villa Ave | 0.37mi | 3/2.0 (-1) | 1,780 (-0%) | 23mo | $206,000 | $116 | 58 |
| 16143 42nd Ave | 0.24mi | 3/2.0 (-1) | 1,698 (-5%) | 21mo | $305,000 | $180 | 58 |
| 15280 Konocti | 0.72mi | 4/3.0 | 1,870 (+5%) | 18mo | $455,000 | $243 | 39 |
| 15373 Hudson St | 0.67mi | 3/2.0 (-1) | 1,916 (+8%) | 16mo | $249,000 | $130 | 38 |
Match score weights: distance 35% · size 25% · config 20% · recency 20%. Top-matched comps best support the ARV.
Projected returns pro-forma
-3.0% appreciation · 3.0% rent growth · sell at horizon
- IRR
- -6.2%
- Equity multiple
- 0.77×
- Total profit
- $-6,728
- Equity at exit
- $15,656
- IRR
- 3.6%
- Equity multiple
- 1.27×
- Total profit
- $7,823
- Equity at exit
- $9,078
Cash invested: $29,400 (down + closing). Projections, not guarantees.
Landlord ↔ Tenant lean methodology
- Overall (STATE)
- 18 Strongly Tenant-Friendly
- State California
- 18 Strongly Tenant-Friendly · D+13
- County
- — inherits STATE
- City
- — inherits STATE
ZIP-level market 95422
- Home prices YoY
- -33.4%
- Active inventory
- 292
- Price-to-rent
- 6.2×
Monthly cashflow live
- Estimated rent
- $1,400 medium interval (Pro) →
- Mortgage (P&I)
- −$551
- Tax from tax record
- −$353 /mo · $4,231/yr
- Insurance
- −$44
- HOA
- −$0
- Vacancy / Maint / Mgmt
- −$294
- Net cashflow
- $159
Break-even live
UW: 25.0% down · 7.5% · 30yr · 1.5% tax · 5.0% vac · 8.0% maint · 8.0% mgmt
Financing live
Cash to close
- Down payment
- $26,250
- Closing costs
- $3,150
- Reserves months
- —
- Total cash needed
- —
Loan-product check · same deal, 3 products live
Conventional
25% down · 7.5% · 30yr
- Down + closing
- —
- Monthly P&I
- —
- Monthly cashflow
- —
- DSCR
- —
- Eligible?
- —
Personal DTI + credit; lowest rate.
DSCR
20% down · 8.5% · 30yr
- Down + closing
- —
- Monthly P&I
- —
- Monthly cashflow
- —
- DSCR
- —
- Eligible?
- —
No personal income docs; deal must DSCR.
Hard money
10% down · 12.0% · 12mo
- Down + closing
- —
- Monthly P&I
- —
- Monthly cashflow
- —
- DSCR
- —
- Eligible?
- —
Short-term bridge; refi at stabilization.
Rent comps 1 comps
| Address | Beds | Baths | Sqft | Rent | $/sqft | DOM | Units | Dist |
|---|---|---|---|---|---|---|---|---|
| 5935 Old Highway 53 Spc 32 MH (Park Owned) Clearlake, CA | 3.0 | 2.0 | 1300 | $1,400 | $1.08 | 20d | 1 | 1.27mi |
Listing history 8 events
-
2026-06-19days on market $105,000 Active 8 DOM
-
2026-06-18days on market $105,000 Active 7 DOM
-
2026-06-17days on market $105,000 Active 6 DOM
-
2026-06-16days on market $105,000 Active 5 DOM
-
2026-06-15days on market $105,000 Active 4 DOM
-
2026-06-14days on market $105,000 Active 2 DOM
-
2026-06-13remarks 535-char remark
-
2026-06-13$105,000 Active 1 DOM
ⓘ Source: listings_history table (triggers on properties + properties_extension) + one-shot
backfill from property_details.listing_events for pre-trigger history.
Tax reassessment forecast CA · Resets to sale price
- Current annual tax
- $4,231 · $353/mo
- Projected year-2 tax
- $4,231 · $353/mo
- Expected delta
- $0/yr ($0/mo · 0.0%)
ⓘ Screening estimate from a state-policy table — verify with the county assessor before closing.
Climate risk First Street
- Flood 1/10 Low FEMA zone D · 0% chance over 30 yrs
- Wildfire 10/10 Extreme
- Heat 6/10 Major 7 d/yr ≥100°F today · 14 d/yr by 30 yrs out
- Wind 1/10 Low
- Air quality 10/10 Extreme 31 unhealthy d/yr today · 33 by 30 yrs out
Nearby sold comps map
Loading sold comps map…
Walkable amenities ~0.75 mi
Loading nearby amenities…
Taxation est. · year 1
- Rental income
- $16,800
- − Mortgage interest
- −$5,882
- − Property taxes
- −$4,231
- − Insurance
- −$525
- − Repairs & maintenance
- −$1,344
- − Management
- −$1,344
- − Depreciation
- −$3,055
- Taxable income
- $420
- Est. tax owed @ 24.0%
- −$101
- After-tax cash flow
- $1,808/yr
For passive investors: Depreciation is non-cash, so a rental often shows a tax loss while cash-flowing — sheltering income. Rental losses are passive: they offset passive income freely, and up to $25,000/yr can offset ordinary (W-2) income if you actively participate and your MAGI is under $100k (phasing out to $0 by $150k); unused losses carry forward. On sale, claimed depreciation is recaptured at up to 25%, and gains may owe capital-gains tax (a 1031 exchange can defer both). Figures are a year-1 estimate at your 24.0% rate — not tax advice; consult a CPA.
Schools (NCES district)
- District
- Konocti Unified
- NCES district ID
- 0620070
- Math proficiency
- 9% ▼ -5.00%
- Reading proficiency
- 21% ▼ -6.00%
- Median HH income
- $30,026
- Composite
- 11.81/100
- National rank
- #9677
- State rank
- #494 of 517 in CA
Livability — Clearlake
- Score
- 61/100
- State rank
- #549
- US rank
- #18284
Category grades
Schools grade is shown separately in the Schools card above.
Census & demographics
- Census place
- Clearlake, CA
- Population (ZIP)
- 17,101
Population outlook (Lake County) Hauer SSP2
- Today (2025)
- 62,396 people
- By 2030
- 60,626 · -2.8%
- By 2040
- 56,453 · -9.5%
- By 2050
- 53,054 · -15.0%
- By 2075
- 47,663 · -23.6%
- By 2100
- 41,804 · -33.0%
Race, ethnicity, and origin ACS 2023
- Neighborhood character
- Diverse neighborhood (Simpson 0.59)
- Race & ethnicity
- White 56% Hispanic / Latino 30% Two or more races 15% Black 4% Native American 3% Asian 1%
- Hispanic origin (detail)
- Mexican 26%
- Common ancestry
- Lithuanian 3% Italian 1% Russian 1%
- Foreign-born
- 10% · Canada
- Languages at home
- 77% English-only · Spanish 22% Other Indo-European 1%
Political lean MEDSL · Lake
- 2024 margin
- Toss-up / Even · D 47.8% · R 49.2% · Other 3.0%
- 2008→2024 swing
- -20.6pp toward R · 2008: 19.3pp · 2024: -1.4pp
- All cycles
- 2024: R+1.4 2020: D+6.3 2016: D+3.7 2012: D+16.5 2008: D+19.3
Not yet ingested
- Civics
- —
Market trends
- HPI YoY
- ▼ -124.47%
- Current HPI
- 248.654
- Rent YoY
- —
- Metro
- —
- State GDP YoY
- ▲ 3.21%
- F500 in state
- 116
Industry mix (Fortune 500 HQ in CA)
| Industry | F500 HQs | Revenue |
|---|---|---|
| Technology | 27 | $1,492B |
|
||
| Financial Services | 3 | $174B |
|
||
| Retail | 3 | $44B |
|
||
| Insurance | 3 | $26B |
|
||
| Media / Entertainment | 2 | $115B |
|
||
| Pharmaceuticals / Biotech | 2 | $62B |
|
||
Price history
+9.4% since first listed9 events — show timeline
- 2026-06-11 Listed $105,000 CRMLS
- 2005-08-31 Sold (Public Records) $200,000 Public Records
- 2005-08-31 Sold (MLS) $200,000 CRMLS
- 2005-05-01 Listed $200,000 CRMLS
- 2004-11-01 Listing Removed — CRMLS
- 2004-01-30 Listed $180,000 CRMLS
- 2000-06-26 Sold (MLS) $90,000 CRMLS
- 2000-06-21 Sold (Public Records) $80,000 Public Records
- 2000-02-07 Listed $96,000 CRMLS
Property tax history
+2.9%/yrLatest (2025): $4,231 · +10.2% YoY. Source: county tax records.
Cash-flow waterfall
monthlySold comps — $/sqft
last 12 mo · ≤1 miLoading sold comps…