600 Rio Vista Ln Unit 47E · Red Bluff, CA
Flood risk 9/10 · Severe
- FEMA flood zone
- X (shaded)
- Chance of flooding over 30 yrs
- 0.99%
- Est. flood insurance / yr
- $507 – $1,088
Fire risk 8/10 · Major
- Est. fire insurance / yr
- $659 – $1,223
Heat risk 8/10 · Major
- Hot days now (above 105°F)
- 7 days/yr
- Hot days in 30 yrs
- 15 days/yr
Wind risk 1/10 · Minimal
- Chance of severe wind over 30 yrs
- —
Air-quality risk 10/10 · Severe
- Unhealthy air days now
- 32 days/yr
- Unhealthy air days in 30 yrs
- 34 days/yr
Risk factors via First Street. Map © Google.
Why this score? — see what drove the B grade
The composite is a weighted blend of 9 inputs, each scored 0–100. Each bar is that input's sub-score; the figure is the points it added to the 100-point composite (weight × sub-score).
- Cash flow +30.0/30.0
- 1% rule +10.0/10.0
- DSCR +10.0/10.0
- ARV discount +7.5/15.0
- Condition / age +3.8/5.0
- Schools +3.3/10.0
- Livability +2.9/5.0
- Rent growth +2.7/5.0
- Appreciation +0.0/10.0
$69,800
🖨 Deal sheet 📄 Offer letter ✓ Due diligence
Listing remarks
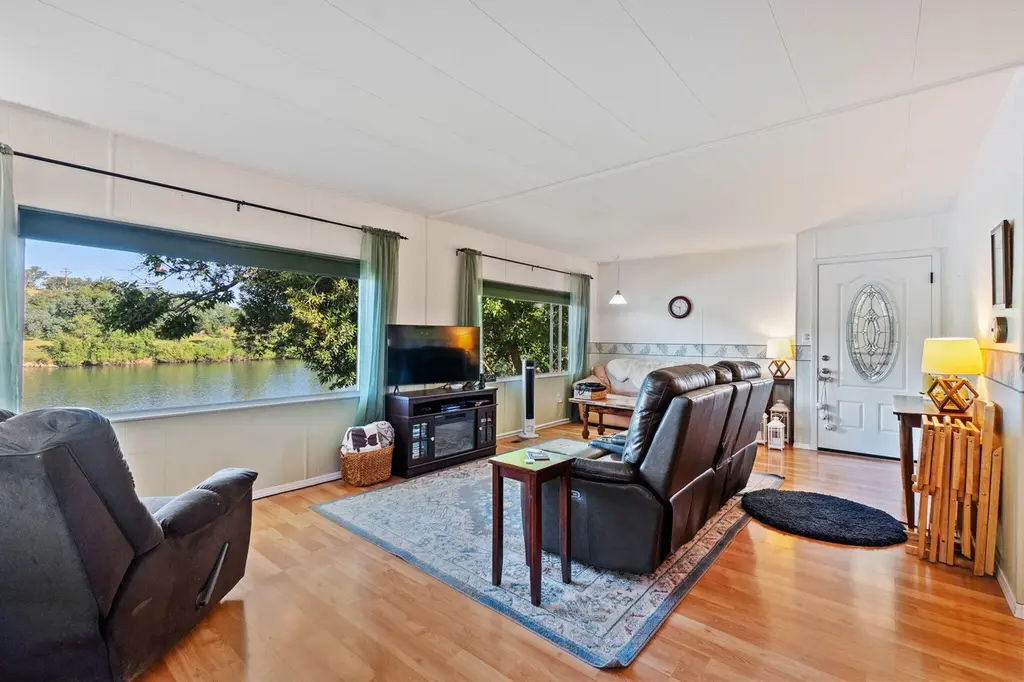
Ever Dreamed of living on the River? Million Dollar Views Can Be all yours!!! Tucked within a peaceful park setting, this well-cared-for mobile home offers a relaxed, retreat-like feel with unparalleled views of the Sacramento River in your living room and access to the river right out your front door. With two bedrooms and two bathrooms, the home provides a comfortable layout that's both functional and inviting, ready for everyday living or a quiet getaway. Step outside and enjoy the natural surroundings--open skies, gentle breezes, and the calming presence of the river just beyond your door. Whether it's morning coffee with a view or unwinding at the water's edge, this setting brings a se
Key facts
- Access to the river
- River views
- Natural surroundings
Tags
Property features AI
Finance
- Other: Model: United States
- HOA & community: Located in River Ranch park
Exterior
- Parking: 2 parking spaces; Guest parking available
- Utilities: Has view
- Home design: Manufactured home in a park; Mobile home
- Construction: Aluminum siding; Block foundation; Other roof type; Skirted with aluminum
- Exterior features: Waterfront setting with views; Asphalt road access; Downsloping to level topography
Interior
- Heating & cooling: Central Air; Has heating
- Interior features: Central air conditioning; Has heating; No fireplace
Neighborhood map
What this means for you Summary
Snapshot
- This is a 2-bed/2.0-bath manufactured listed at $70k. Condition is rated good.
Deal economics
- At list price, monthly cash flow is $606 ($7k/yr) — positive.
- The deal already cash-flows at list — no discount required.
- Meets the 1% rule at list price ($1k rent vs $70k).
- Recommended offer: $68k (3.0% below list) — sets the bar for market timing.
- Cap rate 17.8% vs local median 3.7% in Red Bluff — top-decile yield for the area; either an underpriced asset or a hidden risk that comps aren't pricing in. Stress-test before assuming the spread holds.
Location & tenants
- Location reads 58/100 on livability (#698 in CA) — a working-class tenant base; expect higher turnover. Strengths: health & safety A+, housing A-; Watch: cost of living D, crime F, amenities F.
- Antelope Elementary (town): math 34% / reading 44% proficiency, ranked #249 of 517 in CA (top 48%) — families likely to look elsewhere, expect single-tenant / working-renter base with shorter leases.
- Market conditions: Rents flat; 262 active listings in the ZIP; 186 units permitted in Tehama County in 2024 (0 in 5+ unit buildings).
Forward outlook
- Local home prices are declining (-3.0%/yr); year-one equity from $483 of loan paydown is wiped out by about $2k of value loss. Plan a longer hold.
- Tehama County population projected at -14% by 2050 — secular population decline; favor cash flow + early exit over multi-decade hold.
- At projected returns (-3.0% appreciation + 1.0% rent growth), your $20k cash investment doubles in ~4 years — after that, you're playing with house money.
Negotiation context
- It's been on market 43 days — a 3% lower offer ($68k) is reasonable based on typical stale-listing flexibility.
Risks & watch-outs
- Watch-outs: flood insurance adds $66/mo.
- Climate carrying-cost: severe flood risk; severe wildfire risk; extreme-heat days projected 7→15/yr by 2055 (HVAC capex compounding) — expect insurance premiums to compound above CPI over the hold.
Questions for the listing agent
- It's been on market 43 days. Have you received any prior offers? Is the seller open to a 3% concession, seller financing, or rate buy-down credit?
- Built in 1971 — when were the roof, HVAC, electrical panel, plumbing, and water heater last replaced?
- What's the actual annual flood-insurance premium (NFIP or private), and is the property in a SFHA with mandatory coverage?
- Is there a deadline driving the sale (1031 exchange, divorce, estate, relocation)? That informs how much negotiation room exists.
- Crime grade is F in this area — have there been break-ins, vandalism, or insurance claims at this property in the last 3 years? What carrier currently insures it and at what premium?
- What's the average days-on-market for RENTAL listings here right now (not sales)? A rising rental-DOM trend means longer vacancies and softer asking-rent achievability than the comps imply.
- What's the recent tenant-quality profile in this submarket — average credit score on applications, eviction rate, late-payment / NSF rate, and stable-employment percentage? A property-management company in the area should have these aggregated.
- How much new for-sale + rental construction is in the pipeline within 1–3 miles? Heavy new supply typically softens prices + rents 12–24 months out; constrained supply supports both.
Investment metrics
- 1% rule
- 2.09% ✓
- Cap rate
- 17.85%
- Cash-on-cash
- 41.26%
- DSCR
- 2.84
- GRM
- 4.0
CMA / ARV
- ARV (on-the-fly)
- $44,640
- Comps found
- 12
Show comp detail 12 sales within ~0.75 mi
| Address | Dist | Beds/Ba | Sqft | Sold | Price | $/sf | Match |
|---|---|---|---|---|---|---|---|
| 136 Casa Grande Dr | 0.18mi | 2/2.0 | 1,440 (0%) | 5mo | $18,000 | $13 | 88 |
| 112 Casa Grande Dr | 0.18mi | 2/2.0 | 1,440 (0%) | 6mo | $45,000 | $31 | 87 |
| 95 Casa Grande Dr | 0.20mi | 2/2.0 | 1,440 (0%) | 6mo | $25,000 | $17 | 86 |
| 84 Casa Grande Dr | 0.18mi | 2/2.0 | 1,440 (0%) | 13mo | $69,000 | $48 | 81 |
| 118 Casa Grande Dr | 0.17mi | 2/2.0 | 1,440 (0%) | 14mo | $28,000 | $19 | 80 |
| 149 Casa Grande Dr Unit Rio Vista Estates | 0.19mi | 2/2.0 | 1,440 (0%) | 14mo | $81,000 | $56 | 79 |
| 114 Casa Grande Dr | 0.18mi | 2/2.0 | 1,440 (0%) | 17mo | $45,000 | $31 | 78 |
| 167 Casa Grande Dr | 0.19mi | 2/2.0 | 1,560 (+8%) | 6mo | $44,000 | $28 | 72 |
| 88 Casa Grande Dr | 0.18mi | 2/2.0 | 1,554 (+8%) | 8mo | $40,000 | $26 | 72 |
| 80 Casa Grande Dr | 0.18mi | 3/2.0 (+1) | 1,540 (+7%) | 8mo | $70,200 | $46 | 69 |
| 162 Casa Grande Dr | 0.17mi | 3/2.0 (+1) | 1,300 (-10%) | 4mo | $78,000 | $60 | 68 |
| 103 Rio Vista Ln | 0.02mi | 2/2.0 | 1,248 (-13%) | 17mo | $45,000 | $36 | 62 |
Match score weights: distance 35% · size 25% · config 20% · recency 20%. Top-matched comps best support the ARV.
Projected returns pro-forma
-3.0% appreciation · 0.98% rent growth · sell at horizon
- IRR
- 30.7%
- Equity multiple
- 2.25×
- Total profit
- $24,410
- Equity at exit
- $10,407
- IRR
- 36.7%
- Equity multiple
- 4.05×
- Total profit
- $59,702
- Equity at exit
- $6,035
Cash invested: $19,544 (down + closing). Projections, not guarantees.
Landlord ↔ Tenant lean methodology
- Overall (STATE)
- 18 Strongly Tenant-Friendly
- State California
- 18 Strongly Tenant-Friendly · D+13
- County
- — inherits STATE
- City
- — inherits STATE
ZIP-level market 96080
- Rents YoY
- 1.0%
- Active inventory
- 262
- Price-to-rent
- 4.0×
Monthly cashflow live
- Estimated rent
- $1,461 medium interval (Pro) →
- Mortgage (P&I)
- −$366
- Tax est. 1.5%
- −$87 /mo · $1,047/yr
- Insurance
- −$29
- Flood insurance flood zone
- −$66 /mo · $798/yr
- HOA
- −$0
- Vacancy / Maint / Mgmt
- −$307
- Net cashflow
- $606
Break-even live
UW: 25.0% down · 7.5% · 30yr · 1.5% tax · 5.0% vac · 8.0% maint · 8.0% mgmt
Financing live
Cash to close
- Down payment
- $17,450
- Closing costs
- $2,094
- Reserves months
- —
- Total cash needed
- —
Loan-product check · same deal, 3 products live
Conventional
25% down · 7.5% · 30yr
- Down + closing
- —
- Monthly P&I
- —
- Monthly cashflow
- —
- DSCR
- —
- Eligible?
- —
Personal DTI + credit; lowest rate.
DSCR
20% down · 8.5% · 30yr
- Down + closing
- —
- Monthly P&I
- —
- Monthly cashflow
- —
- DSCR
- —
- Eligible?
- —
No personal income docs; deal must DSCR.
Hard money
10% down · 12.0% · 12mo
- Down + closing
- —
- Monthly P&I
- —
- Monthly cashflow
- —
- DSCR
- —
- Eligible?
- —
Short-term bridge; refi at stabilization.
Listing history 12 events
-
2026-06-14statusdays on market $69,800 Pending 43 DOM
-
2026-06-12days on market $69,800 Active 42 DOM
-
2026-06-09days on market $69,800 Active 39 DOM
-
2026-06-08days on market $69,800 Active 38 DOM
-
2026-06-07days on market $69,800 Active 37 DOM
-
2026-06-05days on market $69,800 Active 34 DOM
-
2026-06-03days on market $69,800 Active 33 DOM
-
2026-06-02days on market $69,800 Active 32 DOM
-
2026-06-01days on market $69,800 Active 31 DOM
-
2026-05-31days on market $69,800 Active 30 DOM
-
2026-05-30days on market $69,800 Active 29 DOM
-
2026-05-01$69,800 Active
ⓘ Source: listings_history table (triggers on properties + properties_extension) + one-shot
backfill from property_details.listing_events for pre-trigger history.
Climate risk First Street
- Flood 9/10 Extreme FEMA zone X (shaded) · 99% chance over 30 yrs
- Wildfire 8/10 Severe
- Heat 8/10 Severe 7 d/yr ≥105°F today · 15 d/yr by 30 yrs out
- Wind 1/10 Low
- Air quality 10/10 Extreme 32 unhealthy d/yr today · 34 by 30 yrs out
Nearby sold comps map
Loading sold comps map…
Walkable amenities ~0.75 mi
Loading nearby amenities…
Taxation est. · year 1
- Rental income
- $17,535
- − Mortgage interest
- −$3,910
- − Property taxes
- −$1,047
- − Insurance
- −$1,146
- − Repairs & maintenance
- −$1,403
- − Management
- −$1,403
- − Depreciation
- −$2,031
- Taxable income
- $6,596
- Est. tax owed @ 24.0%
- −$1,583
- After-tax cash flow
- $5,684/yr
For passive investors: Depreciation is non-cash, so a rental often shows a tax loss while cash-flowing — sheltering income. Rental losses are passive: they offset passive income freely, and up to $25,000/yr can offset ordinary (W-2) income if you actively participate and your MAGI is under $100k (phasing out to $0 by $150k); unused losses carry forward. On sale, claimed depreciation is recaptured at up to 25%, and gains may owe capital-gains tax (a 1031 exchange can defer both). Figures are a year-1 estimate at your 24.0% rate — not tax advice; consult a CPA.
Condition & rehab AI · 12 photos
This well-maintained mobile home offers a serene riverfront setting with excellent views and a comfortable layout. A fresh coat of paint on the exterior and cleaning the gutters would significantly enhance its curb appeal and value.
Value-add opportunities
- Both Paint exterior siding — Enhances curb appeal and value
- Both Clean gutters — Improves drainage and property value
Renovation cost estimate screening
Value-add ROI direction
- Both Paint exterior siding — Enhances curb appeal and value ↑
- Both Clean gutters — Improves drainage and property value ↑
ⓘ Cost ranges are severity-bucket heuristics (US national rule-of-thumb). Get contractor quotes + a written scope before underwriting a rehab budget.
Schools (NCES district)
- District
- Antelope Elementary
- NCES district ID
- 0602760
- Math proficiency
- 34% ▼ -11.00%
- Reading proficiency
- 44% ▼ -6.00%
- Median HH income
- $40,985
- Composite
- 32.77/100
- National rank
- #5630
- State rank
- #249 of 517 in CA
Livability — Red Bluff
- Score
- 58/100
- State rank
- #698
- US rank
- #21144
Category grades
Schools grade is shown separately in the Schools card above.
Census & demographics
- County
- Tehama County · 31,554 people
- City population
- 31,554
- Metro
- Red Bluff, CA
- Population (ZIP)
- 31,554
- Household income
- $66,076
- Rent vs Own
- Severe rent burden
- 981.0
Population outlook (Tehama County) Hauer SSP2
- Today (2025)
- 61,058 people
- By 2030
- 59,493 · -2.6%
- By 2040
- 56,076 · -8.2%
- By 2050
- 52,372 · -14.2%
- By 2075
- 43,895 · -28.1%
- By 2100
- 34,186 · -44.0%
Race, ethnicity, and origin ACS 2023
- Neighborhood character
- Predominantly White (71%)
- Race & ethnicity
- White 71% Hispanic / Latino 19% Two or more races 13% Native American 3% Black 2% Asian 1%
- Hispanic origin (detail)
- Mexican 17%
- Common ancestry
- Italian 2% Slovak 2% Lithuanian 2%
- Foreign-born
- 6% · Canada, Vietnam
- Languages at home
- 89% English-only · Spanish 9%
Political lean MEDSL · Tehama
- 2024 margin
- Solid R (+41.8) · D 27.9% · R 69.7% · Other 2.3%
- 2008→2024 swing
- -17.7pp toward R · 2008: -24.1pp · 2024: -41.8pp
- All cycles
- 2024: R+41.8 2020: R+35.6 2016: R+36.8 2012: R+27.4 2008: R+24.1
Not yet ingested
- Civics
- —
Market trends
- HPI YoY
- ▼ -139.80%
- Current HPI
- 246.877
- Rent YoY
- ▲ 0.98%
- Metro
- Red Bluff, CA
- State GDP YoY
- ▲ 3.21%
- F500 in state
- 116
Industry mix (Fortune 500 HQ in CA)
| Industry | F500 HQs | Revenue |
|---|---|---|
| Technology | 27 | $1,492B |
|
||
| Financial Services | 3 | $174B |
|
||
| Retail | 3 | $44B |
|
||
| Insurance | 3 | $26B |
|
||
| Media / Entertainment | 2 | $115B |
|
||
| Pharmaceuticals / Biotech | 2 | $62B |
|
||
Price history
1 event — show timeline
- 2026-05-01 Listed $69,800 SAOR
Cash-flow waterfall
monthlySold comps — $/sqft
last 12 mo · ≤1 miLoading sold comps…