2481 Kaanapali Pkwy Unit 760/T · Kaanapali, HI
Flood risk 6/10 · Moderate
- FEMA flood zone
- X (unshaded)
- Chance of flooding over 30 yrs
- 0.72%
- Est. flood insurance / yr
- $507 – $1,088
Fire risk No data
- Est. fire insurance / yr
- —
Heat risk No data
- Hot days now (above threshold)
- —
- Hot days in 30 yrs
- —
Wind risk No data
- Chance of severe wind over 30 yrs
- —
Air-quality risk 1/10 · Minimal
- Unhealthy air days now
- —
- Unhealthy air days in 30 yrs
- —
Risk factors via First Street. Map © Google.
Why this score? — see what drove the B+ grade
The composite is a weighted blend of 9 inputs, each scored 0–100. Each bar is that input's sub-score; the figure is the points it added to the 100-point composite (weight × sub-score).
- Cash flow +30.0/30.0
- ARV discount +10.8/15.0
- 1% rule +10.0/10.0
- DSCR +10.0/10.0
- Schools +3.7/10.0
- Livability +3.6/5.0
- Rent growth +3.5/5.0
- Condition / age +2.5/5.0
- Appreciation +1.2/10.0
$85,000
🖨 Deal sheet 📄 Offer letter ✓ Due diligence
Listing remarks MLS
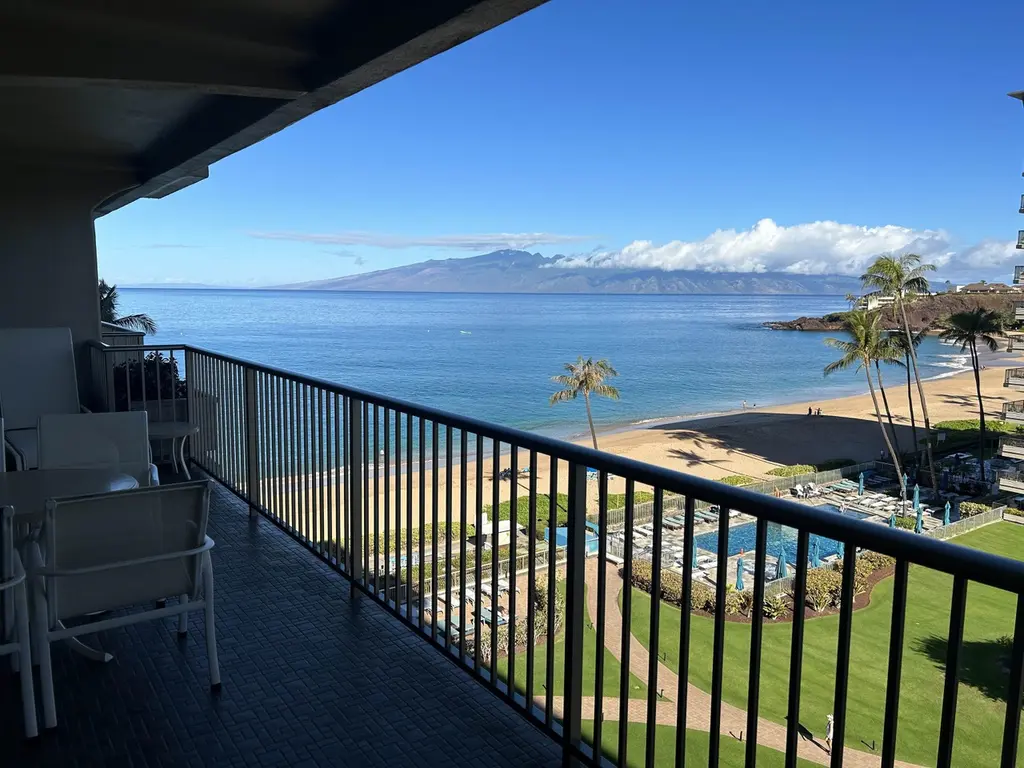
Whaler TIO 760 T [Sept 16 - Sept 30]. The TIO 760S is also for sale, offering 4 weeks of uninterrupted occupancy every year. With postcard-perfect views of Black Rock and iconic Kaanapali Beach, Whaler TIO 760 offers one of the most coveted locations within the Whaler Time Interval Ownership program. From your shaded lanai on the courtyard side of Tower 2 you can spend the day overlooking the golden sands of Kaanapali, then unwind in the evening as you watch the legendary Black Rock cliff dive ritual against a glowing sunset. Inside, this property goes beyond the standard TIO upgrades. With luxury Hawaiiana furnishings and curated artwork. Sharing your island home with friends and family is easy with a comfortable Murphy wall bed in the living room. The added glass kitchen backsplash adds a little sparkle as you prepare and serve meals at the large glass dining table. Whaler TIO 760 isn’t just a unit—it’s a front-row seat to the very best of Kaanapali Beach and within one of Maui’s premier oceanfront resorts.
Key facts
- Front-row seat
- Shaded lanai
- 6.67 acre lot
Tags
Neighborhood map
What this means for you Summary
Snapshot
- This is a 1-bed/2.0-bath timeshare listed at $85k.
Deal economics
- At list price, monthly cash flow is $2k ($25k/yr) — positive.
- The deal already cash-flows at list — no discount required.
- Meets the 1% rule at list price ($3k rent vs $85k).
- Recommended offer: $75k (12.0% below list) — sets the bar for market timing.
Location & tenants
- Location reads 72/100 on livability (#19 in HI) — a middle-class / working-renter tenant base. Strengths: crime A+, employment A+, commute B+; Watch: health & safety C-, amenities F, cost of living F.
- Hawaii Department Of Education (suburban): math 32% / reading 50% proficiency, ranked #1 of 1 in HI (top 100%) — families likely to look elsewhere, expect single-tenant / working-renter base with shorter leases.
- Market conditions: Rents rising (+4.0%/yr); 637 active listings in the ZIP; solid renter incomes; 906 units permitted in Maui County in 2024 (289 in 5+ unit buildings).
- This rent runs 40% of the median local income ($101k/yr) — at the standard rent-burdened threshold; future hikes will face affordability resistance.
Forward outlook
- Local home prices are declining (-3.0%/yr); year-one equity from $588 of loan paydown is wiped out by about $3k of value loss. Plan a longer hold.
- Maui County population projected at +22% by 2050 — long-run rental-demand tailwind backs the buy-and-hold thesis.
- At projected returns (-3.0% appreciation + 4.0% rent growth), your $24k cash investment doubles in ~2 years — after that, you're playing with house money.
Negotiation context
- It's been on market 262 days — a 12% lower offer ($75k) is reasonable based on typical stale-listing flexibility.
Risks & watch-outs
- Climate carrying-cost: major flood risk — expect insurance premiums to compound above CPI over the hold.
Questions for the listing agent
- It's been on market 262 days. Have you received any prior offers? Is the seller open to a 12% concession, seller financing, or rate buy-down credit?
- Built in 1976 — when were the roof, HVAC, electrical panel, plumbing, and water heater last replaced?
- Why hasn't it sold? Are there any deal-killer items the seller is aware of (foundation, flood, title, zoning, code violations)?
- Is there a deadline driving the sale (1031 exchange, divorce, estate, relocation)? That informs how much negotiation room exists.
- What's the average days-on-market for RENTAL listings here right now (not sales)? A rising rental-DOM trend means longer vacancies and softer asking-rent achievability than the comps imply.
- What's the recent tenant-quality profile in this submarket — average credit score on applications, eviction rate, late-payment / NSF rate, and stable-employment percentage? A property-management company in the area should have these aggregated.
- How much new for-sale + rental construction is in the pipeline within 1–3 miles? Heavy new supply typically softens prices + rents 12–24 months out; constrained supply supports both.
Investment metrics
- 1% rule
- 3.93% ✓
- Cap rate
- 35.30%
- Cash-on-cash
- 103.59%
- DSCR
- 5.61
- GRM
- 2.1
CMA / ARV
- ARV (median comp)
- $91,636
- List price
- $85,000
- Delta
- -7.24%
- Verdict
- FAIR
- Comps
- 20 within 1.0 mi
Show comp detail 6 sales within ~0.75 mi
| Address | Dist | Beds/Ba | Sqft | Sold | Price | $/sf | Match |
|---|---|---|---|---|---|---|---|
| 2481 Kaanapali Pkwy Unit 760 G | 0.00mi | 1/2.0 | 905 (+0%) | 5mo | $96,000 | $106 | 95 |
| 2481 Kaanapali Pkwy Unit 157 Z | 0.00mi | 1/2.0 | 905 (+0%) | 15mo | $25,000 | $28 | 87 |
| 2481 Kaanapali Pkwy Unit 610 Z | 0.00mi | 1/2.0 | 905 (+0%) | 16mo | $75,000 | $83 | 86 |
| 2481 Kaanapali Pkwy Unit 1259G | 0.04mi | 1/1.0 | 901 (0%) | 11mo | $79,000 | $88 | 85 |
| 2481 Kaanapali Pkwy Unit 719 D | 0.00mi | 1/1.0 | 901 (0%) | 15mo | $105,000 | $117 | 83 |
| 2481 Kaanapali Pkwy Unit 901/R | 0.04mi | 1/2.0 | 941 (+4%) | 11mo | $138,000 | $147 | 81 |
Match score weights: distance 35% · size 25% · config 20% · recency 20%. Top-matched comps best support the ARV.
Projected returns pro-forma
-3.0% appreciation · 3.97% rent growth · sell at horizon
- IRR
- —
- Equity multiple
- 6.06×
- Total profit
- $120,421
- Equity at exit
- $12,674
- IRR
- —
- Equity multiple
- 13.07×
- Total profit
- $287,347
- Equity at exit
- $7,349
Cash invested: $23,800 (down + closing). Projections, not guarantees.
Landlord ↔ Tenant lean methodology
- Overall (STATE)
- 37 Tenant-Leaning
- State Hawaii
- 37 Tenant-Leaning · D+13
- County
- — inherits STATE
- City
- — inherits STATE
ZIP-level market 96761
- Home prices YoY
- -1.9%
- Rents YoY
- 4.0%
- Active inventory
- 637
- Price-to-rent
- 2.1×
Monthly cashflow live
- Estimated rent
- $3,344 medium interval (Pro) →
- Mortgage (P&I)
- −$446
- Tax est. 1.5%
- −$106 /mo · $1,275/yr
- Insurance
- −$35
- HOA
- −$0
- Vacancy / Maint / Mgmt
- −$702
- Net cashflow
- $2,054
Break-even live
UW: 25.0% down · 7.5% · 30yr · 1.5% tax · 5.0% vac · 8.0% maint · 8.0% mgmt
Financing live
Cash to close
- Down payment
- $21,250
- Closing costs
- $2,550
- Reserves months
- —
- Total cash needed
- —
Loan-product check · same deal, 3 products live
Conventional
25% down · 7.5% · 30yr
- Down + closing
- —
- Monthly P&I
- —
- Monthly cashflow
- —
- DSCR
- —
- Eligible?
- —
Personal DTI + credit; lowest rate.
DSCR
20% down · 8.5% · 30yr
- Down + closing
- —
- Monthly P&I
- —
- Monthly cashflow
- —
- DSCR
- —
- Eligible?
- —
No personal income docs; deal must DSCR.
Hard money
10% down · 12.0% · 12mo
- Down + closing
- —
- Monthly P&I
- —
- Monthly cashflow
- —
- DSCR
- —
- Eligible?
- —
Short-term bridge; refi at stabilization.
Listing history 15 events
-
2026-06-18days on market $85,000 Active 262 DOM
-
2026-06-17days on market $85,000 Active 261 DOM
-
2026-06-15days on market $85,000 Active 259 DOM
-
2026-06-13days on market $85,000 Active 257 DOM
-
2026-06-13days on market $85,000 Active 256 DOM
-
2026-06-10days on market $85,000 Active 254 DOM
-
2026-06-09days on market $85,000 Active 253 DOM
-
2026-06-08days on market $85,000 Active 252 DOM
-
2026-06-07days on market $85,000 Active 251 DOM
-
2026-06-05days on market $85,000 Active 248 DOM
-
2026-06-03days on market $85,000 Active 247 DOM
-
2026-06-02days on market $85,000 Active 246 DOM
-
2026-06-01days on market $85,000 Active 245 DOM
-
2026-05-31days on market $85,000 Active 244 DOM
-
2025-09-29$85,000 Active 1050-char remark
Show marketing remark (1050 chars)
Whaler TIO 760 T [Sept 16 - Sept 30]. The TIO 760S is also for sale, offering 4 weeks of uninterrupted occupancy every year. With postcard-perfect views of Black Rock and iconic Kaanapali Beach, Whaler TIO 760 offers one of the most coveted locations within the Whaler Time Interval Ownership program. From your shaded lanai on the courtyard side of Tower 2 you can spend the day overlooking the golden sands of Kaanapali, then unwind in the evening as you watch the legendary Black Rock cliff dive ritual against a glowing sunset. Inside, this property goes beyond the standard TIO upgrades. With luxury Hawaiiana furnishings and curated artwork. Sharing your island home with friends and family is easy with a comfortable Murphy wall bed in the living room. The added glass kitchen backsplash adds a little sparkle as you prepare and serve meals at the large glass dining table. Whaler TIO 760 isn’t just a unit—it’s a front-row seat to the very best of Kaanapali Beach and within one of Maui’s premier oceanfront resorts.
ⓘ Source: listings_history table (triggers on properties + properties_extension) + one-shot
backfill from property_details.listing_events for pre-trigger history.
Climate risk First Street
- Flood 6/10 Major FEMA zone X (unshaded) · 72% chance over 30 yrs
- Air quality 1/10 Low
Nearby sold comps map
Loading sold comps map…
Walkable amenities ~0.75 mi
Loading nearby amenities…
Taxation est. · year 1
- Rental income
- $40,130
- − Mortgage interest
- −$4,761
- − Property taxes
- −$1,275
- − Insurance
- −$425
- − Repairs & maintenance
- −$3,210
- − Management
- −$3,210
- − Depreciation
- −$2,473
- Taxable income
- $24,775
- Est. tax owed @ 24.0%
- −$5,946
- After-tax cash flow
- $18,707/yr
For passive investors: Depreciation is non-cash, so a rental often shows a tax loss while cash-flowing — sheltering income. Rental losses are passive: they offset passive income freely, and up to $25,000/yr can offset ordinary (W-2) income if you actively participate and your MAGI is under $100k (phasing out to $0 by $150k); unused losses carry forward. On sale, claimed depreciation is recaptured at up to 25%, and gains may owe capital-gains tax (a 1031 exchange can defer both). Figures are a year-1 estimate at your 24.0% rate — not tax advice; consult a CPA.
Schools (NCES district)
- District
- Hawaii Department Of Education
- NCES district ID
- 1500030
- Math proficiency
- 32% ▼ -10.00%
- Reading proficiency
- 50% ▼ -3.00%
- Median HH income
- $69,005
- Composite
- 37.07/100
- National rank
- #4504
- State rank
- #1 of 1 in HI
Livability — Kaanapali
- Score
- 72/100
- State rank
- #19
- US rank
- #6248
Category grades
Schools grade is shown separately in the Schools card above.
Census & demographics
- Census place
- Kaanapali, HI
- County
- Maui County · 114,195 people
- Metro
- Kahului-Wailuku-Lahaina, HI
- Population (ZIP)
- 20,952
- Household income
- $101,123
- Rent vs Own
- Severe rent burden
- 835.0
Population outlook (Maui County) Hauer SSP2
- Today (2025)
- 185,013 people
- By 2030
- 194,315 · +5.0%
- By 2040
- 210,917 · +14.0%
- By 2050
- 226,396 · +22.4%
- By 2075
- 270,475 · +46.2%
- By 2100
- 316,825 · +71.2%
Race, ethnicity, and origin ACS 2023
- Neighborhood character
- Highly diverse neighborhood (Simpson 0.78)
- Race & ethnicity
- White 35% Asian 29% Two or more races 25% Hispanic / Latino 13% Pacific Islander 6%
- Hispanic origin (detail)
- Mexican 7%
- Common ancestry
- Russian 3% Lithuanian 2% Iranian 1%
- Foreign-born
- 25% · Canada, Vietnam, China
- Languages at home
- 74% English-only · Other Asian/Pacific 12% Tagalog/Filipino 6% Spanish 5%
Political lean MEDSL · Maui
- 2024 margin
- Strong D (+25.9) · D 61.9% · R 36.0% · Other 2.2%
- 2008→2024 swing
- -29.3pp toward R · 2008: 55.2pp · 2024: 25.9pp
- All cycles
- 2024: D+25.9 2020: D+35.5 2016: D+38.6 2012: D+50.3 2008: D+55.2
Not yet ingested
- Civics
- —
Market trends
- HPI YoY
- ▼ -7.68%
- Current HPI
- 389.2894
- Rent YoY
- ▲ 3.97%
- Metro
- Kahului-Wailuku-Lahaina, HI
- State GDP YoY
- —
- F500 in state
- 0
Price history
1 event — show timeline
- 2025-09-29 Listed $85,000 RAM MLS
Cash-flow waterfall
monthlySold comps — $/sqft
last 12 mo · ≤1 miLoading sold comps…