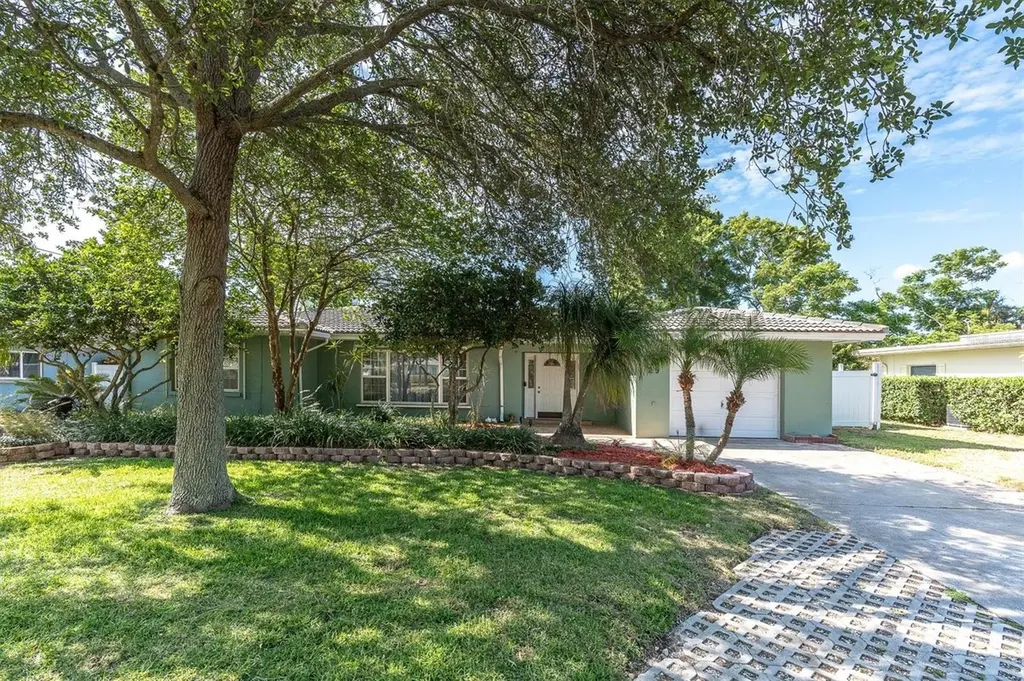
29 Southwind Dr · Belleair Bluffs, FL
Flood risk 1/10 · Minimal
- FEMA flood zone
- X (unshaded)
- Chance of flooding over 30 yrs
- 0.0%
- Est. flood insurance / yr
- $507 – $1,088
Fire risk 1/10 · Minimal
- Est. fire insurance / yr
- $947 – $1,759
Heat risk 10/10 · Severe
- Hot days now (above 107°F)
- 7 days/yr
- Hot days in 30 yrs
- 25 days/yr
Wind risk 10/10 · Severe
- Chance of severe wind over 30 yrs
- 99.0%
Air-quality risk 3/10 · Minor
- Unhealthy air days now
- 2 days/yr
- Unhealthy air days in 30 yrs
- 3 days/yr
Risk factors via First Street. Map © Google.
Why this score? — see what drove the D+ grade
The composite is a weighted blend of 9 inputs, each scored 0–100. Each bar is that input's sub-score; the figure is the points it added to the 100-point composite (weight × sub-score).
- ARV discount +15.0/15.0
- Cash flow +14.9/30.0
- DSCR +4.6/10.0
- Schools +4.3/10.0
- Livability +3.9/5.0
- 1% rule +3.0/10.0
- Condition / age +2.5/5.0
- Rent growth +1.6/5.0
- Appreciation +0.0/10.0
$524,999
🖨 Deal sheet (PDF) 📄 Offer letter ✓ Due diligence
Listing remarks
Beautifully updated 3-bedroom, 2-bath home located in desirable Belleair Bluffs, just minutes from pristine Gulf beaches, golf courses, shopping, and entertainment. This home features a well-appointed kitchen with maple cabinetry in a rich cherry finish, granite countertops, an undermount stainless steel sink, and convenient corner lazy Susan's. All stainless steel appliances are included, highlighted by a propane-fueled double oven range connected to a 250-gallon underground propane tank. Ample storage is available throughout, including a spacious center island. Energy efficiency and durability are standout features, with double-pane argon-filled vinyl windows (installed in 2003), hurrican
Key facts
- Updated kitchen
- Energy efficiency
- Granite countertops
Tags
Property features AI
Finance
- Other: Homestead exempt; Solar energy generation
Exterior
- Parking: Attached garage (1 car)
- Utilities: Public sewer; Water connected; Electricity connected; Propane available; Cable available
- Home design: Single family residence; One story; Faces north
- Construction: Block construction; Concrete, membrane, and tile roofing; Slab foundation; Built as a single-story structure
- Exterior features: Hurricane shutters; Sliding doors; Storage
Interior
- Kitchen: Dishwasher; Disposal; Microwave; Range; Range hood; Refrigerator
- Bedrooms: 3 bedrooms
- Flooring: Bamboo
- Bathrooms: 2 full bathrooms
- Heating & cooling: Electric heating; Central air conditioning
- Interior features: Ceiling fans; Stone counters; Thermostat; Walk-in closets; Skylight(s)
- Laundry & utility: Laundry area in garage
Neighborhood map
What this means for you Summary
Snapshot
- This is a 3-bed/2.0-bath single-family listed at $525k.
Deal economics
- At list price, monthly cash flow is $154 ($2k/yr) — positive.
- The deal already cash-flows at list — no discount required.
- To meet the 1% rule (rent ≥ 1% of price), the offer needs to be $421k (19.8% below list).
- Recommended offer: $421k (19.8% below list) — sets the bar for 1% rule.
Location & tenants
- Location reads 78/100 on livability (#162 in FL, #2,443 nationally) — a middle-class / working-renter tenant base. Strengths: commute A+, health & safety A+, crime A; Watch: employment C-, amenities F.
- Pinellas (suburban): math 51% / reading 51% proficiency, ranked #31 of 73 in FL (top 42%) — acceptable for families but not a draw, mixed tenant base, ~2y average lease.
- Zoned schools: Mildred Helms Elementary School (math 54% / reading 49%, grade C-, #1,035 of 2,144 statewide, top 49%, 514 students, 65% FRL); Largo Middle School (math 38% / reading 35%, grade F, #405 of 571 statewide, top 72%, 882 students, 66% FRL); Largo High School (math 30% / reading 50%, grade F, #296 of 667 statewide, top 45%, 2,055 students, 53% FRL).
- Market conditions: Rents falling (-3.5%/yr); 219 active listings in the ZIP; 12 comparable units currently listed for rent nearby; rentals at typical pace (median 23d on market — plan ~3-4 weeks tenant-placement turnaround); 2,676 units permitted in Pinellas County in 2024 (1,422 in 5+ unit buildings).
- At $4,208/mo this rent would consume 84% of the median local household income ($60k/yr) (locally 1404% of renters already pay >50% of income on rent) — very limited rent-growth headroom before tenants either downsize or default.
Forward outlook
- Local home prices are declining (-3.0%/yr); year-one equity from $4k of loan paydown is wiped out by about $16k of value loss. Plan a longer hold.
- Pinellas County population projected at +14% by 2050 — modest demand growth; plan on rents tracking national, not racing it.
Negotiation context
- It's been on market 45 days — a 3% lower offer ($509k) is reasonable based on typical stale-listing flexibility.
- 2 sale attempts with the ask held roughly flat each time — persistent listings suggest the price (not the market) is what's stuck; bring a comps-based counter.
- Current owner paid $130k; list at $525k implies a 304% gain — meaningful room to come down on a strong offer.
Risks & watch-outs
- Watch-outs: built in 1956 — expect roof / HVAC / electrical / plumbing capex.
- Climate carrying-cost: severe wind risk, 99% chance of damaging wind over 30y; extreme-heat days projected 7→25/yr by 2055 (HVAC capex compounding) — expect insurance premiums to compound above CPI over the hold.
Questions for the listing agent
- It's been on market 45 days. Have you received any prior offers? Is the seller open to a 20% concession, seller financing, or rate buy-down credit?
- Built in 1956 — when were the roof, HVAC, electrical panel, plumbing, and water heater last replaced?
- Is there a deadline driving the sale (1031 exchange, divorce, estate, relocation)? That informs how much negotiation room exists.
- Schools are D-rated, which usually means shorter tenancies and higher turnover. Who's the typical renter profile here, and what's been the actual vacancy rate?
- The area grade is low — what's the realistic commute time and amenity access for the typical tenant pool here? Any planned neighborhood developments (good or bad) we should know about?
- What's the average days-on-market for RENTAL listings here right now (not sales)? A rising rental-DOM trend means longer vacancies and softer asking-rent achievability than the comps imply.
- What's the recent tenant-quality profile in this submarket — average credit score on applications, eviction rate, late-payment / NSF rate, and stable-employment percentage? A property-management company in the area should have these aggregated.
- How much new for-sale + rental construction is in the pipeline within 1–3 miles? Heavy new supply typically softens prices + rents 12–24 months out; constrained supply supports both.
Investment metrics
- 1% rule
- 0.80% ✗
- Cap rate
- 6.65%
- Cash-on-cash
- 1.26%
- DSCR
- 1.06
- GRM
- 10.4
CMA / ARV
- ARV (on-the-fly)
- $738,833
- Comps found
- 12
Show comp detail 12 sales within ~0.75 mi
| Address | Dist | Beds/Ba | Sqft | Sold | Price | $/sf | Match |
|---|---|---|---|---|---|---|---|
| 651 20th St NW | 0.19mi | 4/2.0 (+1) | 2,026 (-4%) | 3mo | $688,000 | $340 | 76 |
| 263 Overbrook St E | 0.21mi | 3/3.0 | 2,087 (-1%) | 16mo | $530,000 | $254 | 70 |
| 14 Evonaire Cir | 0.39mi | 3/3.0 | 2,263 (+7%) | 10mo | $798,000 | $353 | 58 |
| 1700 Kay Dr | 0.56mi | 2/2.0 (-1) | 2,115 (-0%) | 15mo | $288,000 | $136 | 56 |
| 700 14th St NW | 0.57mi | 3/2.0 | 1,806 (-15%) | 2mo | $598,000 | $331 | 48 |
| 2979 Del Rio Dr | 0.48mi | 3/2.0 | 1,802 (-15%) | 7mo | $628,000 | $349 | 47 |
| 668 Mehlenbacher Rd | 0.51mi | 4/2.0 (+1) | 2,019 (-5%) | 20mo | $675,000 | $334 | 47 |
| 1 Bluff View Dr | 0.62mi | 3/2.0 | 2,219 (+5%) | 20mo | $900,000 | $406 | 46 |
| 1630 Golf View Dr | 0.43mi | 4/2.0 (+1) | 1,945 (-8%) | 19mo | $1,100,000 | $566 | 46 |
| 2826 Del Rio Dr | 0.39mi | 3/2.0 | 1,814 (-14%) | 20mo | $640,000 | $353 | 42 |
| 3069 Sunset Blvd | 0.58mi | 3/3.0 | 2,403 (+14%) | 20mo | $1,140,000 | $474 | 30 |
| 106 Indian Rocks Rd S | 0.68mi | 4/3.0 (+1) | 2,378 (+12%) | 14mo | $640,000 | $269 | 27 |
Match score weights: distance 35% · size 25% · config 20% · recency 20%. Top-matched comps best support the ARV.
Projected returns pro-forma
-3.0% appreciation · 0.0% rent growth · sell at horizon
- IRR
- -17.4%
- Equity multiple
- 0.40×
- Total profit
- $-87,811
- Equity at exit
- $78,279
- IRR
- -15.3%
- Equity multiple
- 0.24×
- Total profit
- $-112,376
- Equity at exit
- $45,392
Cash invested: $147,000 (down + closing). Projections, not guarantees.
Landlord ↔ Tenant lean methodology
- Overall (STATE)
- 87 Strongly Landlord-Friendly
- State Florida
- 87 Strongly Landlord-Friendly · R+3
- County
- — inherits STATE
- City
- — inherits STATE
ZIP-level market 33770
- Rents YoY
- -3.5%
- Active inventory
- 219
- Price-to-rent
- 10.4×
Monthly cashflow live
- Estimated rent
- $4,208 high interval (Pro) →
- Mortgage (P&I)
- −$2,753
- Tax from tax record
- −$199 /mo · $2,382/yr
- Insurance
- −$219
- HOA
- −$0
- Vacancy / Maint / Mgmt
- −$884
- Net cashflow
- $154
Break-even live
Sensitivity live
| Price | -10% $451 | -5% $303 | +0% $154 | +5% $5 | +10% $-143 |
|---|---|---|---|---|---|
| Rent | -10% $-178 | -5% $-12 | +0% $154 | +5% $320 | +10% $487 |
| Rate | -1.0pp $418 | -0.5pp $288 | base $154 | +0.5pp $18 | +1.0pp $-120 |
UW: 25.0% down · 7.5% · 30yr · 1.5% tax · 5.0% vac · 8.0% maint · 8.0% mgmt
Financing live
Cash to close
- Down payment
- $131,250
- Closing costs
- $15,750
- Reserves months
- —
- Total cash needed
- —
Loan-product check · same deal, 3 products live
Conventional
25% down · 7.5% · 30yr
- Down + closing
- —
- Monthly P&I
- —
- Monthly cashflow
- —
- DSCR
- —
- Eligible?
- —
Personal DTI + credit; lowest rate.
DSCR
20% down · 8.5% · 30yr
- Down + closing
- —
- Monthly P&I
- —
- Monthly cashflow
- —
- DSCR
- —
- Eligible?
- —
No personal income docs; deal must DSCR.
Hard money
10% down · 12.0% · 12mo
- Down + closing
- —
- Monthly P&I
- —
- Monthly cashflow
- —
- DSCR
- —
- Eligible?
- —
Short-term bridge; refi at stabilization.
Rent comps 12 comps
| Address | Beds | Baths | Sqft | Rent | $/sqft | DOM | Units | Dist |
|---|---|---|---|---|---|---|---|---|
| 233 E Overbrook St Unit 1053145P Largo, FL | 4.0 | 3.0 | 1840 | $9,009 | $4.90 | 24d | 1 | 0.24mi |
| 2131 W Bay Dr Unit B Largo, FL | 2.0 | 1.0 | 1578 | $1,700 | $1.08 | 22d | 1 | 0.38mi |
| 370 Foster Ln Belleair, FL | 4.0 | 2.5 | 2156 | $5,000 | $2.32 | 0d | 1 | 0.38mi |
| 325 Mehlenbacher Rd Belleair Bluffs, FL | 3.0 | 2.0 | 2049 | $4,500 | $2.20 | 6d | 1 | 0.44mi |
| 1006 14th Ave NW Largo, FL | 3.0 | 2.0 | 1444 | $2,450 | $1.70 | 26d | 1 | 0.92mi |
| 620 Petit Way Unit 1060749P Largo, FL | 3.0 | 3.0 | 2411 | $5,656 | $2.35 | 0d | 1 | 1.06mi |
| 623 Petit Way Largo, FL | 3.0 | 3.0 | 2420 | $7,500 | $3.10 | 5d | 1 | 1.06mi |
| 1261 12th Ct SW Largo, FL | 3.0 | 2.0 | 2086 | $4,200 | $2.01 | 22d | 1 | 1.28mi |
| 2543 Sunny Breeze Ave Unit 1520129P Largo, FL | 3.0 | 3.0 | 1905 | $5,929 | $3.11 | 0d | 1 | 1.29mi |
| 2402 Dryer Ave Largo, FL | 3.0 | 2.0 | 1872 | $3,000 | $1.60 | 26d | 1 | 1.38mi |
| 6 Belleview Blvd #306 Belleair, FL | 2.0 | 2.0 | 1403 | $3,500 | $2.49 | 26d | 1 | 1.44mi |
| 8 Belleview Blvd #601 Belleair, FL | 2.0 | 2.0 | 1403 | $3,300 | $2.35 | 26d | 1 | 1.48mi |
Listing history 13 events
-
2026-06-22days on market $524,999 Active 45 DOM
-
2026-06-18days on market $524,999 Active 42 DOM
-
2026-06-17days on market $524,999 Active 41 DOM
-
2026-06-16pricedays on market $524,999 Active 40 DOM
-
2026-06-15days on market $550,000 Active 39 DOM
-
2026-06-13days on market $550,000 Active 37 DOM
-
2026-06-09days on market $550,000 Active 33 DOM
-
2026-06-08days on market $550,000 Active 32 DOM
-
2026-06-07days on market $550,000 Active 31 DOM
-
2026-06-04days on market $550,000 Active 28 DOM
-
2026-06-03days on market $550,000 Active 27 DOM
-
2026-06-02remarks 699-char remark
-
2026-06-02$550,000 Active 25 DOM
ⓘ Source: listings_history table (triggers on properties + properties_extension) + one-shot
backfill from property_details.listing_events for pre-trigger history.
Tax reassessment forecast FL · Resets to sale price
- Current annual tax
- $2,382 · $199/mo
- Projected year-2 tax
- $4,357 · $363/mo
- Expected delta
- +$1,975/yr (+$165/mo · 82.9%)
ⓘ Screening estimate from a state-policy table — verify with the county assessor before closing.
Climate risk First Street
- Flood 1/10 Low FEMA zone X (unshaded) · 0% chance over 30 yrs
- Wildfire 1/10 Low
- Heat 10/10 Extreme 7 d/yr ≥107°F today · 25 d/yr by 30 yrs out
- Wind 10/10 Extreme 99% chance of damaging wind over 30 yrs
- Air quality 3/10 Moderate 2 unhealthy d/yr today · 3 by 30 yrs out
Nearby sold comps map
Loading sold comps map…
Walkable amenities ~0.75 mi
Loading nearby amenities…
Taxation est. · year 1
- Rental income
- $50,499
- − Mortgage interest
- −$29,408
- − Property taxes
- −$2,382
- − Insurance
- −$2,625
- − Repairs & maintenance
- −$4,040
- − Management
- −$4,040
- − Depreciation
- −$15,273
- Taxable loss
- −$7,269
- Est. tax savings @ 24.0%
- +$1,745
- After-tax cash flow
- $3,593/yr
For passive investors: Depreciation is non-cash, so a rental often shows a tax loss while cash-flowing — sheltering income. Rental losses are passive: they offset passive income freely, and up to $25,000/yr can offset ordinary (W-2) income if you actively participate and your MAGI is under $100k (phasing out to $0 by $150k); unused losses carry forward. On sale, claimed depreciation is recaptured at up to 25%, and gains may owe capital-gains tax (a 1031 exchange can defer both). Figures are a year-1 estimate at your 24.0% rate — not tax advice; consult a CPA.
Schools (NCES district)
- District
- Pinellas
- NCES district ID
- 1201560
- Math proficiency
- 51% ▼ -5.00%
- Reading proficiency
- 51% ▼ -3.00%
- Median HH income
- $46,270
- Composite
- 43.27/100
- National rank
- #3046
- State rank
- #31 of 73 in FL
Livability — Belleair Bluffs
- Score
- 78/100
- State rank
- #162
- US rank
- #2443
Category grades
Schools grade is shown separately in the Schools card above.
Census & demographics
- Census place
- Belleair Bluffs, FL
- County
- Pinellas County · 939,478 people
- Metro
- Tampa-St. Petersburg-Clearwater, FL
- Population (ZIP)
- 25,368
- Household income
- $59,815
- Rent vs Own
- Severe rent burden
- 1404.0
Population outlook (Pinellas County) Hauer SSP2
- Today (2025)
- 1,027,532 people
- By 2030
- 1,063,586 · +3.5%
- By 2040
- 1,125,020 · +9.5%
- By 2050
- 1,168,637 · +13.7%
- By 2075
- 1,265,188 · +23.1%
- By 2100
- 1,260,357 · +22.7%
Race, ethnicity, and origin ACS 2023
- Neighborhood character
- Predominantly White (75%)
- Race & ethnicity
- White 75% Hispanic / Latino 11% Two or more races 9% Black 8% Asian 1%
- Hispanic origin (detail)
- Mexican 3% Puerto Rican 3% Cuban 2%
- Common ancestry
- Lithuanian 3% Romanian 2% Slovak 2%
- Foreign-born
- 9% · Canada, Jamaica
- Languages at home
- 89% English-only · Spanish 5% Other Indo-European 2% German/W. Germanic 1%
Political lean MEDSL · Pinellas
- 2024 margin
- Lean R (+5.2) · D 46.9% · R 52.1%
- 2008→2024 swing
- -13.5pp toward R · 2008: 8.3pp · 2024: -5.2pp
- All cycles
- 2024: R+5.2 2020: D+0.2 2016: R+1.1 2012: D+5.6 2008: D+8.3
Not yet ingested
- Civics
- —
Market trends
- HPI YoY
- ▼ -317.05%
- Current HPI
- 353.8484
- Rent YoY
- ▼ -3.47%
- Metro
- Tampa-St. Petersburg-Clearwater, FL
- State GDP YoY
- ▲ 3.28%
- F500 in state
- 36
Industry mix (Fortune 500 HQ in FL)
| Industry | F500 HQs | Revenue |
|---|---|---|
| Industrial Technology | 2 | $29B |
|
||
| Insurance | 2 | $17B |
|
||
| Retail | 1 | $60B |
|
||
| Technology Distribution | 1 | $58B |
|
||
| Homebuilding | 1 | $35B |
|
||
| Technology Manufacturing | 1 | $35B |
|
||
Price history
+323.1% since first listed4 events — show timeline
- 2026-06-01 Relisted — Stellar MLS as Distributed by MLS Grid
- 2026-05-19 Listing Removed — Stellar MLS as Distributed by MLS Grid
- 2026-04-24 Listed $550,000 Stellar MLS as Distributed by MLS Grid
- 2002-03-18 Sold (Public Records) $130,000 Public Records
Property tax history
+0.0%/yrLatest (2025): $2,382 · +6.2% YoY. Source: county tax records.
Cash-flow waterfall
monthlySold comps — $/sqft
last 12 mo · ≤1 miLoading sold comps…