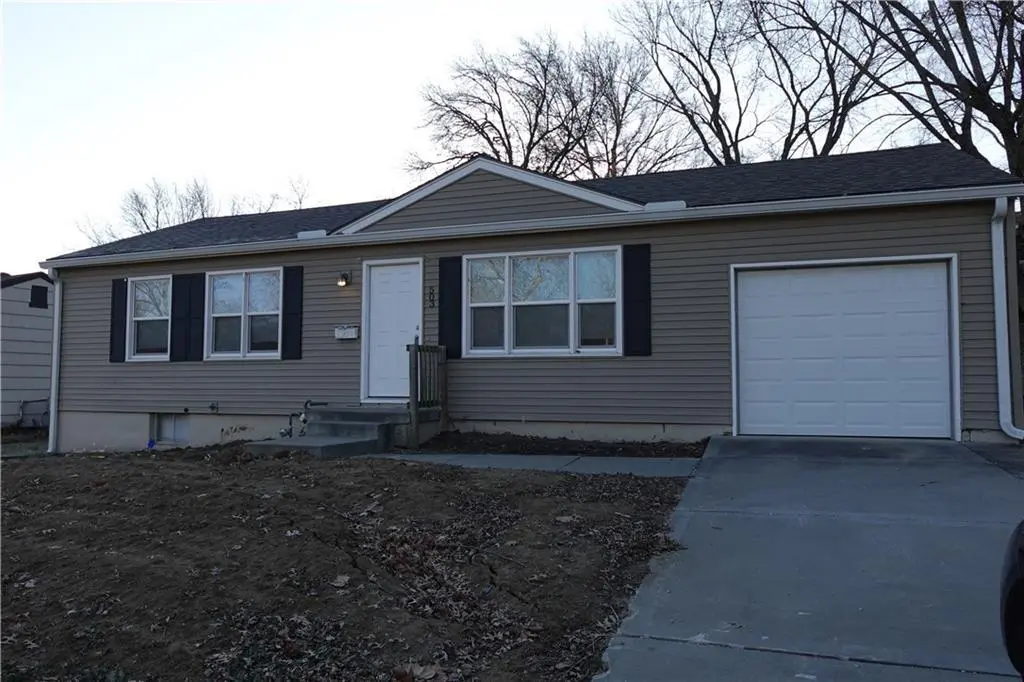
503 W Colonel Dr · Independence, MO
Flood risk 1/10 · Minimal
- FEMA flood zone
- X (unshaded)
- Chance of flooding over 30 yrs
- 0.0%
- Est. flood insurance / yr
- $473 – $860
Fire risk 1/10 · Minimal
- Est. fire insurance / yr
- $1,054 – $1,958
Heat risk 4/10 · Minor
- Hot days now (above 106°F)
- 7 days/yr
- Hot days in 30 yrs
- 16 days/yr
Wind risk 2/10 · Minimal
- Chance of severe wind over 30 yrs
- —
Air-quality risk 3/10 · Minor
- Unhealthy air days now
- 3 days/yr
- Unhealthy air days in 30 yrs
- 3 days/yr
Risk factors via First Street. Map © Google.
Why this score? — see what drove the C- grade
The composite is a weighted blend of 9 inputs, each scored 0–100. Each bar is that input's sub-score; the figure is the points it added to the 100-point composite (weight × sub-score).
- Cash flow +16.5/30.0
- ARV discount +15.0/15.0
- DSCR +5.1/10.0
- Livability +4.1/5.0
- 1% rule +4.0/10.0
- Rent growth +3.4/5.0
- Schools +2.7/10.0
- Condition / age +2.5/5.0
- Appreciation +0.0/10.0
$154,950
🖨 Deal sheet 📄 Offer letter ✓ Due diligence
Listing remarks MLS
Very livable true ranch-Clean and move in ready-numerous updates such as windows, roof, gutters, bath, sewer line, counter tops, paint, vinyl siding, deck, refinished hardwood floors throughout, garage door, etc-foundation work approved by Norton and Schmidt Engineering- nice Kentucky Hills neighborhood-Move In Ready!
Key facts
- True ranch
- Vinyl siding
- Numerous updates
Tags
Neighborhood map
What this means for you Summary
Snapshot
- This is a 3-bed/1.5-bath single-family listed at $155k.
Deal economics
- At list price, monthly cash flow is $91 ($1k/yr) — positive.
- The deal already cash-flows at list — no discount required.
- To meet the 1% rule (rent ≥ 1% of price), the offer needs to be $139k (10.3% below list).
- Recommended offer: $136k (12.0% below list) — sets the bar for market timing.
- Cap rate 7.0% vs local median 5.0% in Independence — top-decile yield for the area; either an underpriced asset or a hidden risk that comps aren't pricing in. Stress-test before assuming the spread holds.
Location & tenants
- Location reads 82/100 on livability (#10 in MO, #1,296 nationally) — a professional / high-income tenant draw. Strengths: amenities A+, commute A+, cost of living A+; Watch: schools C-, employment D+, crime F.
- Independence 30 (suburban): math 26% / reading 38% proficiency, ranked #252 of 324 in MO (top 78%) — families likely to look elsewhere, expect single-tenant / working-renter base with shorter leases.
- Market conditions: Rents rising (+3.8%/yr); 125 active listings in the ZIP; 9 comparable units currently listed for rent nearby; rentals leasing fast (median 8d on market — plan ~1-2 weeks tenant-placement turnaround); 44% of comp listings sitting > 30 days — soft ceiling on asking rent; 4,002 units permitted in Jackson County in 2024 (2,271 in 5+ unit buildings).
- This rent runs 34% of the median local income ($49k/yr) — at the standard rent-burdened threshold; future hikes will face affordability resistance.
Forward outlook
- Local home prices are declining (-3.0%/yr); year-one equity from $1k of loan paydown is wiped out by about $5k of value loss. Plan a longer hold.
- Jackson County population projected at +4% by 2050 — modest demand growth; plan on rents tracking national, not racing it.
Negotiation context
- It's been on market 161 days — a 12% lower offer ($136k) is reasonable based on typical stale-listing flexibility.
- 5 sale attempts since 8y ago; this cycle's ask has dropped $20k (11%) from the opening price — seller is motivated, your offer sets the floor, not the list.
Risks & watch-outs
- Watch-outs: built in 1959 — expect roof / HVAC / electrical / plumbing capex.
Questions for the listing agent
- It's been on market 161 days. Have you received any prior offers? Is the seller open to a 12% concession, seller financing, or rate buy-down credit?
- Built in 1959 — when were the roof, HVAC, electrical panel, plumbing, and water heater last replaced?
- Why hasn't it sold? Are there any deal-killer items the seller is aware of (foundation, flood, title, zoning, code violations)?
- Is there a deadline driving the sale (1031 exchange, divorce, estate, relocation)? That informs how much negotiation room exists.
- Crime grade is F in this area — have there been break-ins, vandalism, or insurance claims at this property in the last 3 years? What carrier currently insures it and at what premium?
- What's the average days-on-market for RENTAL listings here right now (not sales)? A rising rental-DOM trend means longer vacancies and softer asking-rent achievability than the comps imply.
- What's the recent tenant-quality profile in this submarket — average credit score on applications, eviction rate, late-payment / NSF rate, and stable-employment percentage? A property-management company in the area should have these aggregated.
- How much new for-sale + rental construction is in the pipeline within 1–3 miles? Heavy new supply typically softens prices + rents 12–24 months out; constrained supply supports both.
Investment metrics
- 1% rule
- 0.90% ✗
- Cap rate
- 7.00%
- Cash-on-cash
- 2.51%
- DSCR
- 1.11
- GRM
- 9.3
CMA / ARV
- ARV (median comp)
- $187,737
- List price
- $154,950
- Delta
- -17.46%
- Verdict
- UNDERPRICED
- Comps
- 20 within 1.0 mi
Show comp detail 12 sales within ~0.75 mi
| Address | Dist | Beds/Ba | Sqft | Sold | Price | $/sf | Match |
|---|---|---|---|---|---|---|---|
| 3101 N Osage St | 0.14mi | 3/1.5 | 918 (+1%) | 8mo | $175,000 | $191 | 86 |
| 3404 N Mccoy St | 0.22mi | 3/1.5 | 929 (+2%) | 1mo | $185,000 | $199 | 86 |
| 3604 N Pleasant St | 0.32mi | 3/1.5 | 889 (-2%) | 0mo | $212,000 | $238 | 81 |
| 700 W 28th St | 0.21mi | 3/1.5 | 916 (+0%) | 11mo | $149,900 | $164 | 81 |
| 711 Colonel Dr | 0.14mi | 3/1.5 | 956 (+5%) | 10mo | $105,000 | $110 | 77 |
| 2903 N Union St | 0.17mi | 3/1.5 | 945 (+4%) | 12mo | $135,000 | $143 | 76 |
| 704 W 38th St N | 0.42mi | 3/1.0 | 912 (0%) | 10mo | $175,000 | $192 | 70 |
| 3303 N Mccoy St | 0.13mi | 3/2.0 | 1,014 (+11%) | 4mo | $215,000 | $212 | 70 |
| 3510 N Spring St | 0.27mi | 3/1.5 | 906 (-1%) | 21mo | $175,000 | $193 | 69 |
| 3501 N Delaware St | 0.27mi | 3/1.5 | 976 (+7%) | 11mo | $209,900 | $215 | 67 |
| 703 W 39th St N | 0.45mi | 3/1.5 | 912 (0%) | 15mo | $185,000 | $203 | 66 |
| 12900 E Silver Ln | 0.47mi | 2/1.0 (-1) | 992 (+9%) | 15mo | $184,500 | $186 | 44 |
Match score weights: distance 35% · size 25% · config 20% · recency 20%. Top-matched comps best support the ARV.
Projected returns pro-forma
-3.0% appreciation · 3.79% rent growth · sell at horizon
- IRR
- -11.5%
- Equity multiple
- 0.58×
- Total profit
- $-18,230
- Equity at exit
- $23,104
- IRR
- -1.3%
- Equity multiple
- 0.91×
- Total profit
- $-3,858
- Equity at exit
- $13,397
Cash invested: $43,386 (down + closing). Projections, not guarantees.
Landlord ↔ Tenant lean methodology
- Overall (STATE)
- 81 Strongly Landlord-Friendly
- State Missouri
- 81 Strongly Landlord-Friendly · R+10
- County
- — inherits STATE
- City
- — inherits STATE
ZIP-level market 64050
- Home prices YoY
- -15.5%
- Rents YoY
- 3.8%
- Active inventory
- 125
- Price-to-rent
- 9.3×
Monthly cashflow live
- Estimated rent
- $1,390 high interval (Pro) →
- Mortgage (P&I)
- −$813
- Tax from tax record
- −$130 /mo · $1,562/yr
- Insurance
- −$65
- HOA
- −$0
- Vacancy / Maint / Mgmt
- −$292
- Net cashflow
- $91
Break-even live
UW: 25.0% down · 7.5% · 30yr · 1.5% tax · 5.0% vac · 8.0% maint · 8.0% mgmt
Financing live
Cash to close
- Down payment
- $38,738
- Closing costs
- $4,648
- Reserves months
- —
- Total cash needed
- —
Loan-product check · same deal, 3 products live
Conventional
25% down · 7.5% · 30yr
- Down + closing
- —
- Monthly P&I
- —
- Monthly cashflow
- —
- DSCR
- —
- Eligible?
- —
Personal DTI + credit; lowest rate.
DSCR
20% down · 8.5% · 30yr
- Down + closing
- —
- Monthly P&I
- —
- Monthly cashflow
- —
- DSCR
- —
- Eligible?
- —
No personal income docs; deal must DSCR.
Hard money
10% down · 12.0% · 12mo
- Down + closing
- —
- Monthly P&I
- —
- Monthly cashflow
- —
- DSCR
- —
- Eligible?
- —
Short-term bridge; refi at stabilization.
Rent comps 9 comps
| Address | Beds | Baths | Sqft | Rent | $/sqft | DOM | Units | Dist |
|---|---|---|---|---|---|---|---|---|
| 3407 N Pleasant St Independence, MO | 3.0 | 1.5 | 905 | $1,400 | $1.55 | 3d | 1 | 0.20mi |
| 2522 N River Blvd Independence, MO | 3.0 | 1.0 | 910 | $1,495 | $1.64 | 4d | 1 | 0.44mi |
| 702 W 39th St N Independence, MO | 3.0 | 1.5 | 913 | $1,450 | $1.59 | 44d | 1 | 0.47mi |
| 2405 N River Blvd Independence, MO | 2.0 | 1.0 | 830 | $1,095 | $1.32 | 7d | 1 | 0.50mi |
| 1714 N Pearl St Independence, MO | 2.0 | 1.0 | 792 | $1,195 | $1.51 | 44d | 1 | 0.98mi |
| 1612 N Dodgion Ave Independence, MO | 3.0 | 1.0 | 1000 | $1,345 | $1.34 | 44d | 1 | 1.03mi |
| 1207 N McCoy St Independence, MO | 3.0 | 2.0 | 972 | $1,295 | $1.33 | 7d | 1 | 1.27mi |
| 1214 N Union St Independence, MO | 2.0 | 1.0 | 912 | $975 | $1.07 | 44d | 1 | 1.28mi |
| 1100 N Noland Rd Apt D Independence, MO | 2.0 | 1.0 | 800 | $1,025 | $1.28 | 7d | 1 | 1.46mi |
Listing history 27 events
-
2026-06-18days on market $154,950 Active 161 DOM
-
2026-06-17days on market $154,950 Active 160 DOM
-
2026-06-16days on market $154,950 Active 159 DOM
-
2026-06-15days on market $154,950 Active 158 DOM
-
2026-06-13days on market $154,950 Active 156 DOM
-
2026-06-09days on market $154,950 Active 152 DOM
-
2026-06-08days on market $154,950 Active 151 DOM
-
2026-06-07days on market $154,950 Active 150 DOM
-
2026-06-05pricedays on market $154,950 Active 147 DOM
-
2026-06-03days on market $165,950 Active 146 DOM
-
2026-06-02days on market $165,950 Active 145 DOM
-
2026-06-01days on market $165,950 Active 144 DOM
-
2026-05-31days on market $165,950 Active 143 DOM
-
2026-05-07status Active 320-char remark
Show marketing remark (320 chars)
Very livable true ranch-Clean and move in ready-numerous updates such as windows, roof, gutters, bath, sewer line, counter tops, paint, vinyl siding, deck, refinished hardwood floors throughout, garage door, etc-foundation work approved by Norton and Schmidt Engineering- nice Kentucky Hills neighborhood-Move In Ready!
-
2026-04-21historical 320-char remark
Show marketing remark (320 chars)
Very livable true ranch-Clean and move in ready-numerous updates such as windows, roof, gutters, bath, sewer line, counter tops, paint, vinyl siding, deck, refinished hardwood floors throughout, garage door, etc-foundation work approved by Norton and Schmidt Engineering- nice Kentucky Hills neighborhood-Move In Ready!
-
2026-04-14status Pending 320-char remark
Show marketing remark (320 chars)
Very livable true ranch-Clean and move in ready-numerous updates such as windows, roof, gutters, bath, sewer line, counter tops, paint, vinyl siding, deck, refinished hardwood floors throughout, garage door, etc-foundation work approved by Norton and Schmidt Engineering- nice Kentucky Hills neighborhood-Move In Ready!
-
2026-02-13price $173,950 320-char remark
Show marketing remark (320 chars)
Very livable true ranch-Clean and move in ready-numerous updates such as windows, roof, gutters, bath, sewer line, counter tops, paint, vinyl siding, deck, refinished hardwood floors throughout, garage door, etc-foundation work approved by Norton and Schmidt Engineering- nice Kentucky Hills neighborhood-Move In Ready!
-
2025-12-16$174,950 Active 320-char remark
Show marketing remark (320 chars)
Very livable true ranch-Clean and move in ready-numerous updates such as windows, roof, gutters, bath, sewer line, counter tops, paint, vinyl siding, deck, refinished hardwood floors throughout, garage door, etc-foundation work approved by Norton and Schmidt Engineering- nice Kentucky Hills neighborhood-Move In Ready!
-
2023-03-17status Pending
-
2023-03-17historical
-
2023-03-05$155,950 Active
-
2018-09-01historical
-
2018-07-24price $77,950
-
2018-06-20status Active
-
2018-06-01status Pending
-
2018-05-24$87,950 Active
-
1982-04-01soldstatus
ⓘ Source: listings_history table (triggers on properties + properties_extension) + one-shot
backfill from property_details.listing_events for pre-trigger history.
Tax reassessment forecast MO · Resets to sale price
- Current annual tax
- $1,562 · $130/mo
- Projected year-2 tax
- $1,562 · $130/mo
- Expected delta
- $0/yr ($0/mo · 0.0%)
ⓘ Screening estimate from a state-policy table — verify with the county assessor before closing.
Climate risk First Street
- Flood 1/10 Low FEMA zone X (unshaded) · 0% chance over 30 yrs
- Wildfire 1/10 Low
- Heat 4/10 Moderate 7 d/yr ≥106°F today · 16 d/yr by 30 yrs out
- Wind 2/10 Low
- Air quality 3/10 Moderate 3 unhealthy d/yr today · 3 by 30 yrs out
Nearby sold comps map
Loading sold comps map…
Walkable amenities ~0.75 mi
Loading nearby amenities…
Taxation est. · year 1
- Rental income
- $16,680
- − Mortgage interest
- −$8,680
- − Property taxes
- −$1,562
- − Insurance
- −$775
- − Repairs & maintenance
- −$1,334
- − Management
- −$1,334
- − Depreciation
- −$4,508
- Taxable loss
- −$1,513
- Est. tax savings @ 24.0%
- +$363
- After-tax cash flow
- $1,453/yr
For passive investors: Depreciation is non-cash, so a rental often shows a tax loss while cash-flowing — sheltering income. Rental losses are passive: they offset passive income freely, and up to $25,000/yr can offset ordinary (W-2) income if you actively participate and your MAGI is under $100k (phasing out to $0 by $150k); unused losses carry forward. On sale, claimed depreciation is recaptured at up to 25%, and gains may owe capital-gains tax (a 1031 exchange can defer both). Figures are a year-1 estimate at your 24.0% rate — not tax advice; consult a CPA.
Schools (NCES district)
- District
- Independence 30
- NCES district ID
- 2915480
- Math proficiency
- 26% ▼ -8.00%
- Reading proficiency
- 38% ▼ -5.00%
- Median HH income
- $41,843
- Composite
- 27.04/100
- National rank
- #7054
- State rank
- #252 of 324 in MO
Livability — Independence
- Score
- 82/100
- State rank
- #10
- US rank
- #1296
Category grades
Schools grade is shown separately in the Schools card above.
Census & demographics
- Census place
- Independence, MO
- County
- Jackson County · 687,798 people
- City population
- 117,675
- Metro
- Kansas City, MO-KS
- Population (ZIP)
- 21,079
- Household income
- $48,834
- Rent vs Own
- Severe rent burden
- 972.0
Population outlook (Jackson County) Hauer SSP2
- Today (2025)
- 719,589 people
- By 2030
- 731,456 · +1.6%
- By 2040
- 746,689 · +3.8%
- By 2050
- 749,289 · +4.1%
- By 2075
- 736,227 · +2.3%
- By 2100
- 668,210 · -7.1%
Race, ethnicity, and origin ACS 2023
- Neighborhood character
- Predominantly White (72%)
- Race & ethnicity
- White 72% Hispanic / Latino 11% Two or more races 9% Black 7% Pacific Islander 1%
- Hispanic origin (detail)
- Mexican 8%
- Common ancestry
- Italian 4% Serbian 2% Lithuanian 1%
- Foreign-born
- 5% · Canada
- Languages at home
- 91% English-only · Spanish 7% Other Asian/Pacific 1%
Political lean MEDSL · Jackson
- 2024 margin
- D (+19.3) · D 58.9% · R 39.5% · Other 1.6%
- 2008→2024 swing
- -6.1pp toward R · 2008: 25.4pp · 2024: 19.3pp
- All cycles
- 2024: D+19.3 2020: D+22.0 2016: D+16.6 2012: D+19.0 2008: D+25.4
Not yet ingested
- Civics
- —
Market trends
- HPI YoY
- ▼ -56.24%
- Current HPI
- 305.796
- Rent YoY
- ▲ 3.79%
- Metro
- Kansas City, MO-KS
- State GDP YoY
- ▲ 1.84%
- F500 in state
- 20
Industry mix (Fortune 500 HQ in MO)
| Industry | F500 HQs | Revenue |
|---|---|---|
| Healthcare | 1 | $163B |
|
||
| Insurance | 1 | $21B |
|
||
| Industrial Technology | 1 | $17B |
|
||
| Retail | 1 | $16B |
|
||
| Industrial Distribution | 1 | $10B |
|
||
| Utilities | 1 | $9B |
|
||
Price history
+97.8% since first listed14 events — show timeline
- 2026-05-07 Relisted — Heartland MLS as Distributed by MLS Grid
- 2026-04-21 Listing Removed — Heartland MLS as Distributed by MLS Grid
- 2026-04-14 Pending — Heartland MLS as Distributed by MLS Grid
- 2026-02-13 Price Changed $173,950 Heartland MLS as Distributed by MLS Grid
- 2025-12-16 Listed $174,950 Heartland MLS as Distributed by MLS Grid
- 2023-03-17 Pending — Heartland MLS as Distributed by MLS Grid
- 2023-03-17 Listing Removed — Heartland MLS as Distributed by MLS Grid
- 2023-03-05 Listed $155,950 Heartland MLS as Distributed by MLS Grid
- 2018-09-01 Listing Removed — Heartland MLS as Distributed by MLS Grid
- 2018-07-24 Price Changed $77,950 Heartland MLS as Distributed by MLS Grid
- 2018-06-20 Relisted — Heartland MLS as Distributed by MLS Grid
- 2018-06-01 Pending — Heartland MLS as Distributed by MLS Grid
- 2018-05-24 Listed $87,950 Heartland MLS as Distributed by MLS Grid
- 1982-04-01 Sold (Public Records) — Public Records
Property tax history
+4.1%/yrLatest (2025): $1,562 · +1.3% YoY. Source: county tax records.
Cash-flow waterfall
monthlySold comps — $/sqft
last 12 mo · ≤1 miLoading sold comps…