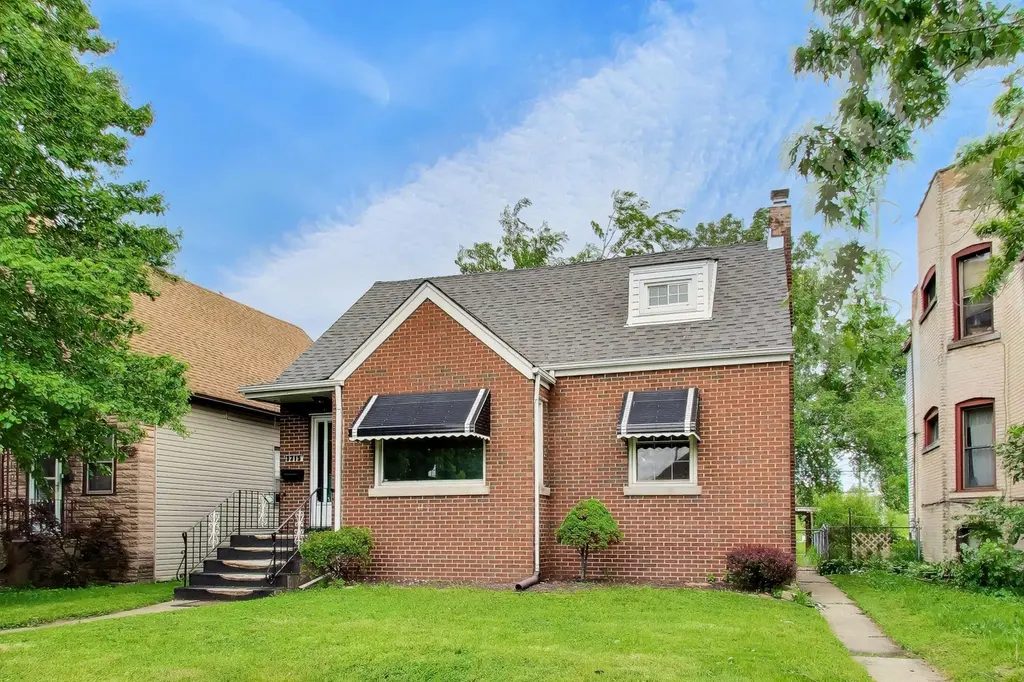
1315 Hoffman St · Hammond, IN
Flood risk 1/10 · Minimal
- FEMA flood zone
- X (unshaded)
- Chance of flooding over 30 yrs
- 0.0%
- Est. flood insurance / yr
- $473 – $860
Fire risk 1/10 · Minimal
- Est. fire insurance / yr
- $717 – $1,331
Heat risk 3/10 · Minor
- Hot days now (above 101°F)
- 7 days/yr
- Hot days in 30 yrs
- 15 days/yr
Wind risk 2/10 · Minimal
- Chance of severe wind over 30 yrs
- 1.0%
Air-quality risk 4/10 · Minor
- Unhealthy air days now
- 5 days/yr
- Unhealthy air days in 30 yrs
- 6 days/yr
Risk factors via First Street. Map © Google.
Why this score? — see what drove the A- grade
The composite is a weighted blend of 9 inputs, each scored 0–100. Each bar is that input's sub-score; the figure is the points it added to the 100-point composite (weight × sub-score).
- Cash flow +30.0/30.0
- ARV discount +15.0/15.0
- 1% rule +10.0/10.0
- DSCR +10.0/10.0
- Appreciation +9.5/10.0
- Livability +3.5/5.0
- Rent growth +2.5/5.0
- Condition / age +2.5/5.0
- Schools +1.1/10.0
$134,900
🖨 Deal sheet 📄 Offer letter ✓ Due diligence
Listing remarks MLS
All brick cape cod with 3 possible 4 bedrooms. 2 bedrooms in the main level and upper level has a large master bedroom with an additional room for a den/office/walk in closet. All bedrooms have hardwood flooring along with the living room and dining room (under carpet) The basement is very bright with glass block windows and extra storage space. Updated electric and newer windows.
Key facts
- Functional kitchen
- Allbrick cape cod
- Solid garage
Tags
Property features AI
Finance
- Other: Occupant status: vacant
Exterior
- Parking: Detached oversized garage with alley access; Garage faces rear; Off-street parking
- Utilities: Public water; Public sewer
- Home design: One-and-a-half story home; Built in 1946; Property described as fixer condition
- Construction: Has garage(s) (approx. 2.5 garage spaces); Full basement (unfinished)
- Exterior features: Neighborhood view
Interior
- Kitchen: No appliances listed
- Bedrooms: Primary bedroom; Two additional bedrooms (total 3 bedrooms)
- Bathrooms: 1 full bathroom
- Heating & cooling: Forced air heating (natural gas); Ceiling fans for cooling
- Interior features: No notable built-in interior features reported; 7 total rooms including living room, dining room and loft; Full unfinished basement with interior entry and sump pump
- Laundry & utility: No laundry appliances listed
Neighborhood map
What this means for you Summary
Snapshot
- This is a 3-bed/1.0-bath single-family listed at $135k.
Deal economics
- At list price, monthly cash flow is $803 ($10k/yr) — positive.
- The deal already cash-flows at list — no discount required.
- Meets the 1% rule at list price ($2k rent vs $135k).
- Recommended offer: $133k (1.5% below list) — sets the bar for market timing.
- Cap rate 13.4% vs local median 5.8% in Hammond — top-decile yield for the area; either an underpriced asset or a hidden risk that comps aren't pricing in. Stress-test before assuming the spread holds.
Location & tenants
- Location reads 70/100 on livability (#143 in IN) — a middle-class / working-renter tenant base. Strengths: cost of living A+, housing A+, commute A; Watch: health & safety D+, employment D, schools F.
- School City Of Hammond (suburban): math 8% / reading 18% proficiency, ranked #289 of 301 in IN (top 96%) — low school quality limits family demand, transient renter base, plan for 1-2y turnover; 74% free/reduced lunch — lower-income household profile, screen leases tightly.
- Market conditions: 28 active listings in the ZIP; 4 comparable units currently listed for rent nearby; rentals leasing fast (median 4d on market — plan ~1-2 weeks tenant-placement turnaround); 1,642 units permitted in Lake County in 2024 (14 in 5+ unit buildings).
Forward outlook
- In year one you build about $13k of equity ($933 loan paydown + $12k appreciation (9.1% local appreciation)).
- Lake County population projected to shrink 7% by 2050 — rents likely to lag national; underwrite the cash flow, not the appreciation.
- At projected returns (9.1% appreciation + 3.0% rent growth), your $38k cash investment doubles in ~2 years — after that, you're playing with house money.
- By year 3, paydown + projected appreciation supports a ~$33k cash-out refi (75% LTV) — recoverable capital for the next deal without selling this one.
Negotiation context
- It's been on market 20 days — a 2% lower offer ($133k) is reasonable based on typical stale-listing flexibility.
- 2 sale attempts since 7y ago with the ask held roughly flat each time — persistent listings suggest the price (not the market) is what's stuck; bring a comps-based counter.
- Current owner paid $77k; list at $135k implies a 75% gain — meaningful room to come down on a strong offer.
Risks & watch-outs
- Watch-outs: built in 1946 — expect roof / HVAC / electrical / plumbing capex.
Questions for the listing agent
- Built in 1946 — when were the roof, HVAC, electrical panel, plumbing, and water heater last replaced?
- Is there a deadline driving the sale (1031 exchange, divorce, estate, relocation)? That informs how much negotiation room exists.
- Schools are F-rated, which usually means shorter tenancies and higher turnover. Who's the typical renter profile here, and what's been the actual vacancy rate?
- Crime grade is F in this area — have there been break-ins, vandalism, or insurance claims at this property in the last 3 years? What carrier currently insures it and at what premium?
- What's the average days-on-market for RENTAL listings here right now (not sales)? A rising rental-DOM trend means longer vacancies and softer asking-rent achievability than the comps imply.
- What's the recent tenant-quality profile in this submarket — average credit score on applications, eviction rate, late-payment / NSF rate, and stable-employment percentage? A property-management company in the area should have these aggregated.
- How much new for-sale + rental construction is in the pipeline within 1–3 miles? Heavy new supply typically softens prices + rents 12–24 months out; constrained supply supports both.
Investment metrics
- 1% rule
- 1.58% ✓
- Cap rate
- 13.43%
- Cash-on-cash
- 25.50%
- DSCR
- 2.13
- GRM
- 5.3
CMA / ARV
- ARV (on-the-fly)
- $188,928
- Comps found
- 12
Show comp detail 12 sales within ~0.75 mi
| Address | Dist | Beds/Ba | Sqft | Sold | Price | $/sf | Match |
|---|---|---|---|---|---|---|---|
| 1130 Chicago St | 0.24mi | 3/2.0 | 1,530 (+4%) | 9mo | $135,000 | $88 | 71 |
| 4354 Ash Ave | 0.61mi | 3/2.0 | 1,467 (-1%) | 7mo | $279,990 | $191 | 60 |
| 4716 Elm Ave | 0.26mi | 3/2.0 | 1,641 (+11%) | 8mo | $210,000 | $128 | 59 |
| 4938 Walnut Ave | 0.30mi | 2/1.0 (-1) | 1,557 (+6%) | 19mo | $135,000 | $87 | 56 |
| 4925 Pine Ave | 0.51mi | 3/1.0 | 1,580 (+7%) | 14mo | $147,000 | $93 | 53 |
| 4856 Wegg Ave | 0.48mi | 3/2.0 | 1,650 (+12%) | 3mo | $165,000 | $100 | 51 |
| 4911 Pine Ave | 0.50mi | 4/2.0 (+1) | 1,332 (-10%) | 2mo | $212,900 | $160 | 50 |
| 4747 Cedar Ave | 0.53mi | 4/1.0 (+1) | 1,640 (+11%) | 3mo | $68,000 | $41 | 49 |
| 4945 Northcote Ave Apt 2F | 0.69mi | 3/2.0 | 1,582 (+7%) | 13mo | $176,000 | $111 | 41 |
| 1152 E Roosevelt St | 0.69mi | 3/2.0 | 1,660 (+12%) | 4mo | $239,900 | $145 | 39 |
| 4910 Pine Ave | 0.52mi | 3/2.0 | 1,300 (-12%) | 15mo | $254,500 | $196 | 39 |
| 4805 Baring Ave | 0.71mi | 3/1.5 | 1,657 (+12%) | 10mo | $250,000 | $151 | 36 |
Match score weights: distance 35% · size 25% · config 20% · recency 20%. Top-matched comps best support the ARV.
Projected returns pro-forma
9.08% appreciation · 3.0% rent growth · sell at horizon
- IRR
- 42.0%
- Equity multiple
- 4.08×
- Total profit
- $116,190
- Equity at exit
- $112,591
- IRR
- 36.8%
- Equity multiple
- 8.95×
- Total profit
- $300,192
- Equity at exit
- $233,885
Cash invested: $37,772 (down + closing). Projections, not guarantees.
Landlord ↔ Tenant lean methodology
- Overall (STATE)
- 90 Strongly Landlord-Friendly
- State Indiana
- 90 Strongly Landlord-Friendly · R+11
- County
- — inherits STATE
- City
- — inherits STATE
ZIP-level market 46327
- Home prices YoY
- 2.7%
- Active inventory
- 28
- Price-to-rent
- 5.3×
Monthly cashflow live
- Estimated rent
- $2,127 medium interval (Pro) →
- Mortgage (P&I)
- −$707
- Tax from tax record
- −$114 /mo · $1,370/yr
- Insurance
- −$56
- HOA
- −$0
- Vacancy / Maint / Mgmt
- −$447
- Net cashflow
- $803
Break-even live
UW: 25.0% down · 7.5% · 30yr · 1.5% tax · 5.0% vac · 8.0% maint · 8.0% mgmt
Financing live
Cash to close
- Down payment
- $33,725
- Closing costs
- $4,047
- Reserves months
- —
- Total cash needed
- —
Loan-product check · same deal, 3 products live
Conventional
25% down · 7.5% · 30yr
- Down + closing
- —
- Monthly P&I
- —
- Monthly cashflow
- —
- DSCR
- —
- Eligible?
- —
Personal DTI + credit; lowest rate.
DSCR
20% down · 8.5% · 30yr
- Down + closing
- —
- Monthly P&I
- —
- Monthly cashflow
- —
- DSCR
- —
- Eligible?
- —
No personal income docs; deal must DSCR.
Hard money
10% down · 12.0% · 12mo
- Down + closing
- —
- Monthly P&I
- —
- Monthly cashflow
- —
- DSCR
- —
- Eligible?
- —
Short-term bridge; refi at stabilization.
Rent comps 4 comps
| Address | Beds | Baths | Sqft | Rent | $/sqft | DOM | Units | Dist |
|---|---|---|---|---|---|---|---|---|
| 1344 Michigan St Hammond, IN | 3.0 | 1.0 | 1006 | $1,595 | $1.59 | 15d | 1 | 0.89mi |
| 4624 Towle Ave Hammond, IN | 4.0 | 2.0 | 1500 | $2,500 | $1.67 | 2d | 1 | 1.01mi |
| 4624 Towle Ave Hammond, IN | 4.0 | 2.0 | 1500 | $2,500 | $1.67 | 1d | 1 | 1.01mi |
| 1454 Sherman St Hammond, IN | 3.0 | 1.0 | 960 | $1,400 | $1.46 | 3d | 1 | 1.49mi |
Listing history 12 events
-
2026-06-13statusdays on market $134,900 Pending 20 DOM
-
2026-06-09days on market $134,900 Active Under Contract 18 DOM
-
2026-06-08days on market $134,900 Active Under Contract 17 DOM
-
2026-06-07days on market $134,900 Active Under Contract 16 DOM
-
2026-06-04days on market $134,900 Active Under Contract 13 DOM
-
2026-06-03days on market $134,900 Active Under Contract 12 DOM
-
2026-06-02days on market $134,900 Active Under Contract 11 DOM
-
2026-06-01days on market $134,900 Active Under Contract 10 DOM
-
2026-05-31days on market $134,900 Active Under Contract 9 DOM
-
2026-05-22$134,900 Active
-
2019-07-12soldstatus $77,000 383-char remark
Show marketing remark (383 chars)
All brick cape cod with 3 possible 4 bedrooms. 2 bedrooms in the main level and upper level has a large master bedroom with an additional room for a den/office/walk in closet. All bedrooms have hardwood flooring along with the living room and dining room (under carpet) The basement is very bright with glass block windows and extra storage space. Updated electric and newer windows.
-
2019-05-31$79,900 383-char remark
Show marketing remark (383 chars)
All brick cape cod with 3 possible 4 bedrooms. 2 bedrooms in the main level and upper level has a large master bedroom with an additional room for a den/office/walk in closet. All bedrooms have hardwood flooring along with the living room and dining room (under carpet) The basement is very bright with glass block windows and extra storage space. Updated electric and newer windows.
ⓘ Source: listings_history table (triggers on properties + properties_extension) + one-shot
backfill from property_details.listing_events for pre-trigger history.
Tax reassessment forecast IN · Partial reset (capped growth)
- Current annual tax
- $1,370 · $114/mo
- Projected year-2 tax
- $1,370 · $114/mo
- Expected delta
- $0/yr ($0/mo · 0.0%)
ⓘ Screening estimate from a state-policy table — verify with the county assessor before closing.
Climate risk First Street
- Flood 1/10 Low FEMA zone X (unshaded) · 0% chance over 30 yrs
- Wildfire 1/10 Low
- Heat 3/10 Moderate 7 d/yr ≥101°F today · 15 d/yr by 30 yrs out
- Wind 2/10 Low 100% chance of damaging wind over 30 yrs
- Air quality 4/10 Moderate 5 unhealthy d/yr today · 6 by 30 yrs out
Nearby sold comps map
Loading sold comps map…
Walkable amenities ~0.75 mi
Loading nearby amenities…
Taxation est. · year 1
- Rental income
- $25,527
- − Mortgage interest
- −$7,556
- − Property taxes
- −$1,370
- − Insurance
- −$674
- − Repairs & maintenance
- −$2,042
- − Management
- −$2,042
- − Depreciation
- −$3,924
- Taxable income
- $7,917
- Est. tax owed @ 24.0%
- −$1,900
- After-tax cash flow
- $7,732/yr
For passive investors: Depreciation is non-cash, so a rental often shows a tax loss while cash-flowing — sheltering income. Rental losses are passive: they offset passive income freely, and up to $25,000/yr can offset ordinary (W-2) income if you actively participate and your MAGI is under $100k (phasing out to $0 by $150k); unused losses carry forward. On sale, claimed depreciation is recaptured at up to 25%, and gains may owe capital-gains tax (a 1031 exchange can defer both). Figures are a year-1 estimate at your 24.0% rate — not tax advice; consult a CPA.
Schools (NCES district)
- District
- School City Of Hammond
- NCES district ID
- 1804320
- Math proficiency
- 8% ▼ -18.00%
- Reading proficiency
- 18% ▼ -15.00%
- Median HH income
- $39,970
- Composite
- 11.11/100
- National rank
- #9730
- State rank
- #289 of 301 in IN
Livability — Hammond
- Score
- 70/100
- State rank
- #143
- US rank
- #7343
Category grades
Schools grade is shown separately in the Schools card above.
Census & demographics
- Census place
- Hammond, IN
- City population
- 58,809
- Population (ZIP)
- 10,797
Population outlook (Lake County) Hauer SSP2
- Today (2025)
- 484,026 people
- By 2030
- 478,091 · -1.2%
- By 2040
- 462,974 · -4.3%
- By 2050
- 449,894 · -7.1%
- By 2075
- 436,169 · -9.9%
- By 2100
- 426,607 · -11.9%
Race, ethnicity, and origin ACS 2023
- Neighborhood character
- Diverse neighborhood (Simpson 0.57)
- Race & ethnicity
- Hispanic / Latino 58% White 28% Black 13% Two or more races 9%
- Hispanic origin (detail)
- Mexican 54% Puerto Rican 3%
- Common ancestry
- Romanian 7% Iranian 2% Lithuanian 1%
- Foreign-born
- 21% · Canada
- Languages at home
- 60% English-only · Spanish 38% Russian/Polish/Slavic 1% Arabic 1%
Political lean MEDSL · Lake
- 2024 margin
- Lean D (+5.6) · D 52.1% · R 46.5% · Other 1.5%
- 2008→2024 swing
- -28.6pp toward R · 2008: 34.3pp · 2024: 5.6pp
- All cycles
- 2024: D+5.6 2020: D+15.1 2016: D+20.6 2012: D+31.0 2008: D+34.3
Not yet ingested
- Civics
- —
Market trends
- HPI YoY
- ▲ 9.08%
- Current HPI
- 343.2924
- Rent YoY
- —
- Metro
- —
- State GDP YoY
- ▲ 2.90%
- F500 in state
- 18
Industry mix (Fortune 500 HQ in IN)
| Industry | F500 HQs | Revenue |
|---|---|---|
| Industrial Machinery | 2 | $37B |
|
||
| Healthcare | 1 | $177B |
|
||
| Pharmaceuticals | 1 | $45B |
|
||
| Metals / Steel | 1 | $18B |
|
||
| Agriculture | 1 | $17B |
|
||
| Packaging | 1 | $12B |
|
||
Price history
+68.8% since first listed3 events — show timeline
- 2026-05-22 Listed $134,900 NIRA MLS as Distributed by MLS Grid
- 2019-07-12 Sold (MLS) $77,000 NIRA MLS as Distributed by MLS Grid
- 2019-05-31 Listed $79,900 NIRA MLS as Distributed by MLS Grid
Property tax history
+47.9%/yrLatest (2024): $1,370 · +16.6% YoY. Source: county tax records.
Cash-flow waterfall
monthlySold comps — $/sqft
last 12 mo · ≤1 miLoading sold comps…