4049 Van Bibber Lake Est · Van Bibber Lake, IN
Flood risk 1/10 · Minimal
- FEMA flood zone
- X (unshaded)
- Chance of flooding over 30 yrs
- 0.0%
- Est. flood insurance / yr
- $507 – $1,088
Fire risk 1/10 · Minimal
- Est. fire insurance / yr
- $717 – $1,331
Heat risk 3/10 · Minor
- Hot days now (above 104°F)
- 7 days/yr
- Hot days in 30 yrs
- 18 days/yr
Wind risk 2/10 · Minimal
- Chance of severe wind over 30 yrs
- 1.0%
Air-quality risk 2/10 · Minimal
- Unhealthy air days now
- 1 days/yr
- Unhealthy air days in 30 yrs
- 2 days/yr
Risk factors via First Street. Map © Google.
Why this score? — see what drove the C+ grade
The composite is a weighted blend of 9 inputs, each scored 0–100. Each bar is that input's sub-score; the figure is the points it added to the 100-point composite (weight × sub-score).
- Cash flow +30.0/30.0
- 1% rule +10.0/10.0
- DSCR +10.0/10.0
- Schools +4.1/10.0
- ARV discount +3.9/15.0
- Rent growth +2.5/5.0
- Condition / age +2.2/5.0
- Livability +2.1/5.0
- Appreciation +0.0/10.0
$35,000
🖨 Deal sheet 📄 Offer letter ✓ Due diligence
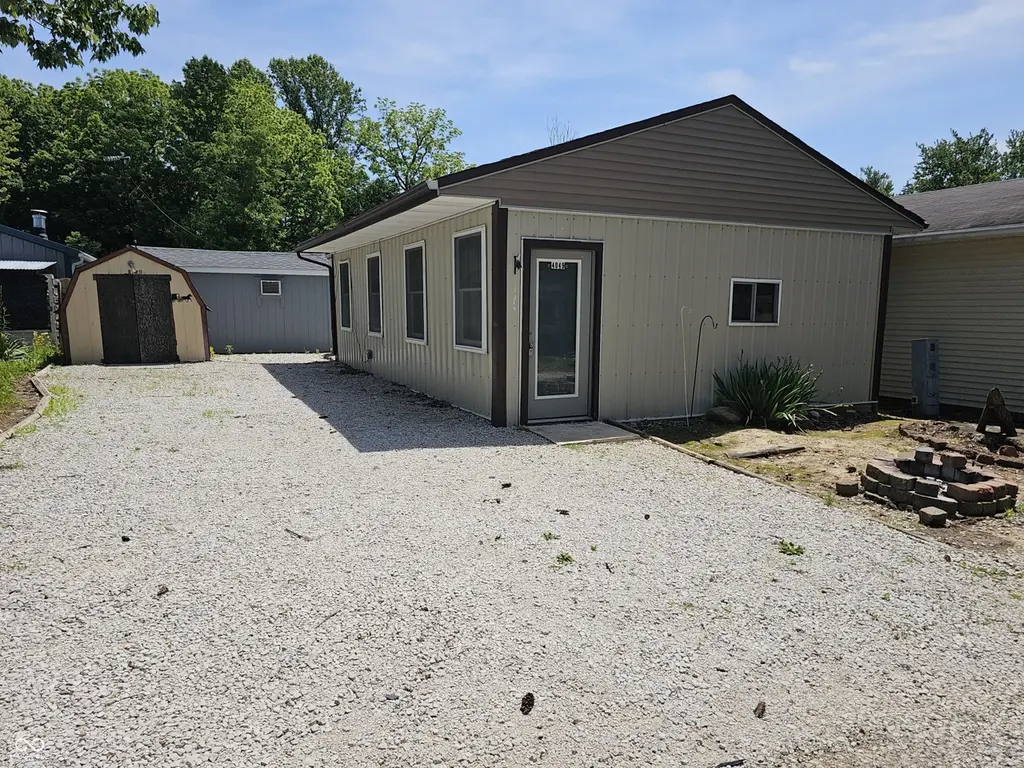
Listing remarks
Welcome to lake living at Van Bibber Lake! This 1-bedroom, 1-bath home (Camper) offers an affordable opportunity for a weekend retreat, seasonal getaway, or year-round residence. The property features a tankless water heater, mini-split heating and cooling system, and washer/dryer hookups for added convenience. The efficient layout maximizes space while keeping maintenance to a minimum. Enjoy all that the Van Bibber Lake community has to offer, including boating, fishing, and relaxing lake life. Whether you're looking for a personal retreat or a low-maintenance home, this property is ready for you to make it your own. Comes with new oven/stove, microwave and refrigerator.
Key facts
- New oven stove
- Microwave
- Washer dryer hookups
Tags
Property features AI
Finance
- Other: Located in Van Bibber Lake (Lot 49, Sec. 4); GPS-friendly directions
- HOA & community: Homeowners association with an annual fee of $300; Mandatory fee ownership
Exterior
- Utilities: Community sewer; Private water
- Home design: Manufactured home; One level
- Construction: Built with other/unspecified construction materials; Other foundation type
- Exterior features: Lot under 1/4 acre (0.05 acre)
Interior
- Kitchen: Gas cooktop; Refrigerator
- Bedrooms: One bedroom on the main level
- Bathrooms: One full bathroom on the main level
- Heating & cooling: Zoned heating; Dual cooling (ductless)
- Interior features: Living room; Tankless water heater
Neighborhood map
What this means for you Summary
Snapshot
- This is a 1-bed/1.0-bath manufactured listed at $35k. Condition is rated fair.
Deal economics
- At list price, monthly cash flow is $534 ($6k/yr) — positive.
- The deal already cash-flows at list — no discount required.
- Meets the 1% rule at list price ($1k rent vs $35k).
Location & tenants
- Location reads 43/100 on livability (#670 in IN) — a working-class tenant base; expect higher turnover. Strengths: cost of living A+, crime A; Watch: employment D, amenities F, commute F.
- North Putnam Community Schools (rural): math 47% / reading 48% proficiency, ranked #73 of 301 in IN (top 24%) — families likely to look elsewhere, expect single-tenant / working-renter base with shorter leases.
- Zoned schools: Bainbridge Elementary School (math 62% / reading 47%, grade C, #197 of 994 statewide, top 22%, 419 students, 52% FRL); North Putnam Sr High School (math 52% / reading 67%, grade C+, #49 of 369 statewide, top 16%, 437 students, 43% FRL).
- Market conditions: 97 active listings in the ZIP; 166 units permitted in Putnam County in 2024 (0 in 5+ unit buildings).
Forward outlook
- Local home prices are declining (-3.0%/yr); year-one equity from $242 of loan paydown is wiped out by about $1k of value loss. Plan a longer hold.
- Putnam County population projected to shrink 8% by 2050 — rents likely to lag national; underwrite the cash flow, not the appreciation.
- At projected returns (-3.0% appreciation + 3.0% rent growth), your $10k cash investment doubles in ~2 years — after that, you're playing with house money.
Negotiation context
- Only 13 days on market — expect competitive offers; lowballing is unlikely to land.
Questions for the listing agent
- Have any recent inspections been done? Can we get a copy of the seller's disclosures and any deferred-maintenance estimates?
- What does the HOA fee cover, when was the last increase, and are there any pending special assessments or reserve-fund shortfalls?
- Is there a deadline driving the sale (1031 exchange, divorce, estate, relocation)? That informs how much negotiation room exists.
- Schools are F-rated, which usually means shorter tenancies and higher turnover. Who's the typical renter profile here, and what's been the actual vacancy rate?
- What's the average days-on-market for RENTAL listings here right now (not sales)? A rising rental-DOM trend means longer vacancies and softer asking-rent achievability than the comps imply.
- What's the recent tenant-quality profile in this submarket — average credit score on applications, eviction rate, late-payment / NSF rate, and stable-employment percentage? A property-management company in the area should have these aggregated.
- How much new for-sale + rental construction is in the pipeline within 1–3 miles? Heavy new supply typically softens prices + rents 12–24 months out; constrained supply supports both.
Investment metrics
- 1% rule
- 2.90% ✓
- Cap rate
- 24.62%
- Cash-on-cash
- 65.44%
- DSCR
- 3.91
- GRM
- 2.9
CMA / ARV
- ARV (on-the-fly)
- $32,400
- Comps found
- 3
Show comp detail 3 sales within ~0.75 mi
| Address | Dist | Beds/Ba | Sqft | Sold | Price | $/sf | Match |
|---|---|---|---|---|---|---|---|
| 5013 Van Bibber Lk | 0.15mi | 1/1.0 | 576 (-4%) | 22mo | $31,000 | $54 | 69 |
| 1006 Van Bibber Lk | 0.30mi | 2/1.0 (+1) | 612 (+2%) | 21mo | $20,000 | $33 | 60 |
| 5194 Van Bibber Lk | 0.27mi | 2/1.0 (+1) | 684 (+14%) | 9mo | $185,000 | $270 | 51 |
Match score weights: distance 35% · size 25% · config 20% · recency 20%. Top-matched comps best support the ARV.
Projected returns pro-forma
-3.0% appreciation · 3.0% rent growth · sell at horizon
- IRR
- 64.7%
- Equity multiple
- 3.90×
- Total profit
- $28,395
- Equity at exit
- $5,219
- IRR
- 69.0%
- Equity multiple
- 8.01×
- Total profit
- $68,677
- Equity at exit
- $3,026
Cash invested: $9,800 (down + closing). Projections, not guarantees.
Landlord ↔ Tenant lean methodology
- Overall (STATE)
- 90 Strongly Landlord-Friendly
- State Indiana
- 90 Strongly Landlord-Friendly · R+11
- County
- — inherits STATE
- City
- — inherits STATE
ZIP-level market 46135
- Home prices YoY
- -20.8%
- Active inventory
- 97
- Price-to-rent
- 2.9×
Monthly cashflow live
- Estimated rent
- $1,014 medium interval (Pro) →
- Mortgage (P&I)
- −$184
- Tax est. 1.5%
- −$44 /mo · $525/yr
- Insurance
- −$15
- HOA
- −$25
- Vacancy / Maint / Mgmt
- −$213
- Net cashflow
- $534
Break-even live
UW: 25.0% down · 7.5% · 30yr · 1.5% tax · 5.0% vac · 8.0% maint · 8.0% mgmt
Financing live
Cash to close
- Down payment
- $8,750
- Closing costs
- $1,050
- Reserves months
- —
- Total cash needed
- —
Loan-product check · same deal, 3 products live
Conventional
25% down · 7.5% · 30yr
- Down + closing
- —
- Monthly P&I
- —
- Monthly cashflow
- —
- DSCR
- —
- Eligible?
- —
Personal DTI + credit; lowest rate.
DSCR
20% down · 8.5% · 30yr
- Down + closing
- —
- Monthly P&I
- —
- Monthly cashflow
- —
- DSCR
- —
- Eligible?
- —
No personal income docs; deal must DSCR.
Hard money
10% down · 12.0% · 12mo
- Down + closing
- —
- Monthly P&I
- —
- Monthly cashflow
- —
- DSCR
- —
- Eligible?
- —
Short-term bridge; refi at stabilization.
HOA detail
- Monthly dues
- $25 · $300/yr
- Likely covers
- water
Listing history 10 events
-
2026-06-18days on market $35,000 Active 13 DOM
-
2026-06-17days on market $35,000 Active 12 DOM
-
2026-06-16days on market $35,000 Active 11 DOM
-
2026-06-15days on market $35,000 Active 10 DOM
-
2026-06-13days on market $35,000 Active 8 DOM
-
2026-06-12days on market $35,000 Active 7 DOM
-
2026-06-09days on market $35,000 Active 4 DOM
-
2026-06-08days on market $35,000 Active 3 DOM
-
2026-06-07remarks 680-char remark
-
2026-06-07$35,000 Active 2 DOM
ⓘ Source: listings_history table (triggers on properties + properties_extension) + one-shot
backfill from property_details.listing_events for pre-trigger history.
Climate risk First Street
- Flood 1/10 Low FEMA zone X (unshaded) · 0% chance over 30 yrs
- Wildfire 1/10 Low
- Heat 3/10 Moderate 7 d/yr ≥104°F today · 18 d/yr by 30 yrs out
- Wind 2/10 Low 100% chance of damaging wind over 30 yrs
- Air quality 2/10 Low 1 unhealthy d/yr today · 2 by 30 yrs out
Nearby sold comps map
Loading sold comps map…
Walkable amenities ~0.75 mi
Loading nearby amenities…
Taxation est. · year 1
- Rental income
- $12,171
- − Mortgage interest
- −$1,961
- − Property taxes
- −$525
- − Insurance
- −$175
- − Repairs & maintenance
- −$974
- − Management
- −$974
- − HOA
- −$300
- − Depreciation
- −$1,018
- Taxable income
- $6,245
- Est. tax owed @ 24.0%
- −$1,499
- After-tax cash flow
- $4,914/yr
For passive investors: Depreciation is non-cash, so a rental often shows a tax loss while cash-flowing — sheltering income. Rental losses are passive: they offset passive income freely, and up to $25,000/yr can offset ordinary (W-2) income if you actively participate and your MAGI is under $100k (phasing out to $0 by $150k); unused losses carry forward. On sale, claimed depreciation is recaptured at up to 25%, and gains may owe capital-gains tax (a 1031 exchange can defer both). Figures are a year-1 estimate at your 24.0% rate — not tax advice; consult a CPA.
Condition & rehab AI · 13 photos
This manufactured home presents as a cosmetic rehab, with minor repairs and maintenance needed to improve its condition and value.
Repairs flagged
- Minor Kitchen cabinets — Slight wear visible on the cabinets.
- Minor Bathroom fixtures — Some signs of wear on the fixtures.
- Minor Exterior siding — Some visible signs of wear on the siding.
- Minor Carpeted floors — Clean but may need a fresh coat of paint.
- Minor Paint on interior walls — Some minor scuffs visible on the walls.
- Minor HVAC system — No recent maintenance visible, but system appears functional.
- Minor Landscaping — Minimal landscaping with some overgrown areas and a gravel driveway.
Value-add opportunities
- Both Paint interior walls — Fresh paint can improve the overall appearance and value of the home.
- Both Replace worn kitchen cabinets — New cabinets can significantly enhance the kitchen's functionality and aesthetic appeal.
- Both Replace worn bathroom fixtures — New fixtures can improve the bathroom's functionality and aesthetic appeal.
- Both Improve landscaping — A well-maintained landscape can enhance curb appeal and property value.
- Both Replace HVAC system — A new HVAC system can improve comfort and energy efficiency, enhancing both resale and rental value.
Renovation cost estimate screening
| Repair item | Severity | Est. cost |
|---|---|---|
| Kitchen cabinets · Slight wear visible on the cabinets. | Minor | $500–3,000 |
| Bathroom fixtures · Some signs of wear on the fixtures. | Minor | $500–3,000 |
| Exterior siding · Some visible signs of wear on the siding. | Minor | $500–3,000 |
| Carpeted floors · Clean but may need a fresh coat of paint. | Minor | $500–3,000 |
| Paint on interior walls · Some minor scuffs visible on the walls. | Minor | $500–3,000 |
| HVAC system · No recent maintenance visible, but system appears functional. | Minor | $500–3,000 |
| Landscaping · Minimal landscaping with some overgrown areas and a gravel driveway. | Minor | $500–3,000 |
| Total estimated repair cost · 7 items | $3,500–21,000 |
Value-add ROI direction
- Both Paint interior walls — Fresh paint can improve the overall appearance and value of the home. ↑
- Both Replace worn kitchen cabinets — New cabinets can significantly enhance the kitchen's functionality and aesthetic appeal. ↑
- Both Replace worn bathroom fixtures — New fixtures can improve the bathroom's functionality and aesthetic appeal. ↑
- Both Improve landscaping — A well-maintained landscape can enhance curb appeal and property value. ↑
- Both Replace HVAC system — A new HVAC system can improve comfort and energy efficiency, enhancing both resale and rental value. ↑
ⓘ Cost ranges are severity-bucket heuristics (US national rule-of-thumb). Get contractor quotes + a written scope before underwriting a rehab budget.
Schools (NCES district)
- District
- North Putnam Community Schools
- NCES district ID
- 1807980
- Math proficiency
- 47% ▼ -12.00%
- Reading proficiency
- 48% ▼ -8.00%
- Median HH income
- $54,825
- Composite
- 41.18/100
- National rank
- #3549
- State rank
- #73 of 301 in IN
Livability — Van Bibber Lake
- Score
- 43/100
- State rank
- #670
- US rank
- #26940
Category grades
Schools grade is shown separately in the Schools card above.
Census & demographics
- Census place
- Van Bibber Lake, IN
- Population (ZIP)
- 19,639
Population outlook (Putnam County) Hauer SSP2
- Today (2025)
- 37,226 people
- By 2030
- 36,723 · -1.4%
- By 2040
- 35,407 · -4.9%
- By 2050
- 34,177 · -8.2%
- By 2075
- 32,038 · -13.9%
- By 2100
- 28,380 · -23.8%
Race, ethnicity, and origin ACS 2023
- Neighborhood character
- Predominantly White (86%)
- Race & ethnicity
- White 86% Black 6% Two or more races 4% Hispanic / Latino 3% Asian 2%
- Common ancestry
- Italian 2% Slovak 2% Lithuanian 1%
- Foreign-born
- 4% · China, Canada
- Languages at home
- 96% English-only · Spanish 1% French/Haitian/Cajun 1% Other Indo-European 1%
Political lean MEDSL · Putnam
- 2024 margin
- Solid R (+52.0) · D 23.1% · R 75.1% · Other 1.8%
- 2008→2024 swing
- -40.0pp toward R · 2008: -12.0pp · 2024: -52.0pp
- All cycles
- 2024: R+52.0 2020: R+50.2 2016: R+49.6 2012: R+32.6 2008: R+12.0
Not yet ingested
- Civics
- —
Market trends
- HPI YoY
- ▼ -58.66%
- Current HPI
- 222.8815
- Rent YoY
- —
- Metro
- —
- State GDP YoY
- ▲ 2.90%
- F500 in state
- 18
Industry mix (Fortune 500 HQ in IN)
| Industry | F500 HQs | Revenue |
|---|---|---|
| Industrial Machinery | 2 | $37B |
|
||
| Healthcare | 1 | $177B |
|
||
| Pharmaceuticals | 1 | $45B |
|
||
| Metals / Steel | 1 | $18B |
|
||
| Agriculture | 1 | $17B |
|
||
| Packaging | 1 | $12B |
|
||
Price history
1 event — show timeline
- 2026-06-05 Listed $35,000 MIBOR as Distributed by MLS Grid
Cash-flow waterfall
monthlySold comps — $/sqft
last 12 mo · ≤1 miLoading sold comps…