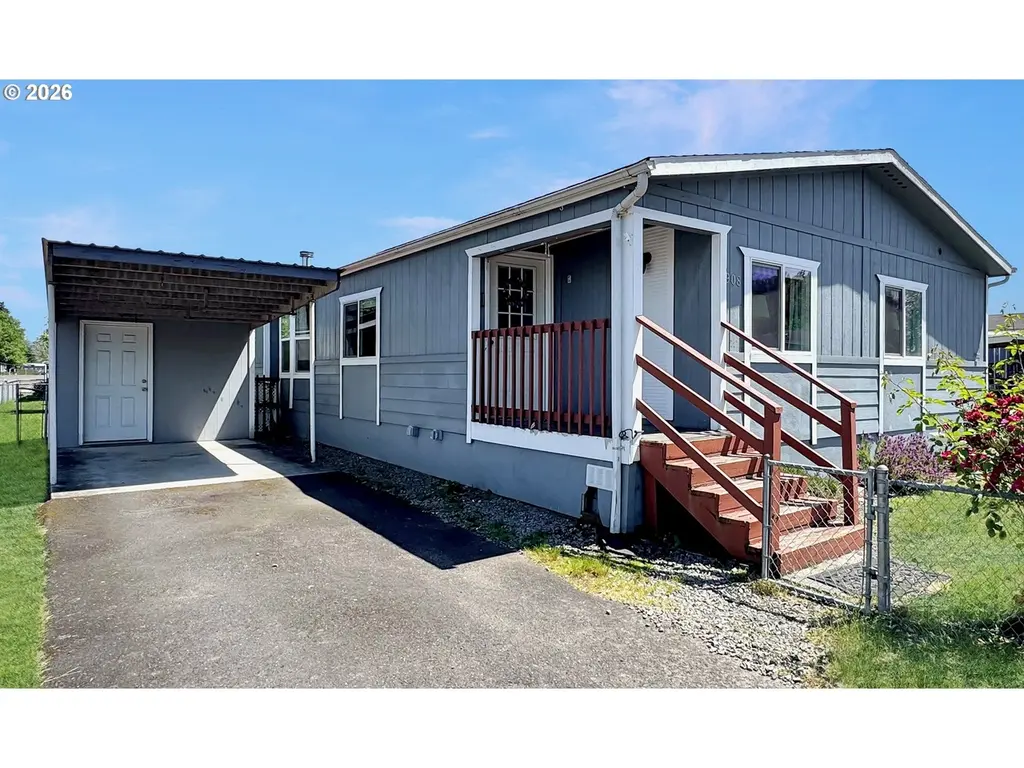
300 SW 7th Ave #908 · Battle Ground, WA
Flood risk No data
- FEMA flood zone
- —
- Chance of flooding over 30 yrs
- —
- Est. flood insurance / yr
- —
Fire risk No data
- Est. fire insurance / yr
- —
Heat risk No data
- Hot days now (above threshold)
- —
- Hot days in 30 yrs
- —
Wind risk No data
- Chance of severe wind over 30 yrs
- —
Air-quality risk No data
- Unhealthy air days now
- —
- Unhealthy air days in 30 yrs
- —
Risk factors via First Street. Map © Google.
Why this score? — see what drove the B grade
The composite is a weighted blend of 9 inputs, each scored 0–100. Each bar is that input's sub-score; the figure is the points it added to the 100-point composite (weight × sub-score).
- Cash flow +30.0/30.0
- 1% rule +10.0/10.0
- DSCR +10.0/10.0
- ARV discount +8.0/15.0
- Schools +5.0/10.0
- Livability +4.5/5.0
- Rent growth +3.5/5.0
- Condition / age +2.5/5.0
- Appreciation +0.0/10.0
$125,000
🖨 Deal sheet 📄 Offer letter ✓ Due diligence
Listing remarks MLS
55+ mobile home park located in the heart of Battle Ground. 4 bedroom home w/spacious owners suite, walk-in closet. Vaulted w/2 living spaces, dining room, large kitchen w/lots of storage. New flooring in main & 2 bedrooms. Roof approx 7 years old. Windows new. All appliances stay. Carport w/storage. Fenced corner lot with apple tree. Space rent $775 is assumable at purchase. Park approval required for purchase.
Key facts
- Gardening space
- Clubhouse
- Apple tree
Tags
Property features AI
Finance
- Other: Located in Battle Ground Mobile Estates (park rules and management approval required to buy)
- Financial info: Land lease in effect (monthly lot rent); Land lease expires April 1, 2027
- HOA & community: Park amenities managed by on-site management; Recreation facilities available; Senior community
Exterior
- Parking: Carport; Driveway; Detached 1-car garage/carport (1 space total)
- Utilities: Public water; Public sewer; Electric fuel for heat and hot water
- Home design: Manufactured home in a park; Single-story (main level living); No notable view
- Construction: Built in 1988; T-111 siding and wood composite exterior; Composition roof; Skirting foundation
- Exterior features: Fenced yard; Corner lot; Paved road access
Interior
- Kitchen: Dishwasher; Free-standing range; Microwave
- Bedrooms: Primary bedroom (main level); 2nd bedroom (main level); 3rd bedroom (main level); 4th bedroom (main level)
- Flooring: Laminate flooring
- Bathrooms: 2 full bathrooms (both on main level)
- Heating & cooling: Forced air heating; Heat pump (heating and cooling)
- Interior features: Ceiling fans; Vaulted ceilings; Laundry area; Laminate flooring
- Laundry & utility: Laundry on main level; Electric hot water
Neighborhood map
What this means for you Summary
Snapshot
- This is a 4-bed/2.0-bath manufactured listed at $125k.
Deal economics
- At list price, monthly cash flow is $2k ($18k/yr) — positive.
- The deal already cash-flows at list — no discount required.
- Meets the 1% rule at list price ($3k rent vs $125k).
- Recommended offer: $123k (1.5% below list) — sets the bar for market timing.
- Cap rate 21.1% vs local median 2.8% in Battle Ground — top-decile yield for the area; either an underpriced asset or a hidden risk that comps aren't pricing in. Stress-test before assuming the spread holds.
Location & tenants
- Location reads 90/100 on livability (#3 in WA, #93 nationally) — a professional / high-income tenant draw. Strengths: crime A+, amenities A+, employment A+; Watch: cost of living D-.
- Battle Ground School District (suburban): math 48% / reading 60% proficiency, ranked #92 of 291 in WA (top 32%) — acceptable for families but not a draw, mixed tenant base, ~2y average lease.
- Zoned schools: Captain Strong (628 students, 38% FRL); Chief Umtuch Middle (553 students, 35% FRL); Open Doors Battle Ground (15 students, 33% FRL).
- Market conditions: Rents rising fast (+4.0%/yr); 459 active listings in the ZIP; 10 comparable units currently listed for rent nearby; rentals at typical pace (median 24d on market — plan ~3-4 weeks tenant-placement turnaround); 40% of comp listings sitting > 30 days — soft ceiling on asking rent; high-income renter base; 3,547 units permitted in Clark County in 2024 (1,361 in 5+ unit buildings).
- This rent runs 31% of the median local income ($112k/yr) — at the standard rent-burdened threshold; future hikes will face affordability resistance.
Forward outlook
- Local home prices are declining (-3.0%/yr); year-one equity from $864 of loan paydown is wiped out by about $4k of value loss. Plan a longer hold.
- Clark County population projected at +29% by 2050 — long-run rental-demand tailwind backs the buy-and-hold thesis.
- At projected returns (-3.0% appreciation + 4.0% rent growth), your $35k cash investment doubles in ~3 years — after that, you're playing with house money.
Negotiation context
- It's been on market 17 days — a 2% lower offer ($123k) is reasonable based on typical stale-listing flexibility.
- 4 sale attempts since 28y ago with the ask held roughly flat each time — persistent listings suggest the price (not the market) is what's stuck; bring a comps-based counter.
- Current owner paid $80k; list at $125k implies a 56% gain — meaningful room to come down on a strong offer.
Questions for the listing agent
- Is there a deadline driving the sale (1031 exchange, divorce, estate, relocation)? That informs how much negotiation room exists.
- Schools are B-rated — typically a magnet for longer-tenancy family renters. What's the average tenant stay here, and is there a school-zone premium baked into asking?
- What's the average days-on-market for RENTAL listings here right now (not sales)? A rising rental-DOM trend means longer vacancies and softer asking-rent achievability than the comps imply.
- What's the recent tenant-quality profile in this submarket — average credit score on applications, eviction rate, late-payment / NSF rate, and stable-employment percentage? A property-management company in the area should have these aggregated.
- How much new for-sale + rental construction is in the pipeline within 1–3 miles? Heavy new supply typically softens prices + rents 12–24 months out; constrained supply supports both.
Investment metrics
- 1% rule
- 2.32% ✓
- Cap rate
- 21.07%
- Cash-on-cash
- 52.76%
- DSCR
- 3.35
- GRM
- 3.6
CMA / ARV
- ARV (on-the-fly)
- $126,522
- Comps found
- 2
Show comp detail 2 sales within ~0.75 mi
| Address | Dist | Beds/Ba | Sqft | Sold | Price | $/sf | Match |
|---|---|---|---|---|---|---|---|
| 300 SW 7th Ave #1202 | 0.00mi | 4/2.0 | 1,728 (-3%) | 6mo | $122,500 | $71 | 90 |
| 300 SW 7th Ave #502 | 0.00mi | 4/2.0 | 1,515 (-15%) | 9mo | $100,000 | $66 | 68 |
Match score weights: distance 35% · size 25% · config 20% · recency 20%. Top-matched comps best support the ARV.
Projected returns pro-forma
-3.0% appreciation · 4.0% rent growth · sell at horizon
- IRR
- 51.8%
- Equity multiple
- 3.31×
- Total profit
- $80,677
- Equity at exit
- $18,638
- IRR
- 57.5%
- Equity multiple
- 6.96×
- Total profit
- $208,707
- Equity at exit
- $10,808
Cash invested: $35,000 (down + closing). Projections, not guarantees.
Landlord ↔ Tenant lean methodology
- Overall (STATE)
- 28 Tenant-Leaning
- State Washington
- 28 Tenant-Leaning · D+8
- County
- — inherits STATE
- City
- — inherits STATE
ZIP-level market 98604
- Rents YoY
- 4.0%
- Active inventory
- 459
- Price-to-rent
- 3.6×
Monthly cashflow live
- Estimated rent
- $2,902 high interval (Pro) →
- Mortgage (P&I)
- −$656
- Tax from tax record
- −$46 /mo · $557/yr
- Insurance
- −$52
- HOA
- −$0
- Vacancy / Maint / Mgmt
- −$609
- Net cashflow
- $1,539
Break-even live
UW: 25.0% down · 7.5% · 30yr · 1.5% tax · 5.0% vac · 8.0% maint · 8.0% mgmt
Financing live
Cash to close
- Down payment
- $31,250
- Closing costs
- $3,750
- Reserves months
- —
- Total cash needed
- —
Loan-product check · same deal, 3 products live
Conventional
25% down · 7.5% · 30yr
- Down + closing
- —
- Monthly P&I
- —
- Monthly cashflow
- —
- DSCR
- —
- Eligible?
- —
Personal DTI + credit; lowest rate.
DSCR
20% down · 8.5% · 30yr
- Down + closing
- —
- Monthly P&I
- —
- Monthly cashflow
- —
- DSCR
- —
- Eligible?
- —
No personal income docs; deal must DSCR.
Hard money
10% down · 12.0% · 12mo
- Down + closing
- —
- Monthly P&I
- —
- Monthly cashflow
- —
- DSCR
- —
- Eligible?
- —
Short-term bridge; refi at stabilization.
Rent comps 10 comps
| Address | Beds | Baths | Sqft | Rent | $/sqft | DOM | Units | Dist |
|---|---|---|---|---|---|---|---|---|
| 413 SW 6th Cir Battle Ground, WA | 4.0 | 2.0 | 1794 | $3,000 | $1.67 | 43d | 1 | 0.17mi |
| 1105 N Parkway Ave Battle Ground, WA | 3.0 | 2.0 | 1384 | $2,500 | $1.81 | 2d | 1 | 0.84mi |
| 1215 SE 5th St Battle Ground, WA | 3.0 | 2.5 | 1496 | $2,425 | $1.62 | 43d | 1 | 0.93mi |
| 1200 SE 7th St Battle Ground, WA | 3.0 | 2.5 | 1754 | $2,395 | $1.37 | 1d | 1 | 0.93mi |
| 2301 SW 5th Pl Battle Ground, WA | 3.0 | 2.5 | 1450 | $2,595 | $1.79 | 2d | 1 | 0.97mi |
| 2214 NW 7th St Battle Ground, WA | 4.0 | 2.5 | 1972 | $2,795 | $1.42 | 4d | 1 | 1.01mi |
| 2030 NW 14th Way Battle Ground, WA | 4.0 | 2.5 | 1986 | $2,895 | $1.46 | 43d | 1 | 1.15mi |
| 11014 NE 197th St Battle Ground, WA | 3.0 | 2.0 | 2247 | $3,795 | $1.69 | 43d | 1 | 1.17mi |
| 724 NE 14th Way Battle Ground, WA | 3.0 | 2.5 | 1688 | $2,650 | $1.57 | 17d | 1 | 1.18mi |
| 406 SW 32nd St Battle Ground, WA | 3.0 | 2.5 | 1722 | $2,350 | $1.36 | 23d | 1 | 1.41mi |
Listing history 11 events
-
2026-06-18days on market $125,000 Active 17 DOM
-
2026-06-17days on market $125,000 Active 16 DOM
-
2026-06-16days on market $125,000 Active 15 DOM
-
2026-06-15days on market $125,000 Active 14 DOM
-
2026-06-13days on market $125,000 Active 12 DOM
-
2026-06-09days on market $125,000 Active 8 DOM
-
2026-06-08days on market $125,000 Active 7 DOM
-
2026-06-07days on market $125,000 Active 6 DOM
-
2026-06-03days on market $125,000 Active 2 DOM
-
2026-06-01remarks 504-char remark
-
2026-06-01$125,000 Active 1 DOM
ⓘ Source: listings_history table (triggers on properties + properties_extension) + one-shot
backfill from property_details.listing_events for pre-trigger history.
Tax reassessment forecast WA · Resets to sale price
- Current annual tax
- $557 · $46/mo
- Projected year-2 tax
- $1,225 · $102/mo
- Expected delta
- +$668/yr (+$56/mo · 119.9%)
ⓘ Screening estimate from a state-policy table — verify with the county assessor before closing.
Nearby sold comps map
Loading sold comps map…
Walkable amenities ~0.75 mi
Loading nearby amenities…
Taxation est. · year 1
- Rental income
- $34,828
- − Mortgage interest
- −$7,002
- − Property taxes
- −$557
- − Insurance
- −$625
- − Repairs & maintenance
- −$2,786
- − Management
- −$2,786
- − Depreciation
- −$3,636
- Taxable income
- $17,435
- Est. tax owed @ 24.0%
- −$4,184
- After-tax cash flow
- $14,281/yr
For passive investors: Depreciation is non-cash, so a rental often shows a tax loss while cash-flowing — sheltering income. Rental losses are passive: they offset passive income freely, and up to $25,000/yr can offset ordinary (W-2) income if you actively participate and your MAGI is under $100k (phasing out to $0 by $150k); unused losses carry forward. On sale, claimed depreciation is recaptured at up to 25%, and gains may owe capital-gains tax (a 1031 exchange can defer both). Figures are a year-1 estimate at your 24.0% rate — not tax advice; consult a CPA.
Schools (NCES district)
- District
- Battle Ground School District
- NCES district ID
- 5300380
- Math proficiency
- 48% ▼ -1.00%
- Reading proficiency
- 60% ▼ -1.00%
- Median HH income
- $69,646
- Composite
- 49.81/100
- National rank
- #4201
- State rank
- #92 of 291 in WA
Livability — Battle Ground
- Score
- 90/100
- State rank
- #3
- US rank
- #93
Category grades
Schools grade is shown separately in the Schools card above.
Census & demographics
- Census place
- Battle Ground, WA
- County
- Clark County · 513,189 people
- City population
- 38,839
- Metro
- Portland-Vancouver-Hillsboro, OR-WA
- Population (ZIP)
- 38,839
- Household income
- $112,448
- Rent vs Own
- Severe rent burden
- 485.0
Population outlook (Clark County) Hauer SSP2
- Today (2025)
- 529,610 people
- By 2030
- 563,242 · +6.4%
- By 2040
- 625,905 · +18.2%
- By 2050
- 681,558 · +28.7%
- By 2075
- 805,967 · +52.2%
- By 2100
- 877,450 · +65.7%
Race, ethnicity, and origin ACS 2023
- Neighborhood character
- Predominantly White (87%)
- Race & ethnicity
- White 87% Two or more races 7% Hispanic / Latino 6% Asian 1%
- Hispanic origin (detail)
- Mexican 4%
- Common ancestry
- Italian 4% Portuguese 4% Subsaharan African 4%
- Foreign-born
- 7% · Canada
- Languages at home
- 90% English-only · Russian/Polish/Slavic 6% Spanish 3%
Political lean MEDSL · Clark
- 2024 margin
- Lean D (+7.0) · D 52.1% · R 45.1% · Other 2.8%
- 2008→2024 swing
- +0.9pp no change · 2008: 6.1pp · 2024: 7.0pp
- All cycles
- 2024: D+7.0 2020: D+5.1 2016: D+0.1 2012: D+0.1 2008: D+6.1
Not yet ingested
- Civics
- —
Market trends
- HPI YoY
- ▼ -296.15%
- Current HPI
- 298.5364
- Rent YoY
- ▲ 4.00%
- Metro
- Portland-Vancouver-Hillsboro, OR-WA
- State GDP YoY
- ▲ 4.65%
- F500 in state
- 22
Industry mix (Fortune 500 HQ in WA)
| Industry | F500 HQs | Revenue |
|---|---|---|
| Retail | 2 | $269B |
|
||
| Technology / Retail | 1 | $638B |
|
||
| Technology | 1 | $245B |
|
||
| Telecommunications | 1 | $38B |
|
||
| Food / Beverage | 1 | $36B |
|
||
| Automotive / Trucks | 1 | $34B |
|
||
Price history
+160.4% since first listed15 events — show timeline
- 2026-06-01 Listed $125,000 RMLS
- 2023-08-07 Sold (MLS) $80,000 RMLS
- 2023-06-25 Pending — RMLS
- 2023-06-07 Price Changed $99,500 RMLS
- 2023-06-01 Price Changed $119,000 RMLS
- 2023-04-26 Price Changed $129,000 RMLS
- 2023-02-26 Price Changed $145,500 RMLS
- 2023-02-05 Relisted — RMLS
- 2023-02-02 Delisted — RMLS
- 2022-11-02 Price Changed $158,000 RMLS
- 2022-09-11 Price Changed $168,000 RMLS
- 2022-09-02 Price Changed $179,900 RMLS
- 2022-07-22 Listed $185,000 RMLS
- 1999-05-07 Sold (MLS) $48,000 RMLS
- 1998-03-31 Listed $48,000 RMLS
Property tax history
+12.6%/yrLatest (2026): $557 · -11.5% YoY. Source: county tax records.
Cash-flow waterfall
monthlySold comps — $/sqft
last 12 mo · ≤1 miLoading sold comps…