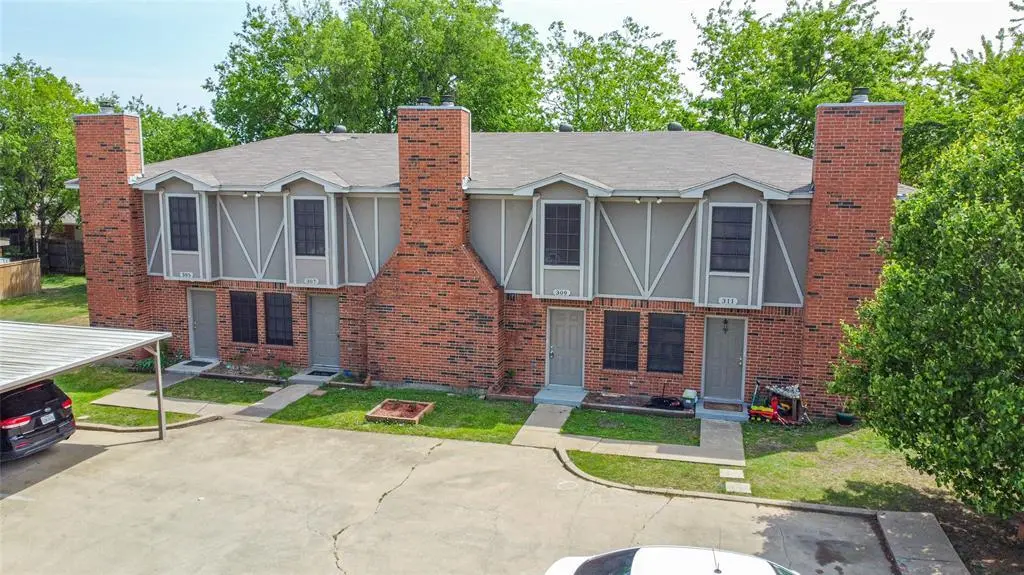
 Fourplex
305 Cambridge Dr · Saginaw, TX
Flood risk 1/10 · Minimal
- FEMA flood zone
- X (unshaded)
- Chance of flooding over 30 yrs
- 0.0%
- Est. flood insurance / yr
- $507 – $1,088
Fire risk 2/10 · Minimal
- Est. fire insurance / yr
- $1,222 – $2,270
Heat risk 7/10 · Major
- Hot days now (above 109°F)
- 7 days/yr
- Hot days in 30 yrs
- 24 days/yr
Wind risk 4/10 · Minor
- Chance of severe wind over 30 yrs
- 19.0%
Air-quality risk 2/10 · Minimal
- Unhealthy air days now
- 1 days/yr
- Unhealthy air days in 30 yrs
- 2 days/yr
Risk factors via First Street. Map © Google.
Why this score? — see what drove the C+ grade
The composite is a weighted blend of 9 inputs, each scored 0–100. Each bar is that input's sub-score; the figure is the points it added to the 100-point composite (weight × sub-score).
- Cash flow +25.2/30.0
- DSCR +8.3/10.0
- ARV discount +7.6/15.0
- 1% rule +7.2/10.0
- Livability +3.8/5.0
- Schools +3.5/10.0
- Rent growth +2.9/5.0
- Condition / age +2.5/5.0
- Appreciation +0.0/10.0
$596,000
🖨 Deal sheet 📄 Offer letter ✓ Due diligence
Multi-family units
County records classify this as Multi-Family (2-4 Unit). Listing-text estimate: 4 units. confirmed
Listing remarks MLS
Imm. maintained, 100% occupied fourplex in excellent Eagle Mountain Saginaw ISD. This is a 1 owner with the same property managment for the last 25 years! All units leased for $750 to reliable tenants. Excellent care on exterior and interior including total new HVAC, new duct work, superior insulation. Avg Elec Bill under $100 mo. Strong cash flow! Residential Financing Avail. - Live in one unit with three rented = pay for building and live free!
Key facts
- Private patio
- Private fenced yard
- 0.32 acre lot
Tags
Neighborhood map
What this means for you Summary
Snapshot
- This is a 4 × 2-bed/1.5-bath units multifamily listed at $596k.
Deal economics
- At list price, monthly cash flow is $1k ($16k/yr) — positive. Per door: $335/mo.
- The deal already cash-flows at list — no discount required.
- Meets the 1% rule at list price ($7k rent vs $596k).
- Recommended offer: $578k (3.0% below list) — sets the bar for market timing.
- Cap rate 9.0% vs local median 4.2% in Saginaw — top-decile yield for the area; either an underpriced asset or a hidden risk that comps aren't pricing in. Stress-test before assuming the spread holds.
Location & tenants
- Location reads 76/100 on livability (#112 in TX, #3,623 nationally) — a middle-class / working-renter tenant base. Strengths: employment A+, cost of living A+, housing A+; Watch: amenities F, commute F.
- Eagle Mt-Saginaw ISD (urban): math 35% / reading 42% proficiency, ranked #361 of 826 in TX (top 44%) — families likely to look elsewhere, expect single-tenant / working-renter base with shorter leases.
- Zoned schools: Bryson El (math 23% / reading 27%, grade F, #3,013 of 4,322 statewide, top 70%, 547 students, 63% FRL) — zoned schools average 63% FRL vs 36% district-wide (28 pts higher); higher-poverty schools than district average — tighter screening recommended.
- Zoned-school proficiency averages 25% at this address vs 38% district-wide (-14 pts) — the specific schools serving this property underperform the Eagle Mt-Saginaw ISD average; the district grade overstates school quality for this exact location.
- Market conditions: Rents rising (+1.5%/yr); 1050 active listings in the ZIP; solid renter incomes; 18,938 units permitted in Tarrant County in 2024 (8,336 in 5+ unit buildings).
- At $7,288/mo this rent would consume 81% of the median local household income ($107k/yr) (locally 1494% of renters already pay >50% of income on rent) — very limited rent-growth headroom before tenants either downsize or default.
Forward outlook
- Local home prices are declining (-3.0%/yr); year-one equity from $4k of loan paydown is wiped out by about $18k of value loss. Plan a longer hold.
- Tarrant County population projected at +41% by 2050 — long-run rental-demand tailwind backs the buy-and-hold thesis.
Negotiation context
- It's been on market 44 days — a 3% lower offer ($578k) is reasonable based on typical stale-listing flexibility.
- 2 sale attempts since 14y ago with the ask held roughly flat each time — persistent listings suggest the price (not the market) is what's stuck; bring a comps-based counter.
Risks & watch-outs
- Climate carrying-cost: extreme-heat days projected 7→24/yr by 2055 (HVAC capex compounding) — expect insurance premiums to compound above CPI over the hold.
Questions for the listing agent
- It's been on market 44 days. Have you received any prior offers? Is the seller open to a 3% concession, seller financing, or rate buy-down credit?
- Can we see the unit-by-unit rent roll, current vacancy, and any below-market leases? What's the average tenancy length?
- What capital expenditures (roof, boiler, parking lot, exteriors) have been made in the last 5 years, and what's planned in the next 2?
- Is there a deadline driving the sale (1031 exchange, divorce, estate, relocation)? That informs how much negotiation room exists.
- Schools are D-rated, which usually means shorter tenancies and higher turnover. Who's the typical renter profile here, and what's been the actual vacancy rate?
- What's the average days-on-market for RENTAL listings here right now (not sales)? A rising rental-DOM trend means longer vacancies and softer asking-rent achievability than the comps imply.
- What's the recent tenant-quality profile in this submarket — average credit score on applications, eviction rate, late-payment / NSF rate, and stable-employment percentage? A property-management company in the area should have these aggregated.
- How much new apartment / multifamily construction is in the pipeline within 1–3 miles? Heavy new supply (>2% of stock underway) typically softens rents 12–24 months out; light construction supports rent growth.
Investment metrics
- 1% rule
- 1.22% ✓
- Cap rate
- 8.99%
- Cash-on-cash
- 9.63%
- DSCR
- 1.43
- GRM
- 6.8
CMA / ARV
- ARV (on-the-fly)
- $597,168
- Comps found
- 1
Show comp detail 1 sale within ~0.75 mi
| Address | Dist | Beds/Ba | Sqft | Sold | Price | $/sf | Match |
|---|---|---|---|---|---|---|---|
| 305 Cambridge Dr | 0.00mi | 8/6.0 | 4,176 (0%) | 1mo | $596,000 | $143 | 91 |
Match score weights: distance 35% · size 25% · config 20% · recency 20%. Top-matched comps best support the ARV.
Projected returns pro-forma
-3.0% appreciation · 1.51% rent growth · sell at horizon
- IRR
- -3.5%
- Equity multiple
- 0.87×
- Total profit
- $-21,774
- Equity at exit
- $88,866
- IRR
- 4.3%
- Equity multiple
- 1.29×
- Total profit
- $49,165
- Equity at exit
- $51,531
Cash invested: $166,880 (down + closing). Projections, not guarantees.
Landlord ↔ Tenant lean methodology
- Overall (STATE)
- 87 Strongly Landlord-Friendly
- State Texas
- 87 Strongly Landlord-Friendly · R+5
- County
- — inherits STATE
- City
- — inherits STATE
ZIP-level market 76179
- Rents YoY
- 1.5%
- Active inventory
- 1050
- Price-to-rent
- 27.3×
Monthly cashflow live
- Estimated rent
- $7,288 high interval (Pro) →
- Mortgage (P&I)
- −$3,125
- Tax from tax record
- −$1,045 /mo · $12,537/yr
- Insurance
- −$248
- HOA
- −$0
- Vacancy / Maint / Mgmt
- −$1,530
- Net cashflow
- $1,339
Break-even live
4-unit breakdown (identical units grouped — click to expand)
| Units | Beds | Baths | Est. rent |
|---|---|---|---|
| 4× units | 2 | 1.5 | $7,288 |
| #1 | 2 | 1.5 | $1,822 |
| #2 | 2 | 1.5 | $1,822 |
| #3 | 2 | 1.5 | $1,822 |
| #4 | 2 | 1.5 | $1,822 |
| Total (4 units) | $7,288 | ||
UW: 25.0% down · 7.5% · 30yr · 1.5% tax · 5.0% vac · 8.0% maint · 8.0% mgmt
Financing live
Cash to close
- Down payment
- $149,000
- Closing costs
- $17,880
- Reserves months
- —
- Total cash needed
- —
Loan-product check · same deal, 3 products live
Conventional
25% down · 7.5% · 30yr
- Down + closing
- —
- Monthly P&I
- —
- Monthly cashflow
- —
- DSCR
- —
- Eligible?
- —
Personal DTI + credit; lowest rate.
DSCR
20% down · 8.5% · 30yr
- Down + closing
- —
- Monthly P&I
- —
- Monthly cashflow
- —
- DSCR
- —
- Eligible?
- —
No personal income docs; deal must DSCR.
Hard money
10% down · 12.0% · 12mo
- Down + closing
- —
- Monthly P&I
- —
- Monthly cashflow
- —
- DSCR
- —
- Eligible?
- —
Short-term bridge; refi at stabilization.
Listing history 9 events
-
2026-04-05status Pending
-
2026-03-07historical Active Option Contract
-
2026-02-20$596,000 Active
-
2013-03-04soldstatus
-
2013-02-28soldstatus Closed 450-char remark
Show marketing remark (450 chars)
Imm. maintained, 100% occupied fourplex in excellent Eagle Mountain Saginaw ISD. This is a 1 owner with the same property managment for the last 25 years! All units leased for $750 to reliable tenants. Excellent care on exterior and interior including total new HVAC, new duct work, superior insulation. Avg Elec Bill under $100 mo. Strong cash flow! Residential Financing Avail. - Live in one unit with three rented = pay for building and live free!
-
2013-02-19status Pending 450-char remark
Show marketing remark (450 chars)
Imm. maintained, 100% occupied fourplex in excellent Eagle Mountain Saginaw ISD. This is a 1 owner with the same property managment for the last 25 years! All units leased for $750 to reliable tenants. Excellent care on exterior and interior including total new HVAC, new duct work, superior insulation. Avg Elec Bill under $100 mo. Strong cash flow! Residential Financing Avail. - Live in one unit with three rented = pay for building and live free!
-
2013-02-15historical Active Option Contract 450-char remark
Show marketing remark (450 chars)
Imm. maintained, 100% occupied fourplex in excellent Eagle Mountain Saginaw ISD. This is a 1 owner with the same property managment for the last 25 years! All units leased for $750 to reliable tenants. Excellent care on exterior and interior including total new HVAC, new duct work, superior insulation. Avg Elec Bill under $100 mo. Strong cash flow! Residential Financing Avail. - Live in one unit with three rented = pay for building and live free!
-
2012-12-11$256,900 Active 450-char remark
Show marketing remark (450 chars)
Imm. maintained, 100% occupied fourplex in excellent Eagle Mountain Saginaw ISD. This is a 1 owner with the same property managment for the last 25 years! All units leased for $750 to reliable tenants. Excellent care on exterior and interior including total new HVAC, new duct work, superior insulation. Avg Elec Bill under $100 mo. Strong cash flow! Residential Financing Avail. - Live in one unit with three rented = pay for building and live free!
-
1983-01-04soldstatus
ⓘ Source: listings_history table (triggers on properties + properties_extension) + one-shot
backfill from property_details.listing_events for pre-trigger history.
Tax reassessment forecast TX · Resets to sale price
- Current annual tax
- $12,537 · $1,045/mo
- Projected year-2 tax
- $12,537 · $1,045/mo
- Expected delta
- $0/yr ($0/mo · 0.0%)
ⓘ Screening estimate from a state-policy table — verify with the county assessor before closing.
Climate risk First Street
- Flood 1/10 Low FEMA zone X (unshaded) · 0% chance over 30 yrs
- Wildfire 2/10 Low
- Heat 7/10 Severe 7 d/yr ≥109°F today · 24 d/yr by 30 yrs out
- Wind 4/10 Moderate 19% chance of damaging wind over 30 yrs
- Air quality 2/10 Low 1 unhealthy d/yr today · 2 by 30 yrs out
Nearby sold comps map
Loading sold comps map…
Walkable amenities ~0.75 mi
Loading nearby amenities…
Taxation est. · year 1
- Rental income
- $87,456
- − Mortgage interest
- −$33,385
- − Property taxes
- −$12,537
- − Insurance
- −$2,980
- − Repairs & maintenance
- −$6,996
- − Management
- −$6,996
- − Depreciation
- −$17,338
- Taxable income
- $7,222
- Est. tax owed @ 24.0%
- −$1,733
- After-tax cash flow
- $14,334/yr
For passive investors: Depreciation is non-cash, so a rental often shows a tax loss while cash-flowing — sheltering income. Rental losses are passive: they offset passive income freely, and up to $25,000/yr can offset ordinary (W-2) income if you actively participate and your MAGI is under $100k (phasing out to $0 by $150k); unused losses carry forward. On sale, claimed depreciation is recaptured at up to 25%, and gains may owe capital-gains tax (a 1031 exchange can defer both). Figures are a year-1 estimate at your 24.0% rate — not tax advice; consult a CPA.
Schools (NCES district)
- District
- Eagle Mt-Saginaw ISD
- NCES district ID
- 4817700
- Math proficiency
- 35% ▼ -16.00%
- Reading proficiency
- 42% ▼ -9.00%
- Median HH income
- $72,781
- Composite
- 35.41/100
- National rank
- #4945
- State rank
- #361 of 826 in TX
Livability — Saginaw
- Score
- 76/100
- State rank
- #112
- US rank
- #3623
Category grades
Schools grade is shown separately in the Schools card above.
Census & demographics
- Census place
- Saginaw, TX
- County
- Tarrant County · 2,033,669 people
- City population
- 56,322
- Metro
- Dallas-Fort Worth-Arlington, TX
- Population (ZIP)
- 80,090
- Household income
- $107,428
- Rent vs Own
- Severe rent burden
- 1494.0
Population outlook (Tarrant County) Hauer SSP2
- Today (2025)
- 2,380,417 people
- By 2030
- 2,578,900 · +8.3%
- By 2040
- 2,974,995 · +25.0%
- By 2050
- 3,350,489 · +40.8%
- By 2075
- 4,216,909 · +77.2%
- By 2100
- 4,741,527 · +99.2%
Race, ethnicity, and origin ACS 2023
- Neighborhood character
- Diverse neighborhood (Simpson 0.63)
- Race & ethnicity
- White 53% Hispanic / Latino 28% Two or more races 14% Black 12% Asian 4%
- Hispanic origin (detail)
- Mexican 22% Puerto Rican 2%
- Common ancestry
- Slovak 2% Lithuanian 2% Italian 1%
- Foreign-born
- 8% · Canada, Jamaica
- Languages at home
- 81% English-only · Spanish 15% Other Asian/Pacific 2% Other Indo-European 1%
Political lean MEDSL · Tarrant
- 2024 margin
- Lean R (+5.1) · D 46.7% · R 51.9% · Other 1.4%
- 2008→2024 swing
- +6.6pp toward D · 2008: -11.7pp · 2024: -5.1pp
- All cycles
- 2024: R+5.1 2020: D+0.2 2016: R+8.7 2012: R+15.7 2008: R+11.7
Not yet ingested
- Civics
- —
Market trends
- HPI YoY
- ▼ -137.12%
- Current HPI
- 237.6676
- Rent YoY
- ▲ 1.51%
- Metro
- Dallas-Fort Worth-Arlington, TX
- State GDP YoY
- ▲ 3.95%
- F500 in state
- 110
Industry mix (Fortune 500 HQ in TX)
| Industry | F500 HQs | Revenue |
|---|---|---|
| Energy | 16 | $1,198B |
|
||
| Technology | 5 | $198B |
|
||
| Engineering / Construction | 4 | $72B |
|
||
| Energy Services | 3 | $60B |
|
||
| Utilities | 3 | $41B |
|
||
| Healthcare | 2 | $330B |
|
||
Price history
+132.0% since first listed9 events — show timeline
- 2026-04-05 Pending — NTREIS
- 2026-03-07 Contingent — NTREIS
- 2026-02-20 Listed $596,000 NTREIS
- 2013-03-04 Sold (Public Records) — Public Records
- 2013-02-28 Sold (MLS) — NTREIS
- 2013-02-19 Pending — NTREIS
- 2013-02-15 Contingent — NTREIS
- 2012-12-11 Listed $256,900 NTREIS
- 1983-01-04 Sold (Public Records) — Public Records
Property tax history
+5.8%/yrLatest (2025): $12,537 · -12.2% YoY. Source: county tax records.
Cash-flow waterfall
monthlySold comps — $/sqft
last 12 mo · ≤1 miLoading sold comps…