5409 Umar Ave · McAllen, TX
Flood risk 1/10 · Minimal
- FEMA flood zone
- —
- Chance of flooding over 30 yrs
- 0.0%
- Est. flood insurance / yr
- —
Fire risk 5/10 · Moderate
- Est. fire insurance / yr
- $1,222 – $2,270
Heat risk 9/10 · Severe
- Hot days now (above 111°F)
- 7 days/yr
- Hot days in 30 yrs
- 22 days/yr
Wind risk 8/10 · Major
- Chance of severe wind over 30 yrs
- 99.0%
Air-quality risk 2/10 · Minimal
- Unhealthy air days now
- 0 days/yr
- Unhealthy air days in 30 yrs
- 1 days/yr
Risk factors via First Street. Map © Google.
Why this score? — see what drove the F grade
The composite is a weighted blend of 9 inputs, each scored 0–100. Each bar is that input's sub-score; the figure is the points it added to the 100-point composite (weight × sub-score).
- Appreciation +10.0/10.0
- Cash flow +6.9/30.0
- Livability +3.8/5.0
- Schools +3.4/10.0
- Rent growth +3.1/5.0
- Condition / age +2.5/5.0
- DSCR +1.1/10.0
- 1% rule +0.9/10.0
- ARV discount +0.0/15.0
$345,005
🖨 Deal sheet 📄 Offer letter ✓ Due diligence
Listing remarks MLS
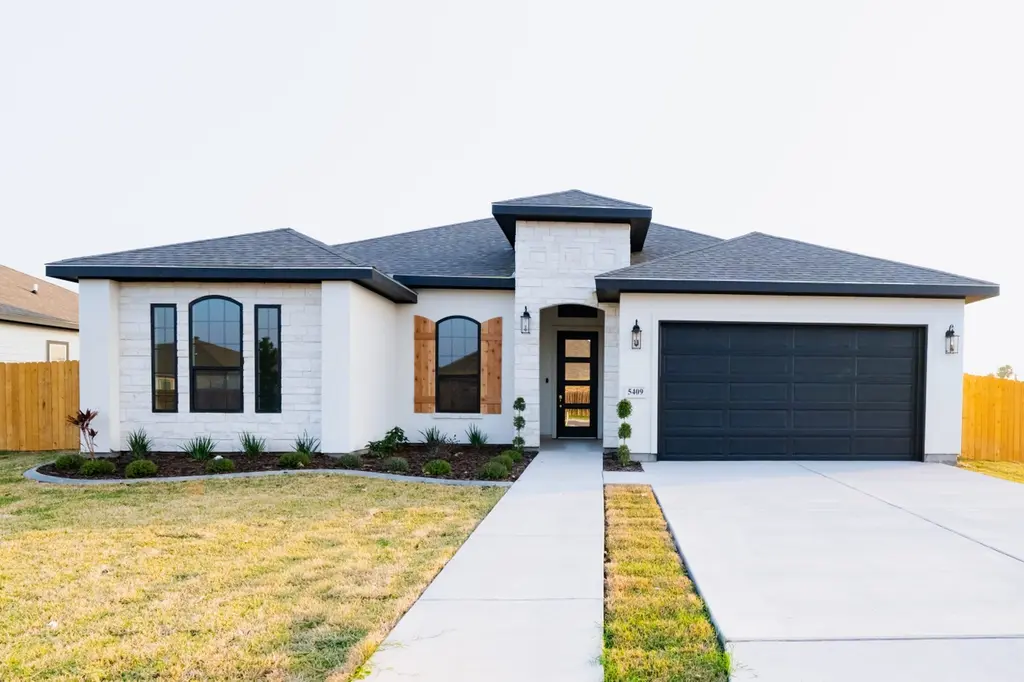
The Ethan Floor Plan is a modern, open-concept home thoughtfully designed for both style and functionality. This single-story layout features three spacious bedrooms, including a luxurious master bedroom with an attached walk-in closet and customizable master bath options. The master bath can be tailored with a garden tub and shower combination, a double sink vanity, or knee-space enhancements to fit homeowners' needs. At the heart of the home, the open living room, kitchen, and dining room create a seamless flow, ideal for family gatherings or entertaining guests. The kitchen is a chef's delight, featuring a large island, walk-in pantry, and easy access to the dining space. Two secondary bedrooms are perfectly positioned near a shared bathroom #2 for added convenience, while the nearby utility room ensures laundry and home maintenance tasks are effortless. A covered patio off the living area provides a cozy outdoor retreat, perfect for relaxing or entertaining in all seasons. The foyer and welcoming porch add curb appeal, leading to the two-car garage, which offers ample storage and parking space. With its versatile design and optional upgrades, the Ethan Floor Plan is a perfect choice for growing families or individuals seeking comfort, elegance, and modern living.
Key facts
- Large island
- Walk in closet
- Walk in pantry
Tags
Neighborhood map
What this means for you Summary
Snapshot
- This is a 3-bed/2.0-bath land listed at $345k.
Deal economics
- At list price, monthly cash flow is $-520 ($-6k/yr) — negative.
- To cash-flow at today's rent, offer at most $253k (26.6% below list).
- To meet the 1% rule (rent ≥ 1% of price), the offer needs to be $203k (41.0% below list).
- Recommended offer: $203k (41.0% below list) — sets the bar for 1% rule.
Location & tenants
- Location reads 76/100 on livability (#119 in TX, #3,771 nationally) — a middle-class / working-renter tenant base. Strengths: cost of living A+, housing A+, health & safety A+; Watch: employment D, amenities F, commute F.
- Sharyland ISD (urban): math 34% / reading 44% proficiency, ranked #406 of 826 in TX (top 49%) — families likely to look elsewhere, expect single-tenant / working-renter base with shorter leases.
- Market conditions: Rents rising (+2.5%/yr); 623 active listings in the ZIP; 15 comparable units currently listed for rent nearby; rentals at typical pace (median 14d on market — plan ~3-4 weeks tenant-placement turnaround); 40% of comp listings sitting > 30 days — soft ceiling on asking rent; 7,378 units permitted in Hidalgo County in 2024 (641 in 5+ unit buildings).
- This rent runs 44% of the median local income ($55k/yr) — at the standard rent-burdened threshold; future hikes will face affordability resistance.
Forward outlook
- In year one you build about $37k of equity ($2k loan paydown + $35k appreciation (10.0% local appreciation)).
- Hidalgo County population projected at +28% by 2050 — long-run rental-demand tailwind backs the buy-and-hold thesis.
- By year 2, paydown + projected appreciation supports a ~$59k cash-out refi (75% LTV) — recoverable capital for the next deal without selling this one.
Negotiation context
- It's been on market 90 days — a 6% lower offer ($324k) is reasonable based on typical stale-listing flexibility.
Risks & watch-outs
- Climate carrying-cost: severe wind risk, 99% chance of damaging wind over 30y; moderate wildfire risk; extreme-heat days projected 7→22/yr by 2055 (HVAC capex compounding) — expect insurance premiums to compound above CPI over the hold.
Questions for the listing agent
- What do current leases actually rent for vs. the listed asking? Can we see a recent rent roll and the last 12 months of T-12 income?
- It's been on market 90 days. Have you received any prior offers? Is the seller open to a 41% concession, seller financing, or rate buy-down credit?
- What does the HOA fee cover, when was the last increase, and are there any pending special assessments or reserve-fund shortfalls?
- Why hasn't it sold? Are there any deal-killer items the seller is aware of (foundation, flood, title, zoning, code violations)?
- Is there a deadline driving the sale (1031 exchange, divorce, estate, relocation)? That informs how much negotiation room exists.
- Schools are B-rated — typically a magnet for longer-tenancy family renters. What's the average tenant stay here, and is there a school-zone premium baked into asking?
- The area grade is low — what's the realistic commute time and amenity access for the typical tenant pool here? Any planned neighborhood developments (good or bad) we should know about?
- What's the average days-on-market for RENTAL listings here right now (not sales)? A rising rental-DOM trend means longer vacancies and softer asking-rent achievability than the comps imply.
- What's the recent tenant-quality profile in this submarket — average credit score on applications, eviction rate, late-payment / NSF rate, and stable-employment percentage? A property-management company in the area should have these aggregated.
- How much new for-sale + rental construction is in the pipeline within 1–3 miles? Heavy new supply typically softens prices + rents 12–24 months out; constrained supply supports both.
Investment metrics
- 1% rule
- 0.59% ✗
- Cap rate
- 4.48%
- Cash-on-cash
- -6.46%
- DSCR
- 0.71
- GRM
- 14.1
CMA / ARV
- ARV (median comp)
- $293,557
- List price
- $345,005
- Delta
- 17.53%
- Verdict
- OVERPRICED
- Comps
- 20 within 1.0 mi
Projected returns pro-forma
10.0% appreciation · 2.45% rent growth · sell at horizon
- IRR
- 19.6%
- Equity multiple
- 2.59×
- Total profit
- $153,511
- Equity at exit
- $310,808
- IRR
- 17.9%
- Equity multiple
- 5.92×
- Total profit
- $475,652
- Equity at exit
- $670,269
Cash invested: $96,601 (down + closing). Projections, not guarantees.
Landlord ↔ Tenant lean methodology
- Overall (STATE)
- 87 Strongly Landlord-Friendly
- State Texas
- 87 Strongly Landlord-Friendly · R+5
- County
- — inherits STATE
- City
- — inherits STATE
ZIP-level market 78573
- Home prices YoY
- 8.0%
- Rents YoY
- 2.5%
- Active inventory
- 623
- Price-to-rent
- 14.1×
Monthly cashflow live
- Estimated rent
- $2,034 high interval (Pro) →
- Mortgage (P&I)
- −$1,809
- Tax from tax record
- −$148 /mo · $1,778/yr
- Insurance
- −$144
- HOA
- −$26
- Vacancy / Maint / Mgmt
- −$427
- Net cashflow
- $-520
Break-even live
UW: 25.0% down · 7.5% · 30yr · 1.5% tax · 5.0% vac · 8.0% maint · 8.0% mgmt
Financing live
Cash to close
- Down payment
- $86,251
- Closing costs
- $10,350
- Reserves months
- —
- Total cash needed
- —
Loan-product check · same deal, 3 products live
Conventional
25% down · 7.5% · 30yr
- Down + closing
- —
- Monthly P&I
- —
- Monthly cashflow
- —
- DSCR
- —
- Eligible?
- —
Personal DTI + credit; lowest rate.
DSCR
20% down · 8.5% · 30yr
- Down + closing
- —
- Monthly P&I
- —
- Monthly cashflow
- —
- DSCR
- —
- Eligible?
- —
No personal income docs; deal must DSCR.
Hard money
10% down · 12.0% · 12mo
- Down + closing
- —
- Monthly P&I
- —
- Monthly cashflow
- —
- DSCR
- —
- Eligible?
- —
Short-term bridge; refi at stabilization.
Rent comps 15 comps
| Address | Beds | Baths | Sqft | Rent | $/sqft | DOM | Units | Dist |
|---|---|---|---|---|---|---|---|---|
| 4616 Swallow Ave McAllen, TX | 3.0 | 2.0 | 1381 | $1,600 | $1.16 | 14d | 1 | 0.48mi |
| 4416 Thunderbird Ave McAllen, TX | 4.0 | 2.5 | 2076 | $2,200 | $1.06 | 14d | 1 | 0.58mi |
| 5508 Cornell Ave Mission, TX | 3.0 | 2.5 | 1900 | $2,600 | $1.37 | 14d | 1 | 0.58mi |
| 8015 N 48th Ln McAllen, TX | 4.0 | 3.0 | 2080 | $2,500 | $1.20 | 14d | 1 | 0.71mi |
| 4808 Ibis Ave McAllen, TX | 4.0 | 2.0 | 1364 | $1,500 | $1.10 | 44d | 1 | 0.78mi |
| 4408 Heron Ct McAllen, TX | 3.0 | 2.5 | 1738 | $2,900 | $1.67 | 43d | 1 | 0.99mi |
| 4012 Auburn Ave McAllen, TX | 3.0 | 2.0 | 1843 | $1,900 | $1.03 | 14d | 1 | 1.01mi |
| 4012 Auburn Ave McAllen, TX | 3.0 | 2.0 | 1843 | $2,000 | $1.09 | 43d | 1 | 1.01mi |
| 3908 Zenker Ave McAllen, TX | 4.0 | 2.5 | 1946 | $3,500 | $1.80 | 43d | 1 | 1.02mi |
| 3104 E Kennedy Ave Alton, TX | 3.0 | 2.5 | 1642 | $2,600 | $1.58 | 43d | 1 | 1.19mi |
| 3601 Warbler Ave McAllen, TX | 3.0 | 2.0 | 1568 | $1,500 | $0.96 | 23d | 1 | 1.24mi |
| 3509 Robin Ave McAllen, TX | 3.0 | 2.0 | 1827 | $1,795 | $0.98 | 14d | 1 | 1.33mi |
| 4616 Xanthisma Ave McAllen, TX | 3.0 | 2.0 | 1332 | $1,950 | $1.46 | 14d | 1 | 1.39mi |
| 3409 Martin Ave McAllen, TX | 4.0 | 2.0 | 1958 | $1,895 | $0.97 | 14d | 1 | 1.47mi |
| 4830 N 47th Ln McAllen, TX | 4.0 | 2.5 | 1704 | $2,222 | $1.30 | 43d | 1 | 1.48mi |
HOA detail
- Monthly dues
- $26 · $312/yr
Listing history 15 events
-
2026-06-18days on market $345,005 Active 90 DOM
-
2026-06-17days on market $345,005 Active 89 DOM
-
2026-06-16days on market $345,005 Active 88 DOM
-
2026-06-15days on market $345,005 Active 87 DOM
-
2026-06-14pricedays on market $345,005 Active 85 DOM
-
2026-06-10days on market $344,355 Active 82 DOM
-
2026-06-09days on market $344,355 Active 81 DOM
-
2026-06-08days on market $344,355 Active 80 DOM
-
2026-06-07days on market $344,355 Active 79 DOM
-
2026-06-03days on market $344,355 Active 75 DOM
-
2026-06-02days on market $344,355 Active 74 DOM
-
2026-06-01days on market $344,355 Active 73 DOM
-
2026-05-31days on market $344,355 Active 72 DOM
-
2026-05-31pricedays on market $344,355 Active 71 DOM
-
2026-03-20$345,005 Active 1287-char remark
Show marketing remark (1287 chars)
The Ethan Floor Plan is a modern, open-concept home thoughtfully designed for both style and functionality. This single-story layout features three spacious bedrooms, including a luxurious master bedroom with an attached walk-in closet and customizable master bath options. The master bath can be tailored with a garden tub and shower combination, a double sink vanity, or knee-space enhancements to fit homeowners' needs. At the heart of the home, the open living room, kitchen, and dining room create a seamless flow, ideal for family gatherings or entertaining guests. The kitchen is a chef's delight, featuring a large island, walk-in pantry, and easy access to the dining space. Two secondary bedrooms are perfectly positioned near a shared bathroom #2 for added convenience, while the nearby utility room ensures laundry and home maintenance tasks are effortless. A covered patio off the living area provides a cozy outdoor retreat, perfect for relaxing or entertaining in all seasons. The foyer and welcoming porch add curb appeal, leading to the two-car garage, which offers ample storage and parking space. With its versatile design and optional upgrades, the Ethan Floor Plan is a perfect choice for growing families or individuals seeking comfort, elegance, and modern living.
ⓘ Source: listings_history table (triggers on properties + properties_extension) + one-shot
backfill from property_details.listing_events for pre-trigger history.
Tax reassessment forecast TX · Resets to sale price
- Current annual tax
- $1,778 · $148/mo
- Projected year-2 tax
- $6,314 · $526/mo
- Expected delta
- +$4,535/yr (+$378/mo · 255.1%)
ⓘ Screening estimate from a state-policy table — verify with the county assessor before closing.
Climate risk First Street
- Flood 1/10 Low 0% chance over 30 yrs
- Wildfire 5/10 Major
- Heat 9/10 Extreme 7 d/yr ≥111°F today · 22 d/yr by 30 yrs out
- Wind 8/10 Severe 99% chance of damaging wind over 30 yrs
- Air quality 2/10 Low 0 unhealthy d/yr today · 1 by 30 yrs out
Nearby sold comps map
Loading sold comps map…
Walkable amenities ~0.75 mi
Loading nearby amenities…
Taxation est. · year 1
- Rental income
- $24,408
- − Mortgage interest
- −$19,326
- − Property taxes
- −$1,778
- − Insurance
- −$1,725
- − Repairs & maintenance
- −$1,953
- − Management
- −$1,953
- − HOA
- −$312
- − Depreciation
- −$10,037
- Taxable loss
- −$12,675
- Est. tax savings @ 24.0%
- +$3,042
- After-tax cash flow
- $-3,202/yr
For passive investors: Depreciation is non-cash, so a rental often shows a tax loss while cash-flowing — sheltering income. Rental losses are passive: they offset passive income freely, and up to $25,000/yr can offset ordinary (W-2) income if you actively participate and your MAGI is under $100k (phasing out to $0 by $150k); unused losses carry forward. On sale, claimed depreciation is recaptured at up to 25%, and gains may owe capital-gains tax (a 1031 exchange can defer both). Figures are a year-1 estimate at your 24.0% rate — not tax advice; consult a CPA.
Schools (NCES district)
- District
- Sharyland ISD
- NCES district ID
- 4839930
- Math proficiency
- 34% ▼ -35.00%
- Reading proficiency
- 44% ▼ -15.00%
- Median HH income
- $57,792
- Composite
- 34.38/100
- National rank
- #5214
- State rank
- #406 of 826 in TX
Livability — McAllen
- Score
- 76/100
- State rank
- #119
- US rank
- #3771
Category grades
Schools grade is shown separately in the Schools card above.
Census & demographics
- Census place
- McAllen, TX
- County
- Hidalgo County · 623,128 people
- City population
- 144,650
- Metro
- McAllen-Edinburg-Mission, TX
- Population (ZIP)
- 44,809
- Household income
- $55,000
- Rent vs Own
- Severe rent burden
- 855.0
Population outlook (Hidalgo County) Hauer SSP2
- Today (2025)
- 955,232 people
- By 2030
- 1,009,774 · +5.7%
- By 2040
- 1,120,332 · +17.3%
- By 2050
- 1,225,036 · +28.2%
- By 2075
- 1,439,189 · +50.7%
- By 2100
- 1,533,429 · +60.5%
Race, ethnicity, and origin ACS 2023
- Neighborhood character
- Predominantly Hispanic (96%)
- Race & ethnicity
- Hispanic / Latino 96% Two or more races 63% White 3%
- Hispanic origin (detail)
- Mexican 94%
- Foreign-born
- 28% · Canada
- Languages at home
- 12% English-only · Spanish 88%
Political lean MEDSL · Hidalgo
- 2024 margin
- Toss-up / Even · D 48.1% · R 51.0%
- 2008→2024 swing
- -41.6pp toward R · 2008: 38.7pp · 2024: -2.9pp
- All cycles
- 2024: R+2.9 2020: D+17.1 2016: D+40.5 2012: D+41.8 2008: D+38.7
Not yet ingested
- Civics
- —
Market trends
- HPI YoY
- ▲ 17.95%
- Current HPI
- 242.0711
- Rent YoY
- ▲ 2.45%
- Metro
- McAllen-Edinburg-Mission, TX
- State GDP YoY
- ▲ 3.95%
- F500 in state
- 110
Industry mix (Fortune 500 HQ in TX)
| Industry | F500 HQs | Revenue |
|---|---|---|
| Energy | 16 | $1,198B |
|
||
| Technology | 5 | $198B |
|
||
| Engineering / Construction | 4 | $72B |
|
||
| Energy Services | 3 | $60B |
|
||
| Utilities | 3 | $41B |
|
||
| Healthcare | 2 | $330B |
|
||
Price history
1 event — show timeline
- 2026-03-20 Listed $345,005 Zillow
Property tax history
+11.9%/yrLatest (2025): $1,778 · +4.2% YoY. Source: county tax records.
Cash-flow waterfall
monthlySold comps — $/sqft
last 12 mo · ≤1 miLoading sold comps…