 🏷️ Likely Rental
73 Redwing Ln · Madison, WI
Flood risk 1/10 · Minimal
- FEMA flood zone
- X (unshaded)
- Chance of flooding over 30 yrs
- 0.0%
- Est. flood insurance / yr
- $473 – $860
Fire risk 3/10 · Minor
- Est. fire insurance / yr
- $636 – $1,182
Heat risk 2/10 · Minimal
- Hot days now (above 100°F)
- 7 days/yr
- Hot days in 30 yrs
- 14 days/yr
Wind risk 2/10 · Minimal
- Chance of severe wind over 30 yrs
- —
Air-quality risk 3/10 · Minor
- Unhealthy air days now
- 2 days/yr
- Unhealthy air days in 30 yrs
- 3 days/yr
Risk factors via First Street. Map © Google.
Why this score? — see what drove the B- grade
The composite is a weighted blend of 9 inputs, each scored 0–100. Each bar is that input's sub-score; the figure is the points it added to the 100-point composite (weight × sub-score).
- Cash flow +30.0/30.0
- 1% rule +10.0/10.0
- DSCR +10.0/10.0
- ARV discount +7.5/15.0
- Livability +4.2/5.0
- Schools +3.3/10.0
- Rent growth +2.8/5.0
- Condition / age +2.2/5.0
- Appreciation +0.0/10.0
$49,900
🖨 Deal sheet (PDF) 📄 Offer letter ✓ Due diligence
Listing remarks
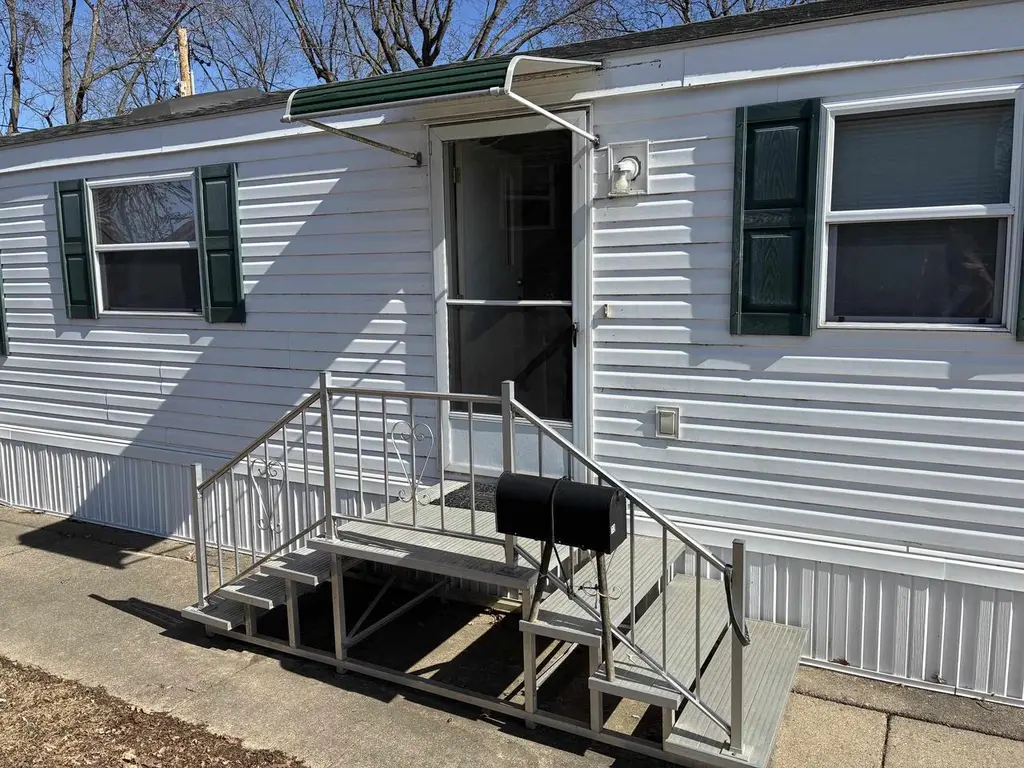
This is a 2003 Wick manufactured home! This home offers 2 bedrooms and 1 full bath, along with a skylight in the living room that brings in great natural light. Includes two parking stalls and two storage sheds. Appliances included are the refrigerator, stove, dishwasher, microwave, washer, and dryer. Home also features central heating and air conditioning. Current lot rent is approximately $800/month, with water, sewer, and parking bringing the monthly total to approximately $840. Water heater, water softener, and refrigerator are estimated to be 8?9 years old. Available now! Must apply in Park
Key facts
- Central heating
- Air conditioning
- Water heater
Tags
Property features AI
Exterior
- Utilities: Municipal water; Municipal sewer; Natural gas
- Home design: Single-family home; One story; Owner-reported year built
- Construction: Vinyl siding
- Exterior features: Vinyl exterior; Two sheds; Subdivision: Oak Park Terrace; Zoned residential
Interior
- Kitchen: Refrigerator; Stove; Dishwasher; Microwave
- Bedrooms: Master bedroom (Main) — 10 x 10; Bedroom 2 (Main) — 8 x 9
- Bathrooms: One full bathroom including a master full bath
- Heating & cooling: Central air; Natural gas heating
- Interior features: Skylights; High-speed internet
- Laundry & utility: Washer; Dryer; Air conditioning
Neighborhood map
What this means for you Summary
Snapshot
- This is a 2-bed/1.0-bath single-family listed at $50k. Condition is rated fair.
Deal economics
- At list price, monthly cash flow is $676 ($8k/yr) — positive.
- The deal already cash-flows at list — no discount required.
- Meets the 1% rule at list price ($1k rent vs $50k).
- Recommended offer: $48k (3.0% below list) — sets the bar for market timing.
- Cap rate 22.5% vs local median 2.4% in Madison — top-decile yield for the area; either an underpriced asset or a hidden risk that comps aren't pricing in. Stress-test before assuming the spread holds.
Location & tenants
- Location reads 84/100 on livability (#39 in WI, #819 nationally) — a professional / high-income tenant draw. Strengths: commute A+, employment A+, housing A+; Watch: schools C-.
- Madison Metropolitan School District (urban): math 35% / reading 40% proficiency, ranked #193 of 342 in WI (top 56%) — families likely to look elsewhere, expect single-tenant / working-renter base with shorter leases.
- Market conditions: Rents rising (+1.1%/yr); 141 active listings in the ZIP; 16 comparable units currently listed for rent nearby; rentals at typical pace (median 15d on market — plan ~3-4 weeks tenant-placement turnaround); 5,519 units permitted in Dane County in 2024 (3,978 in 5+ unit buildings).
Forward outlook
- Local home prices are declining (-3.0%/yr); year-one equity from $345 of loan paydown is wiped out by about $1k of value loss. Plan a longer hold.
- Dane County population projected at +35% by 2050 — long-run rental-demand tailwind backs the buy-and-hold thesis.
- At projected returns (-3.0% appreciation + 1.1% rent growth), your $14k cash investment doubles in ~2 years — after that, you're playing with house money.
Negotiation context
- It's been on market 34 days — a 3% lower offer ($48k) is reasonable based on typical stale-listing flexibility.
Questions for the listing agent
- It's been on market 34 days. Have you received any prior offers? Is the seller open to a 3% concession, seller financing, or rate buy-down credit?
- Have any recent inspections been done? Can we get a copy of the seller's disclosures and any deferred-maintenance estimates?
- Is there a deadline driving the sale (1031 exchange, divorce, estate, relocation)? That informs how much negotiation room exists.
- What's the average days-on-market for RENTAL listings here right now (not sales)? A rising rental-DOM trend means longer vacancies and softer asking-rent achievability than the comps imply.
- What's the recent tenant-quality profile in this submarket — average credit score on applications, eviction rate, late-payment / NSF rate, and stable-employment percentage? A property-management company in the area should have these aggregated.
- How much new for-sale + rental construction is in the pipeline within 1–3 miles? Heavy new supply typically softens prices + rents 12–24 months out; constrained supply supports both.
Investment metrics
- 1% rule
- 2.59% ✓
- Cap rate
- 22.54%
- Cash-on-cash
- 58.02%
- DSCR
- 3.58
- GRM
- 3.2
CMA / ARV
- ARV (median comp)
- $304,196
- List price
- $49,900
- Delta
- -83.60%
- Verdict
- UNDERPRICED
- Comps
- 20 within 1.0 mi
Show comp detail 3 sales within ~0.75 mi
| Address | Dist | Beds/Ba | Sqft | Sold | Price | $/sf | Match |
|---|---|---|---|---|---|---|---|
| 3514 Spenser Ln | 0.45mi | 3/1.0 (+1) | 845 (+1%) | 2mo | $305,000 | $361 | 71 |
| 1925 Tennyson Ln | 0.23mi | 3/1.0 (+1) | 920 (+10%) | 4mo | $207,500 | $226 | 65 |
| 1945 Tennyson Ln | 0.18mi | 3/1.0 (+1) | 920 (+10%) | 16mo | $291,000 | $316 | 57 |
Match score weights: distance 35% · size 25% · config 20% · recency 20%. Top-matched comps best support the ARV.
Projected returns pro-forma
-3.0% appreciation · 1.14% rent growth · sell at horizon
- IRR
- 54.5%
- Equity multiple
- 3.33×
- Total profit
- $32,587
- Equity at exit
- $7,440
- IRR
- 58.9%
- Equity multiple
- 6.33×
- Total profit
- $74,477
- Equity at exit
- $4,314
Cash invested: $13,972 (down + closing). Projections, not guarantees.
Landlord ↔ Tenant lean methodology
- Overall (STATE)
- 73 Landlord-Friendly
- State Wisconsin
- 73 Landlord-Friendly · R+2
- County
- — inherits STATE
- City
- — inherits STATE
ZIP-level market 53704
- Rents YoY
- 1.1%
- Active inventory
- 141
- Price-to-rent
- 3.2×
Monthly cashflow live
- Estimated rent
- $1,292 high interval (Pro) →
- Mortgage (P&I)
- −$262
- Tax est. 1.5%
- −$62 /mo · $748/yr
- Insurance
- −$21
- HOA
- −$0
- Vacancy / Maint / Mgmt
- −$271
- Net cashflow
- $676
Break-even live
Sensitivity live
| Price | -10% $710 | -5% $693 | +0% $676 | +5% $658 | +10% $641 |
|---|---|---|---|---|---|
| Rent | -10% $574 | -5% $625 | +0% $676 | +5% $727 | +10% $778 |
| Rate | -1.0pp $701 | -0.5pp $688 | base $676 | +0.5pp $663 | +1.0pp $649 |
UW: 25.0% down · 7.5% · 30yr · 1.5% tax · 5.0% vac · 8.0% maint · 8.0% mgmt
Financing live
Cash to close
- Down payment
- $12,475
- Closing costs
- $1,497
- Reserves months
- —
- Total cash needed
- —
Loan-product check · same deal, 3 products live
Conventional
25% down · 7.5% · 30yr
- Down + closing
- —
- Monthly P&I
- —
- Monthly cashflow
- —
- DSCR
- —
- Eligible?
- —
Personal DTI + credit; lowest rate.
DSCR
20% down · 8.5% · 30yr
- Down + closing
- —
- Monthly P&I
- —
- Monthly cashflow
- —
- DSCR
- —
- Eligible?
- —
No personal income docs; deal must DSCR.
Hard money
10% down · 12.0% · 12mo
- Down + closing
- —
- Monthly P&I
- —
- Monthly cashflow
- —
- DSCR
- —
- Eligible?
- —
Short-term bridge; refi at stabilization.
Rent comps 16 comps
| Address | Beds | Baths | Sqft | Rent | $/sqft | DOM | Units | Dist |
|---|---|---|---|---|---|---|---|---|
| 3710 Packers Ave Unit 3710-102 Madison, WI | 1.0 | 1.0 | 630 | $1,125 | $1.79 | 44d | 1 | 0.14mi |
| 3702 Packers Ave Madison, WI | 1.0 | 1.0 | 585 | $1,045 | $1.79 | 14d | 1 | 0.17mi |
| 3602 Packers Ave Unit 3602-206 Madison, WI | 1.0 | 1.0 | 585 | $1,045 | $1.79 | 44d | 1 | 0.21mi |
| 3602 Packers Ave Unit 3602-209 Madison, WI | 1.0 | 1.0 | 585 | $1,045 | $1.79 | 20d | 1 | 0.21mi |
| 3401 Kipling Dr Unit 5 Madison, WI | 2.0 | 1.0 | 800 | $1,190 | $1.49 | 20d | 1 | 0.34mi |
| 2838 Dryden Dr Madison, WI | 1.0–2.0 | 1.0–2.0 | 882 | $1,905 | $2.16 | 14d | 8 | 0.62mi |
| 2802 Dryden Dr Madison, WI | 2.0 | 1.0–1.5 | 1032 | $1,895 | $1.84 | 14d | 8 | 0.65mi |
| 2002 Elka Ln Madison, WI | 1.0 | 1.0 | 670 | $1,150 | $1.72 | 14d | 5 | 0.67mi |
| 1619 Troy Dr Unit 1619-307 Madison, WI | 1.0 | 1.0 | 630 | $1,125 | $1.79 | 44d | 1 | 0.69mi |
| 1505 Trailsway Unit 7 Madison, WI | 2.0 | 1.0 | 800 | $1,450 | $1.81 | 14d | 1 | 0.94mi |
| 2402 Fremont Ave Unit 3 Madison, WI | 2.0 | 1.0 | 900 | $1,475 | $1.64 | 20d | 1 | 0.98mi |
| 1401 Trailsway Unit 3 Madison, WI | 2.0 | 1.0 | 675 | $1,550 | $2.30 | 14d | 1 | 1.00mi |
| 2411 Brentwood Pkwy Unit C Madison, WI | 2.0 | 1.0 | 750 | $1,100 | $1.47 | 14d | 1 | 1.00mi |
| 2505 Monterey Dr Unit 6 Madison, WI | 2.0 | 1.0 | 900 | $1,550 | $1.72 | 14d | 1 | 1.02mi |
| 2405 Monterey Dr Unit 2 Madison, WI | 2.0 | 1.0 | 925 | $1,295 | $1.40 | 44d | 1 | 1.05mi |
| 2018 N Sherman Ave Madison, WI | 1.0 | 1.0 | 750 | $1,195 | $1.59 | 14d | 1 | 1.14mi |
Listing history 16 events
-
2026-06-18days on market $49,900 Active 34 DOM
-
2026-06-17days on market $49,900 Active 33 DOM
-
2026-06-16days on market $49,900 Active 32 DOM
-
2026-06-15days on market $49,900 Active 31 DOM
-
2026-06-14days on market $49,900 Active 29 DOM
-
2026-06-13days on market $49,900 Active 28 DOM
-
2026-06-10days on market $49,900 Active 26 DOM
-
2026-06-09days on market $49,900 Active 25 DOM
-
2026-06-08days on market $49,900 Active 24 DOM
-
2026-06-07days on market $49,900 Active 23 DOM
-
2026-06-03days on market $49,900 Active 19 DOM
-
2026-06-02days on market $49,900 Active 18 DOM
-
2026-06-01pricedays on market $49,900 Active 17 DOM
-
2026-05-31days on market $53,000 Active 16 DOM
-
2026-05-31days on market $53,000 Active 15 DOM
-
2026-05-15$53,000 Active 680-char remark
ⓘ Source: listings_history table (triggers on properties + properties_extension) + one-shot
backfill from property_details.listing_events for pre-trigger history.
Climate risk First Street
- Flood 1/10 Low FEMA zone X (unshaded) · 0% chance over 30 yrs
- Wildfire 3/10 Moderate
- Heat 2/10 Low 7 d/yr ≥100°F today · 14 d/yr by 30 yrs out
- Wind 2/10 Low
- Air quality 3/10 Moderate 2 unhealthy d/yr today · 3 by 30 yrs out
Nearby sold comps map
Loading sold comps map…
Walkable amenities ~0.75 mi
Loading nearby amenities…
Taxation est. · year 1
- Rental income
- $15,500
- − Mortgage interest
- −$2,795
- − Property taxes
- −$748
- − Insurance
- −$250
- − Repairs & maintenance
- −$1,240
- − Management
- −$1,240
- − Depreciation
- −$1,452
- Taxable income
- $7,775
- Est. tax owed @ 24.0%
- −$1,866
- After-tax cash flow
- $6,241/yr
For passive investors: Depreciation is non-cash, so a rental often shows a tax loss while cash-flowing — sheltering income. Rental losses are passive: they offset passive income freely, and up to $25,000/yr can offset ordinary (W-2) income if you actively participate and your MAGI is under $100k (phasing out to $0 by $150k); unused losses carry forward. On sale, claimed depreciation is recaptured at up to 25%, and gains may owe capital-gains tax (a 1031 exchange can defer both). Figures are a year-1 estimate at your 24.0% rate — not tax advice; consult a CPA.
Condition & rehab AI · 12 photos
This 2003 Wick manufactured home requires moderate repairs and maintenance, with a focus on painting and replacing outdated appliances to improve its resale and rental value.
Repairs flagged
- Minor Paint — Some wear on interior walls
- Minor Curtains — Worn curtains in bathrooms
- Moderate Appliances — Estimated 8-9 years old
Value-add opportunities
- Both Paint interior walls — Improves appearance and value
- Both Replace curtains — Freshens up the look
- Both Replace appliances — Modernizes and increases value
Renovation cost estimate screening
| Repair item | Severity | Est. cost |
|---|---|---|
| Paint · Some wear on interior walls | Minor | $500–3,000 |
| Curtains · Worn curtains in bathrooms | Minor | $500–3,000 |
| Appliances · Estimated 8-9 years old | Moderate | $3,000–15,000 |
| Total estimated repair cost · 3 items | $4,000–21,000 |
Value-add ROI direction
- Both Paint interior walls — Improves appearance and value ↑
- Both Replace curtains — Freshens up the look ↑
- Both Replace appliances — Modernizes and increases value ↑
ⓘ Cost ranges are severity-bucket heuristics (US national rule-of-thumb). Get contractor quotes + a written scope before underwriting a rehab budget.
Schools (NCES district)
- District
- Madison Metropolitan School District
- NCES district ID
- 5508520
- Math proficiency
- 35% ▼ -4.00%
- Reading proficiency
- 40% ▲ 3.00%
- Median HH income
- $51,654
- Composite
- 32.56/100
- National rank
- #5686
- State rank
- #193 of 342 in WI
Livability — Madison
- Score
- 84/100
- State rank
- #39
- US rank
- #819
Category grades
Schools grade is shown separately in the Schools card above.
Census & demographics
- Census place
- Madison, WI
- County
- Dane County · 506,461 people
- City population
- 301,931
- Metro
- Madison, WI
- Population (ZIP)
- 46,730
- Household income
- $74,034
- Rent vs Own
- Severe rent burden
- 2064.0
Population outlook (Dane County) Hauer SSP2
- Today (2025)
- 610,707 people
- By 2030
- 654,875 · +7.2%
- By 2040
- 740,480 · +21.2%
- By 2050
- 826,188 · +35.3%
- By 2075
- 1,040,574 · +70.4%
- By 2100
- 1,168,084 · +91.3%
Race, ethnicity, and origin ACS 2023
- Neighborhood character
- Predominantly White (67%)
- Race & ethnicity
- White 67% Two or more races 13% Black 11% Hispanic / Latino 10% Asian 5%
- Hispanic origin (detail)
- Mexican 6%
- Common ancestry
- Portuguese 6% Romanian 4% Italian 3%
- Foreign-born
- 9% · Canada, China, Jamaica
- Languages at home
- 89% English-only · Spanish 6% Other Asian/Pacific 2% Other Indo-European 1%
Political lean MEDSL · Dane
- 2024 margin
- Solid D (+51.7) · D 75.1% · R 23.4% · Other 1.5%
- 2008→2024 swing
- +4.7pp toward D · 2008: 47.0pp · 2024: 51.7pp
- All cycles
- 2024: D+51.7 2020: D+52.6 2016: D+48.0 2012: D+43.6 2008: D+47.0
Not yet ingested
- Civics
- —
Market trends
- HPI YoY
- ▼ -440.26%
- Current HPI
- 293.4723
- Rent YoY
- ▲ 1.14%
- Metro
- Madison, WI
- State GDP YoY
- ▲ 2.10%
- F500 in state
- 20
Industry mix (Fortune 500 HQ in WI)
| Industry | F500 HQs | Revenue |
|---|---|---|
| Industrial Machinery | 4 | $23B |
|
||
| Industrial Technology | 2 | $36B |
|
||
| Insurance | 1 | $36B |
|
||
| Professional Services | 1 | $19B |
|
||
| Utilities | 1 | $9B |
|
||
| Consumer Goods | 1 | $3B |
|
||
Price history
-5.8% since first listed2 events — show timeline
- 2026-06-01 Price Changed $49,900 SCWMLS
- 2026-05-15 Listed $53,000 SCWMLS
Cash-flow waterfall
monthlySold comps — $/sqft
last 12 mo · ≤1 miLoading sold comps…