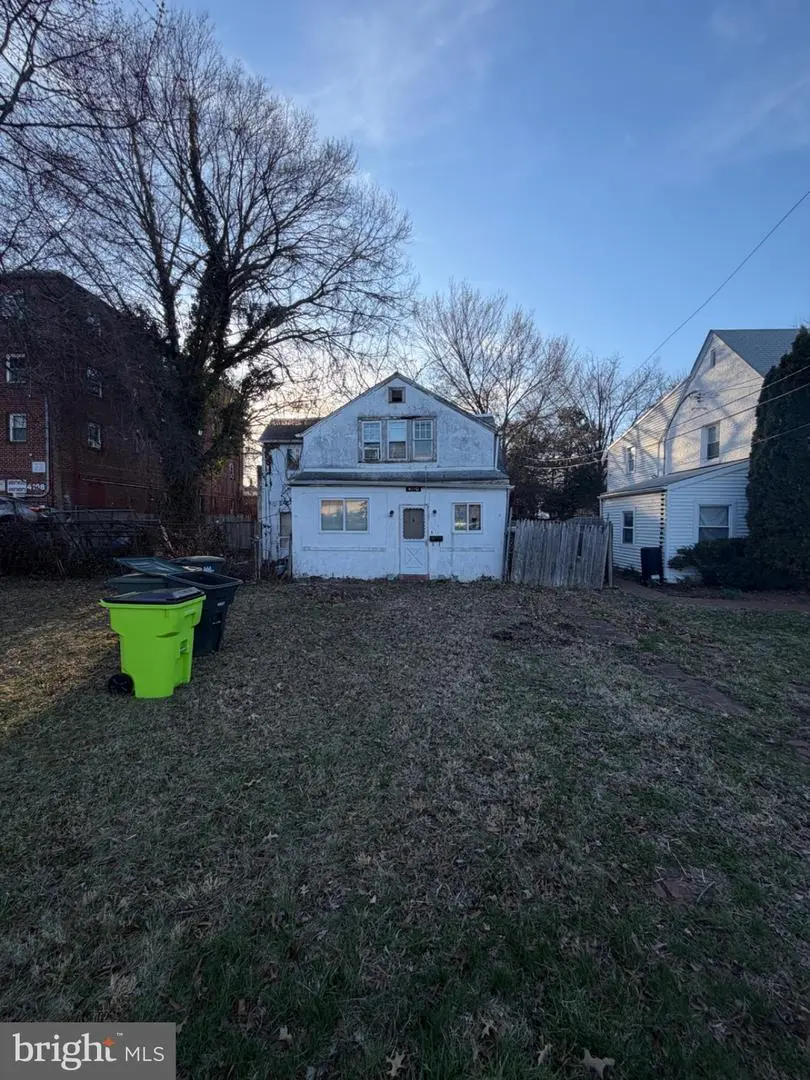
4110 40th St · Brentwood, MD
Flood risk 5/10 · Moderate
- FEMA flood zone
- X (shaded)
- Chance of flooding over 30 yrs
- 0.24%
- Est. flood insurance / yr
- $507 – $1,088
Fire risk 1/10 · Minimal
- Est. fire insurance / yr
- $755 – $1,403
Heat risk 7/10 · Major
- Hot days now (above 105°F)
- 7 days/yr
- Hot days in 30 yrs
- 15 days/yr
Wind risk 4/10 · Minor
- Chance of severe wind over 30 yrs
- 17.0%
Air-quality risk 4/10 · Minor
- Unhealthy air days now
- 4 days/yr
- Unhealthy air days in 30 yrs
- 5 days/yr
Risk factors via First Street. Map © Google.
Why this score? — see what drove the C+ grade
The composite is a weighted blend of 9 inputs, each scored 0–100. Each bar is that input's sub-score; the figure is the points it added to the 100-point composite (weight × sub-score).
- Cash flow +16.3/30.0
- ARV discount +15.0/15.0
- Appreciation +10.0/10.0
- DSCR +5.1/10.0
- 1% rule +4.8/10.0
- Livability +4.2/5.0
- Rent growth +2.5/5.0
- Condition / age +2.5/5.0
- Schools +1.7/10.0
$390,000
🖨 Deal sheet 📄 Offer letter ✓ Due diligence
Listing remarks MLS
Prime development opportunity! This 12,600 sq ft RSF-65 zoned property offers exceptional potential in a sought-after location. The residence features a rare attached commercial auto repair garage at the rear - perfect for an owner-operator business or additional income stream. With possible subdivision potential (to be verified by buyer), this property is ideal for visionary buyers looking to update, expand, or completely redesign. The existing home requires complete rehabilitation or presents an opportunity for a complete rebuild with convenient rear access. Property being sold strictly as-is. Don't miss this unique combination of residential and commercial potential! THE SELLER AND AGENT ARE NOT LIABLE FOR ANY VISITORS' INJURIES. THE BUYER OBTAINED A BOUNDARY SURVEY FOR THE GIVEN FENCE IN AREAS THE SURVEY PROVIDED TO ME SHOWS THE ALLEY AND THE PARK ARE INSIDE OF THE FENCE
Key facts
- 0.29 acre lot
- 5 garage spots
- Built 1900
Neighborhood map
What this means for you Summary
Snapshot
- This is a 4-bed/2.0-bath single-family listed at $390k.
Deal economics
- At list price, monthly cash flow is $217 ($3k/yr) — positive.
- The deal already cash-flows at list — no discount required.
- To meet the 1% rule (rent ≥ 1% of price), the offer needs to be $382k (2.0% below list).
- Recommended offer: $355k (9.0% below list) — sets the bar for market timing.
Location & tenants
- Location reads 83/100 on livability (#24 in MD, #899 nationally) — a professional / high-income tenant draw. Strengths: commute A+, employment A+, housing A+; Watch: schools D-, cost of living D-.
- Prince George'S County Public Schools (suburban): math 8% / reading 24% proficiency, ranked #21 of 24 in MD (top 88%) — low school quality limits family demand, transient renter base, plan for 1-2y turnover.
- Market conditions: 20 active listings in the ZIP; 22 comparable units currently listed for rent nearby; rentals at typical pace (median 16d on market — plan ~3-4 weeks tenant-placement turnaround); solid renter incomes; 1,481 units permitted in Prince George's County in 2024 (0 in 5+ unit buildings).
- At $3,820/mo this rent would consume 50% of the median local household income ($92k/yr) (locally 191% of renters already pay >50% of income on rent) — very limited rent-growth headroom before tenants either downsize or default.
Forward outlook
- In year one you build about $42k of equity ($3k loan paydown + $39k appreciation (10.0% local appreciation)).
- Prince George's County population projected at +18% by 2050 — long-run rental-demand tailwind backs the buy-and-hold thesis.
- At projected returns (10.0% appreciation + 3.0% rent growth), your $109k cash investment doubles in ~3 years — after that, you're playing with house money.
- By year 2, paydown + projected appreciation supports a ~$67k cash-out refi (75% LTV) — recoverable capital for the next deal without selling this one.
Negotiation context
- It's been on market 93 days — a 9% lower offer ($355k) is reasonable based on typical stale-listing flexibility.
- 4 sale attempts since 4y ago with the ask held roughly flat each time — persistent listings suggest the price (not the market) is what's stuck; bring a comps-based counter.
- Current owner paid $135k; list at $390k implies a 189% gain — meaningful room to come down on a strong offer.
Risks & watch-outs
- Watch-outs: built in 1900 — expect roof / HVAC / electrical / plumbing capex.
- Climate carrying-cost: moderate flood risk; extreme-heat days projected 7→15/yr by 2055 (HVAC capex compounding) — expect insurance premiums to compound above CPI over the hold.
Questions for the listing agent
- It's been on market 93 days. Have you received any prior offers? Is the seller open to a 9% concession, seller financing, or rate buy-down credit?
- Built in 1900 — when were the roof, HVAC, electrical panel, plumbing, and water heater last replaced?
- Why hasn't it sold? Are there any deal-killer items the seller is aware of (foundation, flood, title, zoning, code violations)?
- Is there a deadline driving the sale (1031 exchange, divorce, estate, relocation)? That informs how much negotiation room exists.
- Schools are D-rated, which usually means shorter tenancies and higher turnover. Who's the typical renter profile here, and what's been the actual vacancy rate?
- What's the average days-on-market for RENTAL listings here right now (not sales)? A rising rental-DOM trend means longer vacancies and softer asking-rent achievability than the comps imply.
- What's the recent tenant-quality profile in this submarket — average credit score on applications, eviction rate, late-payment / NSF rate, and stable-employment percentage? A property-management company in the area should have these aggregated.
- How much new for-sale + rental construction is in the pipeline within 1–3 miles? Heavy new supply typically softens prices + rents 12–24 months out; constrained supply supports both.
Investment metrics
- 1% rule
- 0.98% ✗
- Cap rate
- 6.96%
- Cash-on-cash
- 2.39%
- DSCR
- 1.11
- GRM
- 8.5
CMA / ARV
- ARV (median comp)
- $558,623
- List price
- $390,000
- Delta
- -30.19%
- Verdict
- UNDERPRICED
- Comps
- 20 within 1.0 mi
Show comp detail 12 sales within ~0.75 mi
| Address | Dist | Beds/Ba | Sqft | Sold | Price | $/sf | Match |
|---|---|---|---|---|---|---|---|
| 4001 Shepherd St | 0.06mi | 4/4.0 | 2,052 (+2%) | 3mo | $560,000 | $273 | 83 |
| 4014 32nd St | 0.44mi | 4/3.0 | 2,030 (+1%) | 0mo | $605,000 | $298 | 74 |
| 4240 34th St | 0.40mi | 4/2.5 | 1,930 (-4%) | 2mo | $735,000 | $381 | 71 |
| 3722 36th St | 0.41mi | 4/3.5 | 2,048 (+2%) | 9mo | $629,500 | $307 | 64 |
| 4110 29th St | 0.63mi | 4/2.0 | 1,975 (-2%) | 6mo | $515,000 | $261 | 62 |
| 3110 Taylor St | 0.44mi | 3/1.0 (-1) | 1,877 (-6%) | 1mo | $330,000 | $176 | 59 |
| 4100 31st St | 0.50mi | 5/3.5 (+1) | 2,050 (+2%) | 6mo | $645,000 | $315 | 57 |
| 3421 Newton St | 0.56mi | 5/4.0 (+1) | 2,025 (+1%) | 5mo | $570,000 | $281 | 55 |
| 4000 Lawrence St | 0.71mi | 4/2.0 | 1,944 (-3%) | 9mo | $439,900 | $226 | 54 |
| 4217 29th St | 0.63mi | 4/3.0 | 1,852 (-8%) | 0mo | $515,000 | $278 | 53 |
| 4310 31st St | 0.58mi | 4/3.5 | 1,875 (-7%) | 4mo | $539,000 | $287 | 52 |
| 3415 40th Pl | 0.67mi | 3/2.5 (-1) | 1,905 (-5%) | 8mo | $350,000 | $184 | 47 |
Match score weights: distance 35% · size 25% · config 20% · recency 20%. Top-matched comps best support the ARV.
Projected returns pro-forma
10.0% appreciation · 3.0% rent growth · sell at horizon
- IRR
- 26.0%
- Equity multiple
- 3.07×
- Total profit
- $226,369
- Equity at exit
- $351,343
- IRR
- 22.8%
- Equity multiple
- 7.01×
- Total profit
- $655,978
- Equity at exit
- $757,684
Cash invested: $109,200 (down + closing). Projections, not guarantees.
Landlord ↔ Tenant lean methodology
- Overall (STATE)
- 27 Tenant-Leaning
- State Maryland
- 27 Tenant-Leaning · D+14
- County
- — inherits STATE
- City
- — inherits STATE
ZIP-level market 20722
- Home prices YoY
- 4.1%
- Active inventory
- 20
- Price-to-rent
- 8.5×
Monthly cashflow live
- Estimated rent
- $3,820 high interval (Pro) →
- Mortgage (P&I)
- −$2,045
- Tax from tax record
- −$593 /mo · $7,114/yr
- Insurance
- −$162
- HOA
- −$0
- Vacancy / Maint / Mgmt
- −$802
- Net cashflow
- $217
Break-even live
UW: 25.0% down · 7.5% · 30yr · 1.5% tax · 5.0% vac · 8.0% maint · 8.0% mgmt
Financing live
Cash to close
- Down payment
- $97,500
- Closing costs
- $11,700
- Reserves months
- —
- Total cash needed
- —
Loan-product check · same deal, 3 products live
Conventional
25% down · 7.5% · 30yr
- Down + closing
- —
- Monthly P&I
- —
- Monthly cashflow
- —
- DSCR
- —
- Eligible?
- —
Personal DTI + credit; lowest rate.
DSCR
20% down · 8.5% · 30yr
- Down + closing
- —
- Monthly P&I
- —
- Monthly cashflow
- —
- DSCR
- —
- Eligible?
- —
No personal income docs; deal must DSCR.
Hard money
10% down · 12.0% · 12mo
- Down + closing
- —
- Monthly P&I
- —
- Monthly cashflow
- —
- DSCR
- —
- Eligible?
- —
Short-term bridge; refi at stabilization.
Rent comps 22 comps
| Address | Beds | Baths | Sqft | Rent | $/sqft | DOM | Units | Dist |
|---|---|---|---|---|---|---|---|---|
| 4222 34th St Mount Rainier, MD | 5.0 | 3.0 | 1620 | $3,950 | $2.44 | 1d | 1 | 0.35mi |
| 3200 Bunker Hill Rd Mount Rainier, MD | 5.0 | 3.0 | 2500 | $3,995 | $1.60 | 43d | 1 | 0.42mi |
| 3704 42nd Ave Brentwood, MD | 4.0 | 2.0 | 1678 | $3,900 | $2.32 | 11d | 1 | 0.53mi |
| 4519 32nd St Mount Rainier, MD | 3.0 | 2.0 | 1500 | $1,200 | $0.80 | 12d | 1 | 0.58mi |
| 4531 32nd St Mount Rainier, MD | 3.0 | 2.0 | 1524 | $2,500 | $1.64 | 43d | 1 | 0.62mi |
| 4221 28th St Mount Rainier, MD | 3.0 | 3.0 | 1800 | $3,500 | $1.94 | 18d | 1 | 0.67mi |
| 4401 29th St Unit A Mt Rainier, MD | 4.0 | 2.0 | 1800 | $3,500 | $1.94 | 4d | 1 | 0.67mi |
| 2615 Otis St NE Washington, DC | 3.0 | 2.0 | 2217 | $3,750 | $1.69 | 3d | 1 | 0.84mi |
| 3704 Hamilton St Hyattsville, MD | 4.0 | 3.0 | 1978 | $4,000 | $2.02 | 5d | 1 | 0.89mi |
| 2600 Queens Chapel Rd Hyattsville, MD | 1.0–3.0 | 1.0–2.0 | 1086 | $2,545 | $2.34 | 12d | 9 | 0.91mi |
| 2417 Otis St NE Washington, DC | 3.0 | 2.5 | 1854 | $3,899 | $2.10 | 7d | 1 | 0.92mi |
| 3149 Cherry Rd NE Washington, DC | 3.0 | 3.5 | 1881 | $3,795 | $2.02 | 15d | 1 | 1.05mi |
| 3309 22nd St NE Washington, DC | 4.0 | 3.5 | 2759 | $5,850 | $2.12 | 24d | 1 | 1.16mi |
| 2712 South Dakota Ave NE Washington, DC | 3.0 | 3.0 | 2261 | $4,500 | $1.99 | 2d | 1 | 1.16mi |
| 3634 Commodore Joshua Barney Dr NE Washington, DC | 4.0 | 4.5 | 2100 | $4,100 | $1.95 | 24d | 1 | 1.17mi |
| 3216 22nd St NE Washington, DC | 3.0 | 2.0 | 2156 | $4,500 | $2.09 | 18d | 1 | 1.21mi |
| 2414 Hamlin Pl NE Washington, DC | 3.0 | 1.5 | 1500 | $2,550 | $1.70 | 18d | 1 | 1.29mi |
| 2410 South Dakota Ave NE Washington, DC | 4.0 | 3.5 | 2222 | $4,400 | $1.98 | 14d | 1 | 1.30mi |
| 5503 44th Ave Hyattsville, MD | 5.0 | 3.5 | 2124 | $5,000 | $2.35 | 18d | 1 | 1.31mi |
| 5685 Little Branch Run Hyattsville, MD | 3.0 | 1.0–2.0 | 939 | $4,184 | $4.46 | 1d | 24 | 1.34mi |
| 1663 Webster St NE Washington, DC | 4.0 | 2.5 | 1758 | $3,757 | $2.14 | 18d | 1 | 1.37mi |
| 2705 24th St NE Washington, DC | 3.0 | 2.0 | 1900 | $3,150 | $1.66 | 24d | 1 | 1.41mi |
Listing history 27 events
-
2026-06-18days on market $390,000 Active 93 DOM
-
2026-06-17days on market $390,000 Active 92 DOM
-
2026-06-16days on market $390,000 Active 91 DOM
-
2026-06-15days on market $390,000 Active 90 DOM
-
2026-06-13days on market $390,000 Active 88 DOM
-
2026-06-10days on market $390,000 Active 84 DOM
-
2026-06-08days on market $390,000 Active 83 DOM
-
2026-06-07days on market $390,000 Active 82 DOM
-
2026-06-04days on market $390,000 Active 79 DOM
-
2026-06-03days on market $390,000 Active 78 DOM
-
2026-06-02days on market $390,000 Active 77 DOM
-
2026-06-01days on market $390,000 Active 76 DOM
-
2026-03-15historical 887-char remark
Show marketing remark (887 chars)
Prime development opportunity! This 12,600 sq ft RSF-65 zoned property offers exceptional potential in a sought-after location. The residence features a rare attached commercial auto repair garage at the rear - perfect for an owner-operator business or additional income stream. With possible subdivision potential (to be verified by buyer), this property is ideal for visionary buyers looking to update, expand, or completely redesign. The existing home requires complete rehabilitation or presents an opportunity for a complete rebuild with convenient rear access. Property being sold strictly as-is. Don't miss this unique combination of residential and commercial potential! THE SELLER AND AGENT ARE NOT LIABLE FOR ANY VISITORS' INJURIES. THE BUYER OBTAINED A BOUNDARY SURVEY FOR THE GIVEN FENCE IN AREAS THE SURVEY PROVIDED TO ME SHOWS THE ALLEY AND THE PARK ARE INSIDE OF THE FENCE
-
2026-03-15$390,000 Active 887-char remark
Show marketing remark (887 chars)
Prime development opportunity! This 12,600 sq ft RSF-65 zoned property offers exceptional potential in a sought-after location. The residence features a rare attached commercial auto repair garage at the rear - perfect for an owner-operator business or additional income stream. With possible subdivision potential (to be verified by buyer), this property is ideal for visionary buyers looking to update, expand, or completely redesign. The existing home requires complete rehabilitation or presents an opportunity for a complete rebuild with convenient rear access. Property being sold strictly as-is. Don't miss this unique combination of residential and commercial potential! THE SELLER AND AGENT ARE NOT LIABLE FOR ANY VISITORS' INJURIES. THE BUYER OBTAINED A BOUNDARY SURVEY FOR THE GIVEN FENCE IN AREAS THE SURVEY PROVIDED TO ME SHOWS THE ALLEY AND THE PARK ARE INSIDE OF THE FENCE
-
2026-03-12price $390,000 887-char remark
Show marketing remark (887 chars)
Prime development opportunity! This 12,600 sq ft RSF-65 zoned property offers exceptional potential in a sought-after location. The residence features a rare attached commercial auto repair garage at the rear - perfect for an owner-operator business or additional income stream. With possible subdivision potential (to be verified by buyer), this property is ideal for visionary buyers looking to update, expand, or completely redesign. The existing home requires complete rehabilitation or presents an opportunity for a complete rebuild with convenient rear access. Property being sold strictly as-is. Don't miss this unique combination of residential and commercial potential! THE SELLER AND AGENT ARE NOT LIABLE FOR ANY VISITORS' INJURIES. THE BUYER OBTAINED A BOUNDARY SURVEY FOR THE GIVEN FENCE IN AREAS THE SURVEY PROVIDED TO ME SHOWS THE ALLEY AND THE PARK ARE INSIDE OF THE FENCE
-
2025-07-18status Pending
-
2025-07-18historical
-
2025-07-02$212,500 Active
-
2022-11-15historical
-
2022-11-15price $330,000
-
2022-11-15status Active
-
2022-10-14historical
-
2022-07-14price $450,000
-
2022-05-19$599,000 Active
-
2000-05-17soldstatus $135,000
-
1999-11-05soldstatus $75,000
-
1981-07-31soldstatus $50,000
ⓘ Source: listings_history table (triggers on properties + properties_extension) + one-shot
backfill from property_details.listing_events for pre-trigger history.
Tax reassessment forecast MD · Partial reset (capped growth)
- Current annual tax
- $7,114 · $593/mo
- Projected year-2 tax
- $7,114 · $593/mo
- Expected delta
- $0/yr ($0/mo · 0.0%)
ⓘ Screening estimate from a state-policy table — verify with the county assessor before closing.
Climate risk First Street
- Flood 5/10 Major FEMA zone X (shaded) · 24% chance over 30 yrs
- Wildfire 1/10 Low
- Heat 7/10 Severe 7 d/yr ≥105°F today · 15 d/yr by 30 yrs out
- Wind 4/10 Moderate 17% chance of damaging wind over 30 yrs
- Air quality 4/10 Moderate 4 unhealthy d/yr today · 5 by 30 yrs out
Nearby sold comps map
Loading sold comps map…
Walkable amenities ~0.75 mi
Loading nearby amenities…
Taxation est. · year 1
- Rental income
- $45,842
- − Mortgage interest
- −$21,846
- − Property taxes
- −$7,114
- − Insurance
- −$1,950
- − Repairs & maintenance
- −$3,667
- − Management
- −$3,667
- − Depreciation
- −$11,345
- Taxable loss
- −$3,749
- Est. tax savings @ 24.0%
- +$900
- After-tax cash flow
- $3,508/yr
For passive investors: Depreciation is non-cash, so a rental often shows a tax loss while cash-flowing — sheltering income. Rental losses are passive: they offset passive income freely, and up to $25,000/yr can offset ordinary (W-2) income if you actively participate and your MAGI is under $100k (phasing out to $0 by $150k); unused losses carry forward. On sale, claimed depreciation is recaptured at up to 25%, and gains may owe capital-gains tax (a 1031 exchange can defer both). Figures are a year-1 estimate at your 24.0% rate — not tax advice; consult a CPA.
Schools (NCES district)
- District
- Prince George'S County Public Schools
- NCES district ID
- 2400510
- Math proficiency
- 8% ▼ -11.00%
- Reading proficiency
- 24% ▼ -9.00%
- Median HH income
- $73,967
- Composite
- 16.82/100
- National rank
- #9151
- State rank
- #21 of 24 in MD
Livability — Brentwood
- Score
- 83/100
- State rank
- #24
- US rank
- #899
Category grades
Schools grade is shown separately in the Schools card above.
Census & demographics
- Census place
- Brentwood, MD
- County
- Prince Georges County · 919,866 people
- Metro
- Washington-Arlington-Alexandria, DC-VA-MD-WV
- Population (ZIP)
- 6,264
- Household income
- $91,875
- Rent vs Own
- Severe rent burden
- 191.0
Population outlook (Prince George's County) Hauer SSP2
- Today (2025)
- 1,005,426 people
- By 2030
- 1,048,416 · +4.3%
- By 2040
- 1,123,425 · +11.7%
- By 2050
- 1,183,220 · +17.7%
- By 2075
- 1,306,202 · +29.9%
- By 2100
- 1,408,179 · +40.1%
Race, ethnicity, and origin ACS 2023
- Neighborhood character
- Diverse neighborhood (Simpson 0.62)
- Race & ethnicity
- Hispanic / Latino 53% Black 29% Two or more races 15% White 10% Native American 3% Asian 3%
- Hispanic origin (detail)
- Mexican 8% Dominican 2%
- Common ancestry
- Slovak 1% Italian 1% Lithuanian 1%
- Foreign-born
- 39% · Canada
- Languages at home
- 45% English-only · Spanish 48% Tagalog/Filipino 2% French/Haitian/Cajun 2%
Political lean MEDSL · Prince George's
- 2024 margin
- Solid D (+75.2) · D 86.3% · R 11.2% · Other 2.5%
- 2008→2024 swing
- -3.3pp toward R · 2008: 78.5pp · 2024: 75.2pp
- All cycles
- 2024: D+75.2 2020: D+80.5 2016: D+81.0 2012: D+80.9 2008: D+78.5
Not yet ingested
- Civics
- —
Market trends
- HPI YoY
- ▲ 16.77%
- Current HPI
- 421.2708
- Rent YoY
- —
- Metro
- Washington-Arlington-Alexandria, DC-VA-MD-WV
- State GDP YoY
- ▲ 2.97%
- F500 in state
- 12
Industry mix (Fortune 500 HQ in MD)
| Industry | F500 HQs | Revenue |
|---|---|---|
| Aerospace / Defense | 1 | $71B |
|
||
| Utilities | 1 | $25B |
|
||
| Hotels | 1 | $24B |
|
||
| Consumer Goods | 1 | $7B |
|
||
| Real Estate | 1 | $6B |
|
||
| Chemicals | 1 | $2B |
|
||
Price history
+680.0% since first listed15 events — show timeline
- 2026-03-15 Listing Removed — BRIGHT MLS
- 2026-03-15 Listed $390,000 BRIGHT MLS
- 2026-03-12 Price Changed $390,000 BRIGHT MLS
- 2025-07-18 Pending — BRIGHT MLS
- 2025-07-18 Listing Removed — BRIGHT MLS
- 2025-07-02 Listed $212,500 BRIGHT MLS
- 2022-11-15 Listing Removed — BRIGHT MLS
- 2022-11-15 Price Changed $330,000 BRIGHT MLS
- 2022-11-15 Relisted — BRIGHT MLS
- 2022-10-14 Listing Removed — BRIGHT MLS
- 2022-07-14 Price Changed $450,000 BRIGHT MLS
- 2022-05-19 Listed $599,000 BRIGHT MLS
- 2000-05-17 Sold (Public Records) $135,000 Public Records
- 1999-11-05 Sold (Public Records) $75,000 Public Records
- 1981-07-31 Sold (Public Records) $50,000 Public Records
Property tax history
+7.0%/yrLatest (2025): $7,114 · +1.9% YoY. Source: county tax records.
Cash-flow waterfall
monthlySold comps — $/sqft
last 12 mo · ≤1 miLoading sold comps…